The influenza pandemic of 2009 had a great social impact. Many health resources were devoted to the care, prevention and surveillance of this disease. Epidemiological surveillance is based on the reporting of cases of influenza-like illness (ILI) and confirmed influenza cases. The objective was to estimate the true incidence of ILI during the influenza pandemic of 2009.
MethodsThe capture–recapture method was applied during the month of highest influenza incidence in Castellón. Two notification systems were used: (i) electronic reporting of Notifiable Diseases (ND), and (ii) laboratory-based (LAB) data collection. Estimates were made by stratifying by age group and week. Independence coefficients were calculated for those strata.
ResultsNo dependence was found between stratification variables and the reporting system. A total of 7181 ND cases and 524 LAB cases were identified, of which 211 were recorded in both systems. The estimated total of cases was 17785 in a single month. In the study period, almost 4% of people in the area suffered flu symptoms (cumulative incidence), with 1% being affected each day (daily prevalence). The sensitivity of the ND system was 40%, i.e., the percentage of patients seeking primary care.
ConclusionsTo obtain an estimate of the actual incidence of influenza-like illness in the population during a pandemic period, the number of medical consultations should be multiplied by a factor of 2.5. This factor is lower than that estimated for periods without pandemic alert.
La pandemia de gripe de 2009 tuvo una gran repercusión social. Se dedicaron muchos recursos sanitarios a la atención médica, la prevención y la vigilancia epidemiológica. La vigilancia epidemiológica se sustenta en la notificación de casos de síndrome gripal y de casos confirmados de gripe. El objetivo fue la estimación de la incidencia real de síndrome gripal durante la pandemia de gripe de 2009.
MétodosSistema de captura-recaptura durante el mes de mayor incidencia en Castellón. Se utilizaron 2 sistemas de información: a) sistema electrónico de notificación de enfermedades de declaración obligatoria (EDO), y b) datos de laboratorio (LAB). Las estimaciones se han realizado estratificando por grupo de edad y semana. Se calculó el coeficiente de independencia en estos estratos.
ResultadosEn total se identificaron 7.181 casos EDO y 524 LAB, de los que 211 coincidían en ambos sistemas. La estimación total fue de 17.785 casos en un mes. Ello significa que en el periodo estudiado casi el 4% de las personas del área sufrieron un cuadro gripal (incidencia acumulada), y aproximadamente una de cada 100 personas estuvo diariamente afectada (prevalencia diaria). Acudieron a consulta de atención primaria (EDO) un 40% de los afectados (sensibilidad del sistema EDO).
ConclusionesPara obtener una estimación de la incidencia real en la población durante la pandemia habría que multiplicar la cifra de consultas médicas por un factor de 2,5. Este factor es inferior al estimado en periodos sin alerta pandémica.
Influenza is an acute viral respiratory tract disease. A large proportion of cases present with a syndrome known as influenza-like illness, with symptoms of fever, cough, headache, myalgia, coryza and prostration that resolve after a few days. Other forms of influenza presentation include upper respiratory tract disease, bronchiolitis and pneumonia. The risk of complications is greater in very young children and in the elderly. Influenza infection can also be asymptomatic, and if it is not identified in the laboratory, influenza-like illness can be indistinguishable from infections caused by other microorganisms.1
In our latitudes, the seasonal nature of influenza is well established. Occasionally, pandemics of unpredictable magnitude and severity occur; in Spain the most recent was in 2009. In April of that year, the first case of influenza A (H1N1)pmd09 virus infection was reported. In the 14 months between 11 June 2009 and 10 August 2010, health authorities were on maximum alert for an influenza pandemic declared by the World Health Organization, following worldwide identification and spread of this virus.2 Certain aspects of this exceptional situation are still currently under investigation.3–6
In events such as these, epidemiological surveillance systems are essential for monitoring the incidence of this disease. These systems collect information from patients seen in hospitals, emergency rooms or in primary care clinics, and both confirmed cases and influenza-like illnesses without microbiological confirmation are registered. Some patients, however, do not seek medical help, and these cases increase the disease burden in the community and contribute to the continuance and propagation of the virus. In England,7 it has been calculated that only around 10% of patients with influenza-like illness seek medical care during influenza season, but during the 2009 pandemic, this figure rose to between 30% and 70%. To our knowledge, no such estimates have been published in Spain.
There are several fundamental issues underlying this study: epidemiological monitoring in almost all diseases, including influenza, is incomplete. These shortcomings have led to the development of mathematical tools for calculating disease incidences from different patient registries, and one such validated tool is the capture–recapture method.8 To apply this method, we used the 2 epidemiological reporting systems for cases of pandemic influenza available in Castellón.
The aim of this study was to estimate the total number of cases of influenza-like illness in Castellón from data obtained from these 2 epidemiological surveillance systems: compulsory reporting of notifiable disease (ND) and microbiological surveillance from laboratory data. Estimates were made for total cases, by age group and week of notification in the month of highest incidence.
MethodsThe study population comprised about 470000 inhabitants, representing Castellón Health Departments 2 and 3. The study period focused on the month of November, weeks 44–47, of the year 2009. This was the time of peak influenza incidence in our area. The primary study variable was estimation of the total number of influenza-like illnesses. The secondary variable was calculation of the sensitivity of the ND system and daily prevalence.
Two data sources were used. The first was the ND system, which collects clinical diagnoses of influenza-like illness from primary care consultations. In our regional community, these data are computerized and include patient identification details (age, sex) and date and place of notification.
The second source, which we will call LAB, came from a laboratory data system set up during the pandemic to detect confirmed cases of influenza from requests for microbiological analysis received by the only laboratory in our area equipped to make this diagnosis. Techniques used included immunochromatography and RT-PCR (QUIAGEN®). All cases for which analysis was requested due to suspected influenza were included, whether the result was positive or negative. This approach was taken to equate the system with the ND system, in which reports are made exclusively on the basis of clinical suspicion, with no laboratory confirmation. However, calculations were made on the basis of positive, negative and overall LAB results, to identify differences between the 2 possibilities. Both the ND and the LAB systems are universal and encompass the whole study region.
To avoid intrasystem repetitions, patients appearing twice in the same registry, on the same date or in the same week were identified, in which case only the first visit of each patient was taken into consideration.
After intrasystem repetitions were excluded, a pooled database was created with data from both the ND and LAB registries, using SPSS software version 14. Intersystem repetitions (those registered in both systems) were then located. The total number of cases was then estimated using the capture–recapture method,8,9 described below with examples from the data obtained in this study. Estimates per age (6) and week (4) strata were then calculated. Sensitivity of the ND system was calculated, defined as the ratio between the cases notified and the total estimated number of real cases in the community, expressed as percentage. Conversely, the multiplier factor, by which the number of notified cases would have to be multiplied to obtain an estimate of the real number of cases in the community, was also defined.
The Epi Info version 6.0410 program was used for calculating the independence coefficient by strata. Overall reporting percentages were calculated for each age group and each week. The 2-tailed Chi-squared test was used for comparing the percentages of variables within the 2 systems. The populations listed by the local health authorities for 2009 were used to calculate accumulated incidence rates.
Finally, an estimate of the daily prevalence (average) over the study period was made using the approximation formula: Prevalence=Incidence×Duration.11 For this calculation, disease duration was taken as a time fraction of 28 days, so that, in the formula, a duration of 7 days was 0.25 and a duration of 5 days was 0.18 (5/28).
In the Sentinel Medical Network of our area, only 1 general practitioner and 1 pediatrician reported 89 cases to the ND system during this period, so these cases were not taken into consideration in this analysis.
Regarding ethics, this study was performed during an epidemic outbreak, declared a pandemic by the WHO, from data available in ND epidemiological surveillance systems. No information was added from clinical records or any other source of personal data, as a standard epidemiological surveillance task. For this reason, obtaining informed consent from the cases was not considered necessary.
ResultsThroughout the study period, a total of 7967 cases were registered in the 2 systems: 7436 in the ND system and 531 in the LAB system; 255 (3.4%) and 7 (1.3%) were excluded, respectively, due to intrasystem repetition. The final total was 7181 ND cases and 524 LAB cases, of which 211 appeared in both systems. The characteristics of the cases in each system are shown in Table 1. Some significant differences can be observed with respect to age, week of notification, and in particular, rate of hospitalization. In terms of gender, patients were distributed fairly evenly. When both systems were pooled, the total number of cases identified was 7494 (7181+524−211).
Characteristics of Cases Reported in Each of the 2 Epidemiological Reporting Systems.
| System 1: ND (n=7.181) | System 2: LAB (+/−) (n=524) | P | |
|---|---|---|---|
| Sex (% female) | 3594 (50.1) | 254 (48.5) | .515 |
| Younger than 15 years (%) | 3314 (46.1) | 208 (39.7) | .010 |
| Hospitalized (%) | 40 (0.6) | 166 (31.7) | <.001 |
| Period (week 2009) | |||
| Week 44 | 1011 (14.1) | 60 (11.5) | <.001 |
| Week 45 | 2096 (29.2) | 119 (22.7) | |
| Week 46 | 2551 (35.5) | 132 (25.2) | |
| Week 47 | 1523 (21.2) | 213 (40.7) | |
ND: notifiable diseases; LAB (+/−): laboratory, total tests requested.
The overall estimate obtained for the whole month was 17785 cases. This means that 3.7% (confidence interval: 3.4%–4.1%) of the population was affected by influenza-like illness during the 4-week study period. Table 2 shows in detail the algebraic formula used for simple calculation and for obtaining this result. If we only take into account the 371 cases confirmed in the LAB system, the estimate (17930 cases) is 0.8% greater, which is practically the same, although precision is somewhat lower, as reflected by the wider confidence intervals obtained (Table 3).
Simple Calculation Using Capture–Recapture Method.
| (a) General algebraic notation for simple estimation | |||
|---|---|---|---|
| System 1 | Total | ||
| Yes | No | ||
| System | |||
| Yes | a | c | n2 |
| No | b | x | |
| Total | n1 | N | |
| N=a+b+c+xa/N=[(a+c)/N]*[(a+b)/N]giving:a(a+b+c+x′)=(a+c)(a+b)Estimate of x=>x′=(bc)/a(MLE – maximum likelihood estimate)Estimate of x=>x′=(bc)/(a+1)(NUE – nearly unbiased estimate). | |||
| (b) Application to this case with data from all patients for whom influenza testing was requested | |||
|---|---|---|---|
| ND System | Total | ||
| Yes | No | ||
| Laboratory system | |||
| Yes | 211 | 6970 | 7181 |
| No | 313 | x | |
| Total | 524 | N | |
| Estimationx′=(313*6970)/(211+1)=10290.6N=211+6970+313+10290.6=17784.6≈17785 | |||
Distribution of Cases Reported in Each of the 2 Systems and Total Estimate Taking in Account Only the Confirmed Case (LAB+) or All Cases (LAB+/−).
| Laboratory | LAB+ | LAB+/− | ND | Repetitions | Estimate | 95% CI |
|---|---|---|---|---|---|---|
| Confirmed only | 371 | 7181 | 148 | 17930 | 15731–20129 | |
| All requests | 524 | 7181 | 211 | 17785 | 15968–19602 |
LAB: cases detected in the laboratory after request for analysis (LAB+: positive result; LAB +/−: positives and negatives); ND: notifiable diseases.
Total of cases identified by both systems: 7494.
Sensitivity both systems: 42.1% (38.2–46.9).
Sensitivity of the ND system was 40.4% (36.6%–45.0%) compared to the 3% (2.7%–3.3%) of the LAB system. The multiplier applicable to the ND system was calculated to be 2.5 (17785 divided by 7181). A total of 7494 patients were identified in both systems, giving a pooled sensitivity of 42.1% (41.4%–42.9%).
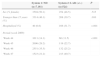
Estimates obtained by age group and sensitivity, separately for each system, LAB and ND, are shown in Table 4. The estimate stratified for age was 17068. The estimate stratified for weeks was 17387 cases, and was more homogeneous (data for weekly strata not shown). These results are slightly lower than the overall (unstratified) estimate but fall within confidence limits (15968 to 19602, Table 3). No statistically significant differences were detected among the estimates by strata. Independence coefficients calculated by age strata and by week strata were −0.25 and −0.26, respectively with P-values of .746 and .621, so the assumption of independence between systems was not rejected.10,12–14
Distribution of Cases Reported in Each of the 2 Systems (LAB or ND) and Estimates and Sensitivity Calculated by Age Groups.
| Age | LAB +/−, cases | ND, cases | Repetitions, cases | Estimate, cases | LAB sensitivity (95% CI) | ND sensitivity (95% CI) |
|---|---|---|---|---|---|---|
| 0–4 | 63 | 632 | 24 | 1619 | 4% (2–6) | 39% (30–55) |
| 5–14 | 145 | 2682 | 76 | 5086 | 3% (2–3) | 53% (46–62) |
| 15–24 | 52 | 1244 | 21 | 2998 | 2% (1–3) | 41% (32–60) |
| 25–44 | 136 | 1871 | 47 | 5342 | 3% (2–3) | 35% (29–45) |
| 45–64 | 87 | 676 | 34 | 1701 | 5% (4–7) | 46% (32–53) |
| >64 | 41 | 76 | 9 | 322 | 3% (9–25) | 24% (16–46) |
| Total | 524 | 7181 | 211 | ∑=17068a |
ND: notifiable diseases: LAB: cases detected in the laboratory after request for analysis, whether positive or negative.
Independence coefficient: −0.26; P=.621.
The sum of estimated cases by age strata (17058) does not necessarily have to coincide with the overall estimate of Table 2 (17785).
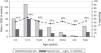
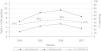
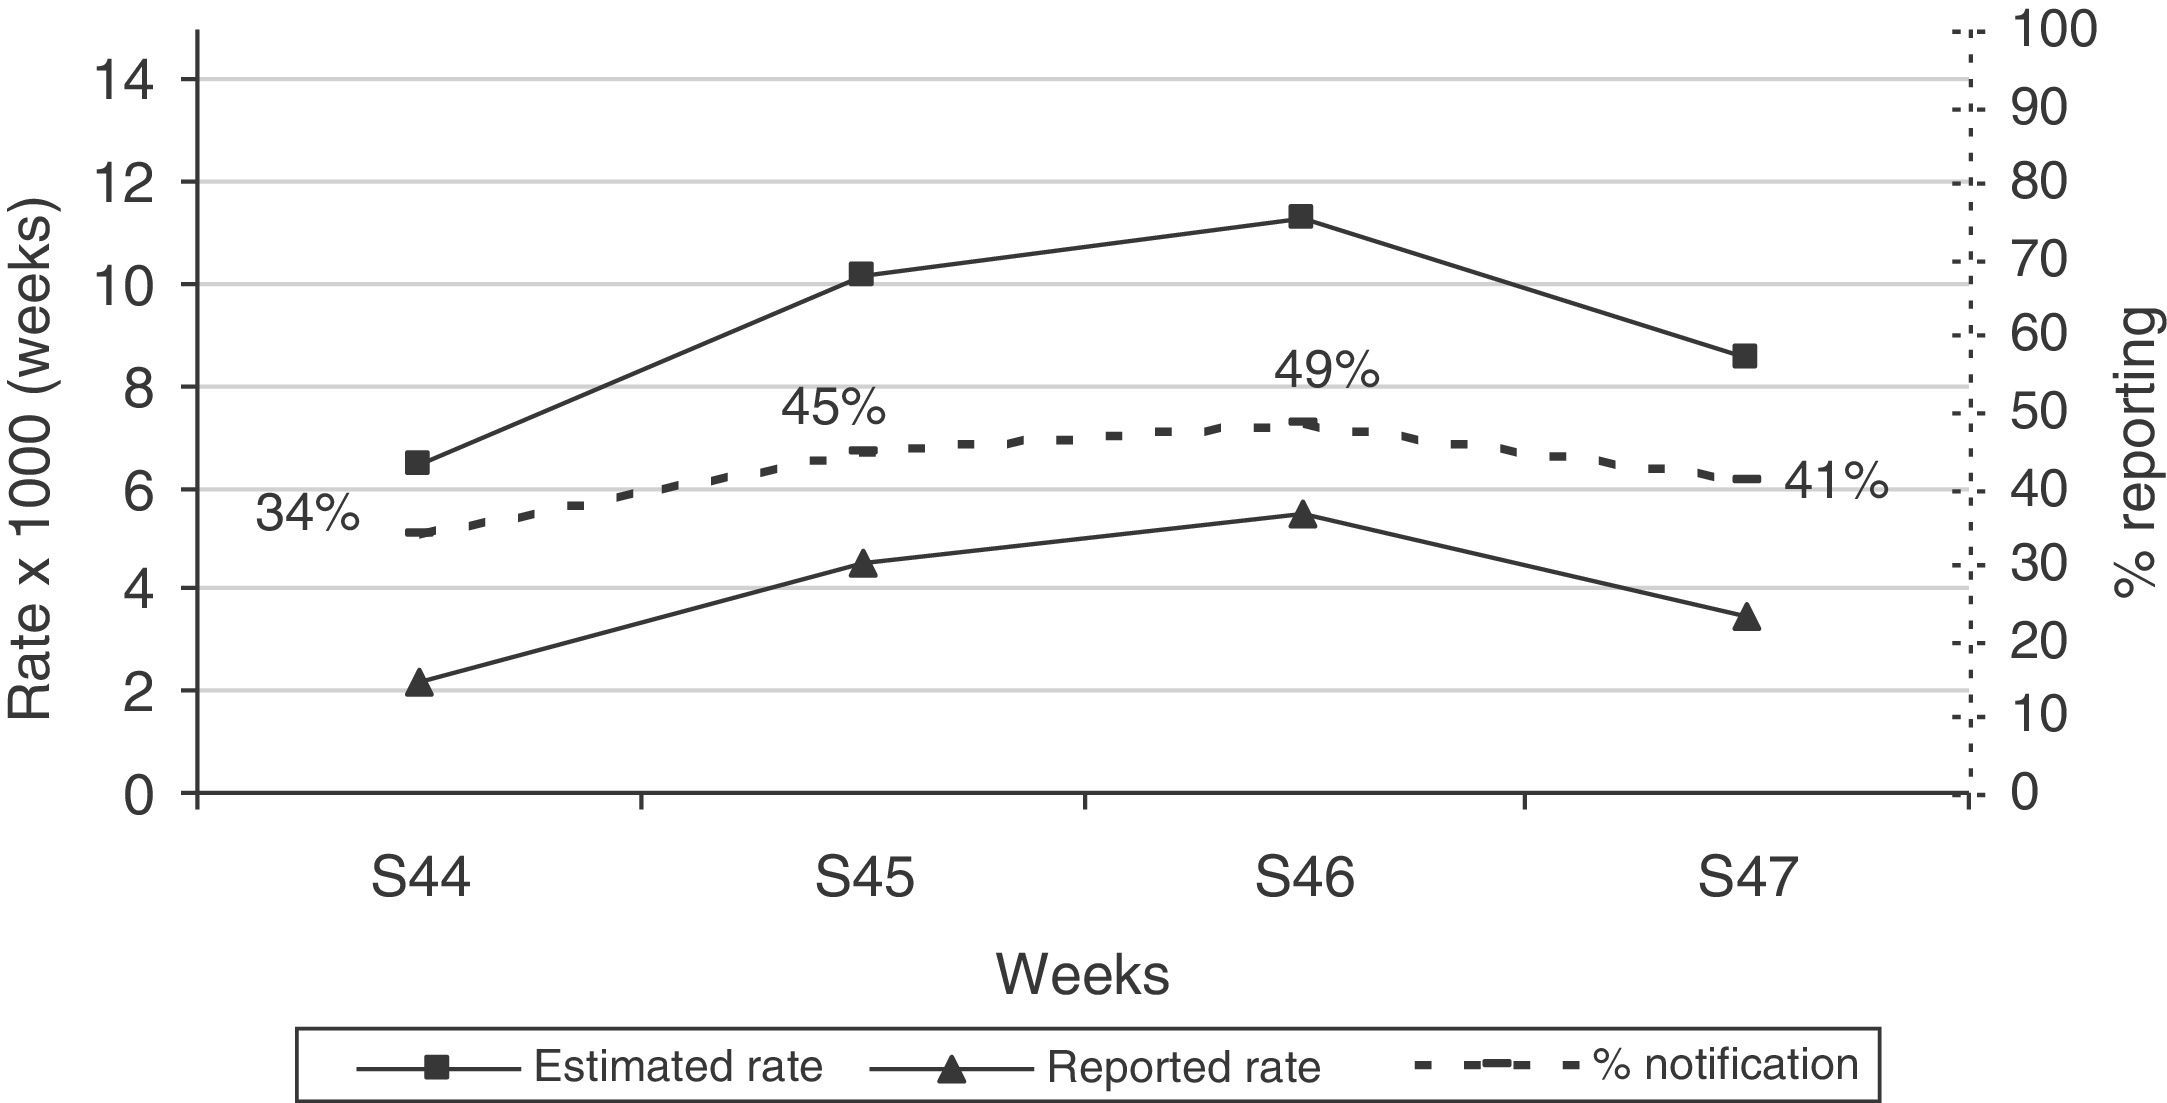
Incidence rates and sensitivity of the pooled LAB and ND systems by age group and by week are shown in Figs. 1 and 2. With respect to age, the age group with the highest incidence, i.e., from 5–14 years, is the most sensitive. The group with the lowest incidence, i.e., elderly subjects, is the least sensitive (Fig. 1). During the 4 weeks of the study, sensitivity of both pooled systems was maintained at around 40%, with some variations with respect to the weekly incidence of influenza (Fig. 2).
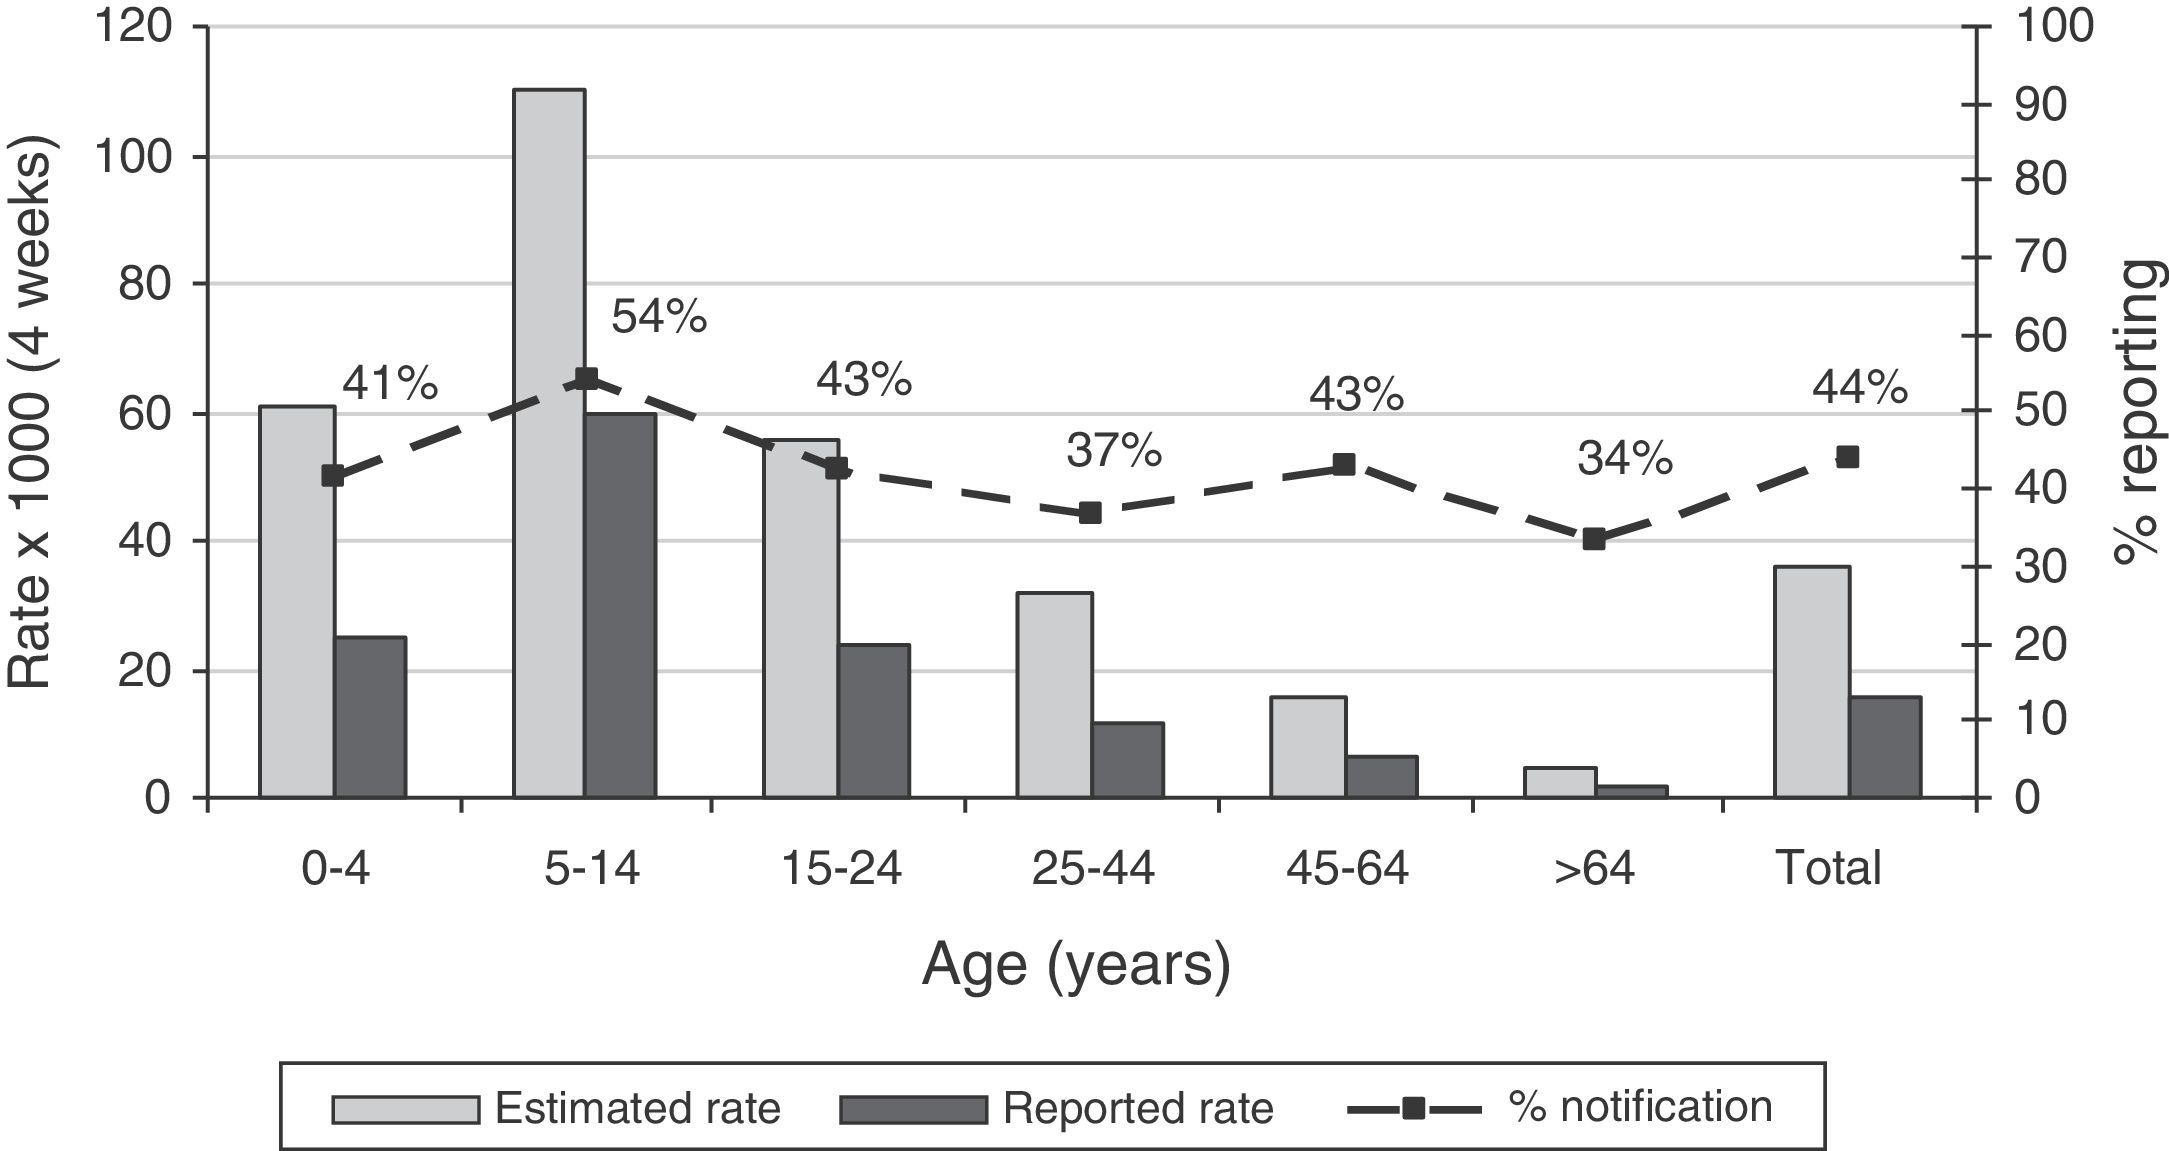
Accumulated incidence by age groups reported by both systems together (LAB and ND), estimated using capture–recapture methods. In the second axis, the percentage of reporting or sensitivity for both systems. ND: notifiable diseases: LAB: cases detected in the laboratory by request for analysis, whether positive or negative.
Estimated daily prevalence, assuming a disease duration of 7 days, was 9.7 per 1000 inhabitants on average; assuming a duration of 5 days, it was 6.7 per 1000.
ConclusionsThe capture–recapture method is a conventional procedure that has been shown to be useful in the estimation of total cases of a disease when more than 1 reporting system for that disease is available. This was the situation in Castellón during the influenza pandemic, and we took advantage of the opportunity to estimate the total number of influenza-like illnesses.
This study addresses an aspect of the influenza pandemic in Spain that has not received much attention. The incidence and daily prevalence of influenza-like illness in the month of greatest incidence during the pandemic season of 2009–2010 were estimated. Sensitivity of the ND system was 40%, so that multiplication by a factor of 2.5 gives an estimate of the total number of cases of influenza-like illness from the ND reporting system during the period of greatest incidence of the pandemic in Castellón.
Calculating the estimate from cases of influenza-like illness has 2 advantages. Firstly, this syndrome requires notification to the official ND epidemiological surveillance system, and the real estimate can be easily calculated from these figures. Secondly, this method is comparable to other international studies that use the detection of influenza-like illness in primary care.
There are few published studies estimating cases of influenza-like illness from primary care visits, laboratory data or other registry systems. In England, during the pre-pandemic seasonal influenza period, about 10% of patients with influenza-like illness were estimated to have sought medical opinion in primary care; this percentage rose to 30%–70% during the beginning of the 2009 influenza pandemic.7 This means a correction factor, or multiplier, of 2–5 is needed to calculate the real number of cases of influenza-like illness in the population from data on primary care consultations. The estimate we made in the month of maximum incidence fell within this range.
In a region of almost 1 million inhabitants in New Zealand, Jackson and Thornley15 used a log-linear capture–recapture model based on 4 data sources to estimate that 3.7% (1.2%–6.2%) of the population presented symptoms during the month of July (their winter). This magnitude coincides exactly with ours, although their sensitivity, at 10%, was rather lower.
The capture–recapture system has also used log-linear models to estimate the incidence of other diseases from 3 data sources.16–18 In a study unrelated with the pandemic, Grijalba et al.19,20 used the capture–recapture method to estimate confirmed and hospitalized cases of influenza in children younger than 5 years of age in several locations in the United States during the seasonal influenza periods 2003–200419 and 2005–2006.20 These authors, like us, used only 2 data systems. Thus, the method we adopted has also been used in other studies, and results have been seen to be consistent with estimates for pandemic influenza.
Advantages and limitations of the capture–recapture system have been discussed by several authors.8,9,14,21,22 The ideal conditions for applying this method are as follows: (a) a closed population, (b) individuals from different data systems can be correctly paired, (c) the probability of inclusion is similar among individuals, and (d) the systems are independent of one another. We can accept that the initial 2 conditions, a and b, are met. Heterogeneity, in turn, may be one of the causes of dependency. By analyzing stratified data, this problem could be evaluated in part with the independence coefficient,12 the result of which supports the homogeneity of our population. Accordingly, differences between estimates from raw and from stratified data are not significant.
Dependence between both systems cannot be totally ruled out. Positive dependence would lead to an underestimation of cases: a situation in which the presence of 1 case in either of the 2 systems would increase the probability of it being detected in the other. Negative dependence, on the other hand, would lead to overestimation: a situation in which the presence of 1 case in a system would reduce the probability of it being detected in the other. Since our results are consistent with those of the other studies discussed,7,15 it is reasonable to assume that the level of dependency is low. It seems most likely that when the suspicion or confirmation of the influenza diagnosis has been recorded in 1 of the 2 systems, the overall probability of its presence in the other would not change substantially.
Another limitation of the study is that the cases of influenza-like illness reported are not all necessarily cases of influenza. This is a common feature of disease surveillance studies. With regard to microbiological data, a third of the laboratory tests requested for patients with suspected influenza were negative for influenza virus. This may be due to false negatives from problems with laboratory techniques or other causative microorganisms; etiological data are lacking. Nevertheless, the estimate obtained when exclusively positive cases are examined is reasonably close to that obtained from all the tests performed, which was the method used in our study (Table 1). Moreover, in 2009, the seasonal wave of respiratory syncytial virus infection, that generally precedes the influenza season and almost exclusively affects children, occurred significantly later, so the cases did not overlap.21 It is a proven fact in influenza epidemiology that the epidemic curve of “influenza” (influenza-like illness) cases reported to the ND system runs parallel to laboratory-confirmed cases of influenza and cases reported by the sentinel network systems (both of which are very specific), and this was indeed the case in 2009.23 Thus, our observations need to be viewed in this context, and for this reason, they are useful from an epidemiological point of view.
These results have epidemiological implications in the analysis of influenza trends in the ND system over recent years. Given the alarm generated by the public declaration of a pandemic and the deluge of news reports leading up to it, it seems highly likely that the number patients with influenza-like illness seeking medical advice far exceeded that expected during a normal influenza season. For this reason, data registered from visits to primary care may be exposed to an increased detection bias in the pandemic season, compared to other seasons. Moreover, if the rates of the seasonal influenza period of 2004–2005 in Spain (maximum weekly peak greater than 500 per 105) are compared with those of the “pandemic” period (peak less than 400 per 105), it is striking that the incidence of seasonal influenza 10 years ago was notably higher than that detected during the 2009 pandemic,23 and even more so if corrector factors are applied to reporting figures.
In conclusion, we can state that during the month of greatest incidence of pandemic influenza in Spain, almost 4% of inhabitants (accumulated incidence) in our area presented influenza-like illness, and every day at least 1% of the population was affected (daily prevalence). A total of 40% of those affected presented to primary care facilities. To obtain an estimate of the real incidence of influenza-like illness, then, the number of cases reported to the ND system would have to be multiplied by a factor of 2.5. This factor is lower than that estimated for periods without pandemic alert.
This study was made possible by the existence of 2 epidemiological surveillance systems in our area. It would be interesting to corroborate these results in a larger, more far-reaching national study, using at least 3 sources of data, thus contributing to a better final assessment of the impact of the influenza pandemic in Spain.
FundingCIBER, Epidemiology and Public Health CIBERES, project GR09/0029.
Conflict of InterestThe authors declare that they have no conflict of interests.
Please cite this article as: Bellido-Blasco JB, Pardo-Serrano F, Ballester-Rodríguez I, Arnedo-Pena A, Tirado-Balaguer MD, Romeu-García MÁ, et al. Estimación de la incidencia de síndrome gripal durante la pandemia de gripe de 2009. Arch Bronconeumol. 2015;51:373–378.