

In the new GOLD classification the reduction of FEV1, expressed as percentage of predicted value (FEV1PP), is considered an important prognostic factor. However, the use of FEV1PP may introduce bias, especially if based on equations derived from populations different from the one under study. We evaluated how well the GOLD classification stratifies the mortality risk when FEV1PP is based on an equation developed in the same population that gave rise to cases, externally developed equations, or as FEV1 divided by cubed height (FEV1/Ht3).
MethodsWe studied 882 participants aged ≥65 years. Bronchial obstruction was defined using a fixed cut-off of 0.7 for FEV1/FVC. Predicted values of FEV1 were derived from equations based on the same sample of the cases included in this study and from the European Respiratory Society equations. Severity of bronchial obstruction was also classified according to quartiles of FEV1/Ht3.
ResultsAll the classification systems showed a non-statistically significant linear tendency with 5-years mortality risk. For the 15-years mortality, the linear trend across severity stages is more evident for GOLD classifications, with significant increments in the hazard ratio. Stratification by FEV1/Ht3 could better discriminate the functional status of participants.
ConclusionThe severity of bronchial obstruction according to GOLD classes may stratify mortality risk better than quartiles of FEV1/Ht3, whereas the second seems to be more suited to stratify the risk of clinical outcomes. Concerns about the use of externally developed reference values to calculate FEV1PP do not seem confirmed, at least for GOLD classification.
En la nueva clasificación GOLD, la reducción del FEV1 expresada como porcentaje del valor predicho (FEV1PP) se considera un factor pronóstico importante. Sin embargo, usar el FEV1PP puede introducir sesgos, especialmente si se basa en ecuaciones derivadas de poblaciones diferentes de la que se estudia. Se ha evaluado cómo de adecuadamente estratifica GOLD el riesgo de mortalidad cuando el FEV1PP se basa en una ecuación desarrollada con la misma población en la que se dieron los casos, usando ecuaciones desarrolladas externamente, o con el FEV1 dividido por la altura al cubo (FEV1/A3).
MétodosEstudiamos a 882 participantes de edad ≥65 años. La obstrucción bronquial se definió utilizando un punto de corte fijo de 0,7 para FEV1/FVC. Los valores pronosticados de FEV1 se derivaron de ecuaciones basadas en la misma muestra de los casos incluidos en este estudio y de las ecuaciones de la European Respiratory Society. La gravedad de la obstrucción bronquial también se clasificó de acuerdo con los cuartiles de FEV1/A3.
ResultadosTodos los sistemas de clasificación mostraron una tendencia lineal estadísticamente no significativa en el riesgo de mortalidad a 5 años. Para la mortalidad a 15 años, la tendencia lineal a través de los diferentes estadios de gravedad es más evidente para los estadios GOLD, con incrementos significativos en la razón de riesgo. La estratificación por FEV1/A3 podría discriminar mejor el estado funcional de los participantes.
ConclusiónLa gravedad de la obstrucción bronquial según la estadificación GOLD puede estratificar mejor el riesgo de mortalidad que los cuartiles de FEV1/A3. Sin embargo, lo segundo parece el método más adecuado para estratificar el riesgo de resultados clínicos. Las reticencias respecto al uso de valores de referencia desarrollados externamente para calcular FEV1PP no parecen confirmarse, al menos para la clasificación GOLD.
For several years, the grading of chronic obstructive pulmonary disease (COPD) severity proposed by the Global Initiative for Obstructive Lung Disease (GOLD) has been based on Forced Expiratory Volume in 1 second (FEV1) only. This classification could not adequately predict clinical outcomes1,2 and therefore other prognostic indices, such as the BODE index3 have been proposed to stratify the severity of COPD. In 2011, the GOLD proposed a new classification of COPD severity that in addition to the level of FEV1 reduction also took into account severity of symptoms and frequency of exacerbations,4 thus generating a panel of four different stages of disease severity (A through D). This new classification, however, does not seem to have better prognostic capacity,5 and the GOLD group has recently proposed a new classification that merges the GOLD 2007 and GOLD 2011 classes.6 In this document, the severity of obstruction expressed as reduction of FEV1 is still considered a very important prognostic factor at the population level.
One potential issue with the GOLD classification is that FEV1 is expressed as the percent of the value predicted by estimating equations (FEV1PP). This approach may introduce bias, and it has been shown that GOLD classification can lead to misclassification of older patients.7,8
Due to these limitation, alternative ways of standardizing FEV1 have been proposed, such as FEV1 standardized residuals, FEV1 divided by height squared or cubed (FEV1/Ht3) or expressed as a function of the sex-specific first percentile.9 FEV1/Ht3 may be more informative than FEV1PP to predict clinical outcomes even in elderly patients.9–11 Our hypothesis is that part of the suboptimal prognostic capacity of the GOLD stratification comes from the use of equations developed in population that are different from the one that gives raise to the COPD cases. In this study, we evaluated how well the GOLD classification stratifies the mortality risk when FEV1 is expressed as percentage of the value predicted by an equation developed in the same population that gave rise to cases, externally developed equations, or as FEV1/Ht3.
MethodsStudy populationBetween January 1996 and July 1999 a total of 1970 participants were recruited within the context of the SaRA (Salute Respiratoria nell’Anziano – Respiratory Health in the Elderly) study. Details on the SaRA project are available elsewhere.12 This is a multi-center Italian project investigating various aspects of chronic airway diseases in people ≥65 years of age attending pulmonary or geriatric outpatient clinics for any reason. Participants were in stable conditions when the spirometry was performed. Enrollment was on a consecutive basis. The study design was approved by the Ethical Committee of the coordinating center (#276/2012). From this dataset, we selected 1296 participants with post-bronchodilator (postBD) spirometry. We then excluded people with a history of asthma (N=224). Of the remaining participants, information on vital status as of December 2010 was available for 882; these patients had clinical and spirometric characteristics comparable to those of subjects lost to follow-up. Causes of death were derived from death certificates, and were available for 74% of participants.
Pulmonary function testsAll the centers were equipped with an identical fully computerized water-sealed Stead-Wells spirometer (Baires System; Biomedin; Padua, Italy) that met the standards of the American Thoracic Society recommendations for diagnostic spirometry.13 At baseline, tests were performed with a standardized technique in all centers and a quality control process was successfully implemented: all the centers achieved a high quality performance in spirometry.12 Obstruction was defined using a fixed cut-off of 0.7 for FEV1/forced vital capacity (FVC) considering the postBD spirometry. Predicted values of FEV1 were derived from equations based on the same sample of the cases included in this study (FEV1-SARA)14 and the European Respiratory Society (FEV1-ERS).15 FEV1PP was categorized according to the classes proposed by the GOLD guidelines to stratify severity of obstruction (FEV1PP≥80%, 80%<FEV1PP≥50%, 50%<FEV1PP≥30%, and FEV1PP<30%). Severity of bronchial obstruction was also classified according to quartiles of FEV1/Ht3.
Analytic approachThe demographic and clinical characteristics were compared across COPD severity groups defined using FEV1-SARA. We included in this analysis the distance walked in 6min, expressed as percent predicted,16 and comorbid diseases such as ischemic heart disease, heart failure, and stroke. Smoking was analyzed as cumulative exposure (pack-years). The multi-dimensional BODE index was also included, as it is able to predict mortality in older people.17 The SaRA questionnaire did not include a specific item on exacerbations, therefore we combined two of the Saint George Respiratory Questionnaire (SGRQ) items (“During the past 3 months how many severe or very unpleasant attacks of chest trouble have you had?” and “How long did the worst attack of chest trouble last?”) to define exacerbations as an attack that lasted for at least 3 days. The risk of dying was estimated using the Kaplan–Meier method, differences in the survival risk was evaluated using the log-rank test. The relative hazard of dying was estimated using a Cox proportional hazard model. The assumptions of such a model were checked by inspecting the distribution of the Schoenfeld residuals over time.
To estimate the discriminative capacity of each risk stratification tool, we estimated the relative increase in risk of each stratum compared to the preceding stratum, i.e. GOLD I vs. not obstructed, GOLD II vs. GOLD I and so on. The goodness of fit of these models was evaluated using the likelihood ratio test, and the overall diagnostic performance of these models was evaluated using the C-statistic. The analyses were performed for both medium-term (5 years) and very long-term (15 years) mortality.
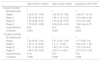
ResultsThe mean age of our sample was 73.2 (SD: 6), men were 57.8%. Characteristics of the population according to GOLD stages determined using the FEV1-SARA are reported in Table 1. Participants with bronchial obstruction were predominantly males, especially in classes III and IV. Beside having a higher BODE index, participants in these classes tended to have lower body mass index, higher exposure to cigarette smoking, and higher prevalence of cerebro-vascular disease. We did not observe a linear relationship between GOLD stages and prevalence of comorbidities; for example the prevalence of ischemic heart disease, heart failure, and stroke was higher in GOLD class III than in GOLD class IV.
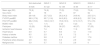
Characteristics of the sample according to GOLD classification (predicted value obtained with SARA equation14).
| Not obstructed | GOLD 1 | GOLD 2 | GOLD 3 | GOLD 4 | |
|---|---|---|---|---|---|
| N: 535 | N: 122 | N: 139 | N: 69 | N: 17 | |
| Mean age (SD) | 73 (6) | 74 (6) | 73 (5) | 73 (6) | 72 (6) |
| Sex (men) | 44 | 78 | 75 | 87 | 94 |
| Body mass index | 26.4 (4) | 25.7 (3.3) | 26.2 (4.3) | 24.9 (4) | 23.5 (3.1) |
| FVCPP postBD | 98.9 (17.8) | 95.7 (11.6) | 64.5 (8.5) | 40.8 (6.2) | 25.7 (3.4) |
| FEV1PP postBD | 88.2 (15.6) | 100.6 (12.7) | 79.6 (13.5) | 67.3 (13.7) | 57.4 (15) |
| BODE index | 1 (1) | 1 (1) | 2 (2) | 5 (2) | 7 (2) |
| Pack/year | 12 (22) | 35 (34) | 38 (37) | 48 (37) | 37 (33) |
| Ischemic heart disease | 5.4 | 7.4 | 9.4 | 11.6 | 5.9 |
| Heart failure | 3.9 | 5.7 | 8.6 | 13 | 11.8 |
| History of stroke | 6.5 | 2.5 | 2.9 | 7.2 | 0 |
| Diabetes mellitus | 12.1 | 9.8 | 11.5 | 8.7 | 17.6 |
| Peripheral artery disease | 4.9 | 9.8 | 6.5 | 2.9 | 5.9 |
| Malignancies | 3.9 | 5.7 | 7.2 | 2.9 | 0 |
FEV1PP postBD: forced expiratory volume in 1 second of post-bronchodilator spirometry; FVCPP postBD: forced vital capacity of post-bronchodilator spirometry; SD: standard deviation.
The FEV1 predicted by the ERS equation was on average 150ml smaller compared to the SARA equation. Consequently, 21 patients classified in class I, 8 patients classified in class II, and 3 patients classified in class III using the ERS equation were classified in class II, III, and IV, respectively, according to the SARA equation. This notwithstanding, the general pattern across GOLD classes based on FEV1-ERS was not different from that observed using FEV1-SARA. Likewise, no clear specific relationships in clinical characteristics were found after stratification by quartiles of FEV1/Ht3 (Table 2).
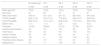
Characteristics of the sample according to quartiles of FEV1 divided by squared height.
| Not obstructed | Qtl. I | Qtl. II | Qtl. III | Qtl. IV | |
|---|---|---|---|---|---|
| N: 535 | N: 89 | N: 89 | N: 83 | N: 86 | |
| Mean age (SD) | 73 (6) | 73 (6) | 74 (5) | 73 (6) | 74 (6) |
| Sex (men) | 44 | 90 | 75 | 70 | 81 |
| Body mass index | 26.4 (4) | 26.1 (2.9) | 25.7 (4) | 26.4 (4.6) | 24.5 (3.8) |
| FVCPP postBD | 98.9 (17.8) | 97.6 (11.6) | 77.6 (9.6) | 59.9 (12.1) | 38.6 (9.5) |
| FEV1PP postBD | 88.2 (15.6) | 101.1 (12.1) | 88.5 (12.9) | 77.2 (16.1) | 65.8 (15.2) |
| BODE index | 1 (1) | 1 (1) | 2 (2) | 3 (2) | 5 (2) |
| Pack/year | 12 (22) | 39 (32) | 37 (37) | 37 (39) | 43 (37) |
| Ischemic heart disease | 5.4 | 4.5 | 15.7 | 4.8 | 10.5 |
| Heart failure | 3.9 | 2.2 | 10.1 | 10.8 | 11.6 |
| History of stroke | 6.5 | 3.4 | 3.4 | 2.4 | 4.7 |
| Diabetes mellitus | 12.1 | 9 | 13.5 | 10.8 | 9.3 |
| Peripheral artery disease | 4.9 | 10.1 | 10.1 | 3.6 | 3.5 |
| Malignancies | 3.9 | 1.1 | 14.6 | 3.6 | 2.3 |
FEV1PP postBD: forced expiratory volume in 1 second of post-bronchodilator spirometry; FVCPP postBD: forced vital capacity of post-bronchodilator spirometry; SD: standard deviation.
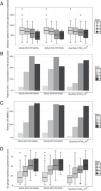
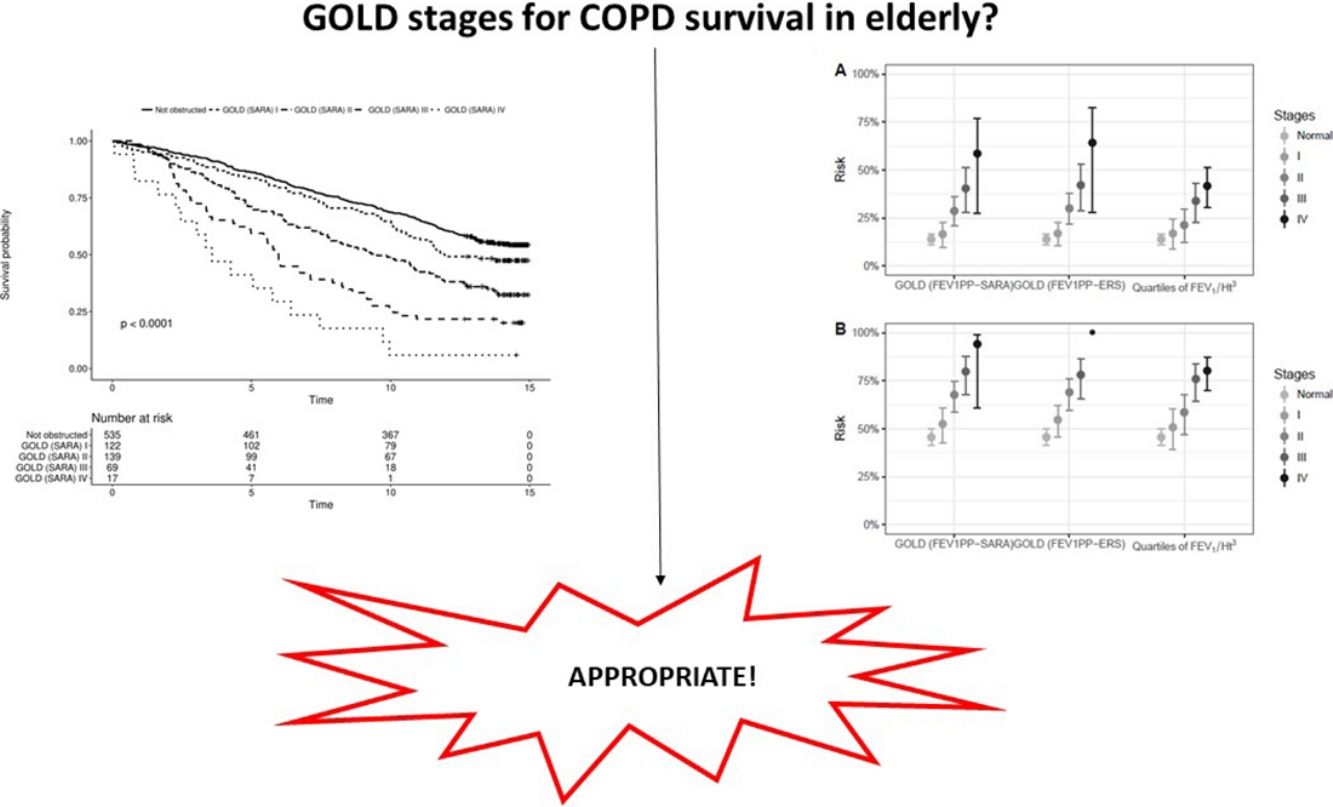
In participants with COPD, the average distance walked in 6′ was 67.6m. In the same group, 15% reported at least one exacerbation in the preceding 3 months, and 24.5% had a modified Medical Research Council dyspnea index>2. The global SGRQ score was 39. We found no differences in the capacity of the different severity grading methods to stratify exercise capacity expressed by the distance walked in 6′ (Fig. 1, panel A). We found that the other important clinical outcomes (exacerbations, dyspnea, and quality of life) differed only across the first three GOLD classes, while participants in class IV did not differ from patients in class III. Using quartiles of FEV1/Ht3, instead, the linear association was evident across all categories (Fig. 1, panels B–D).
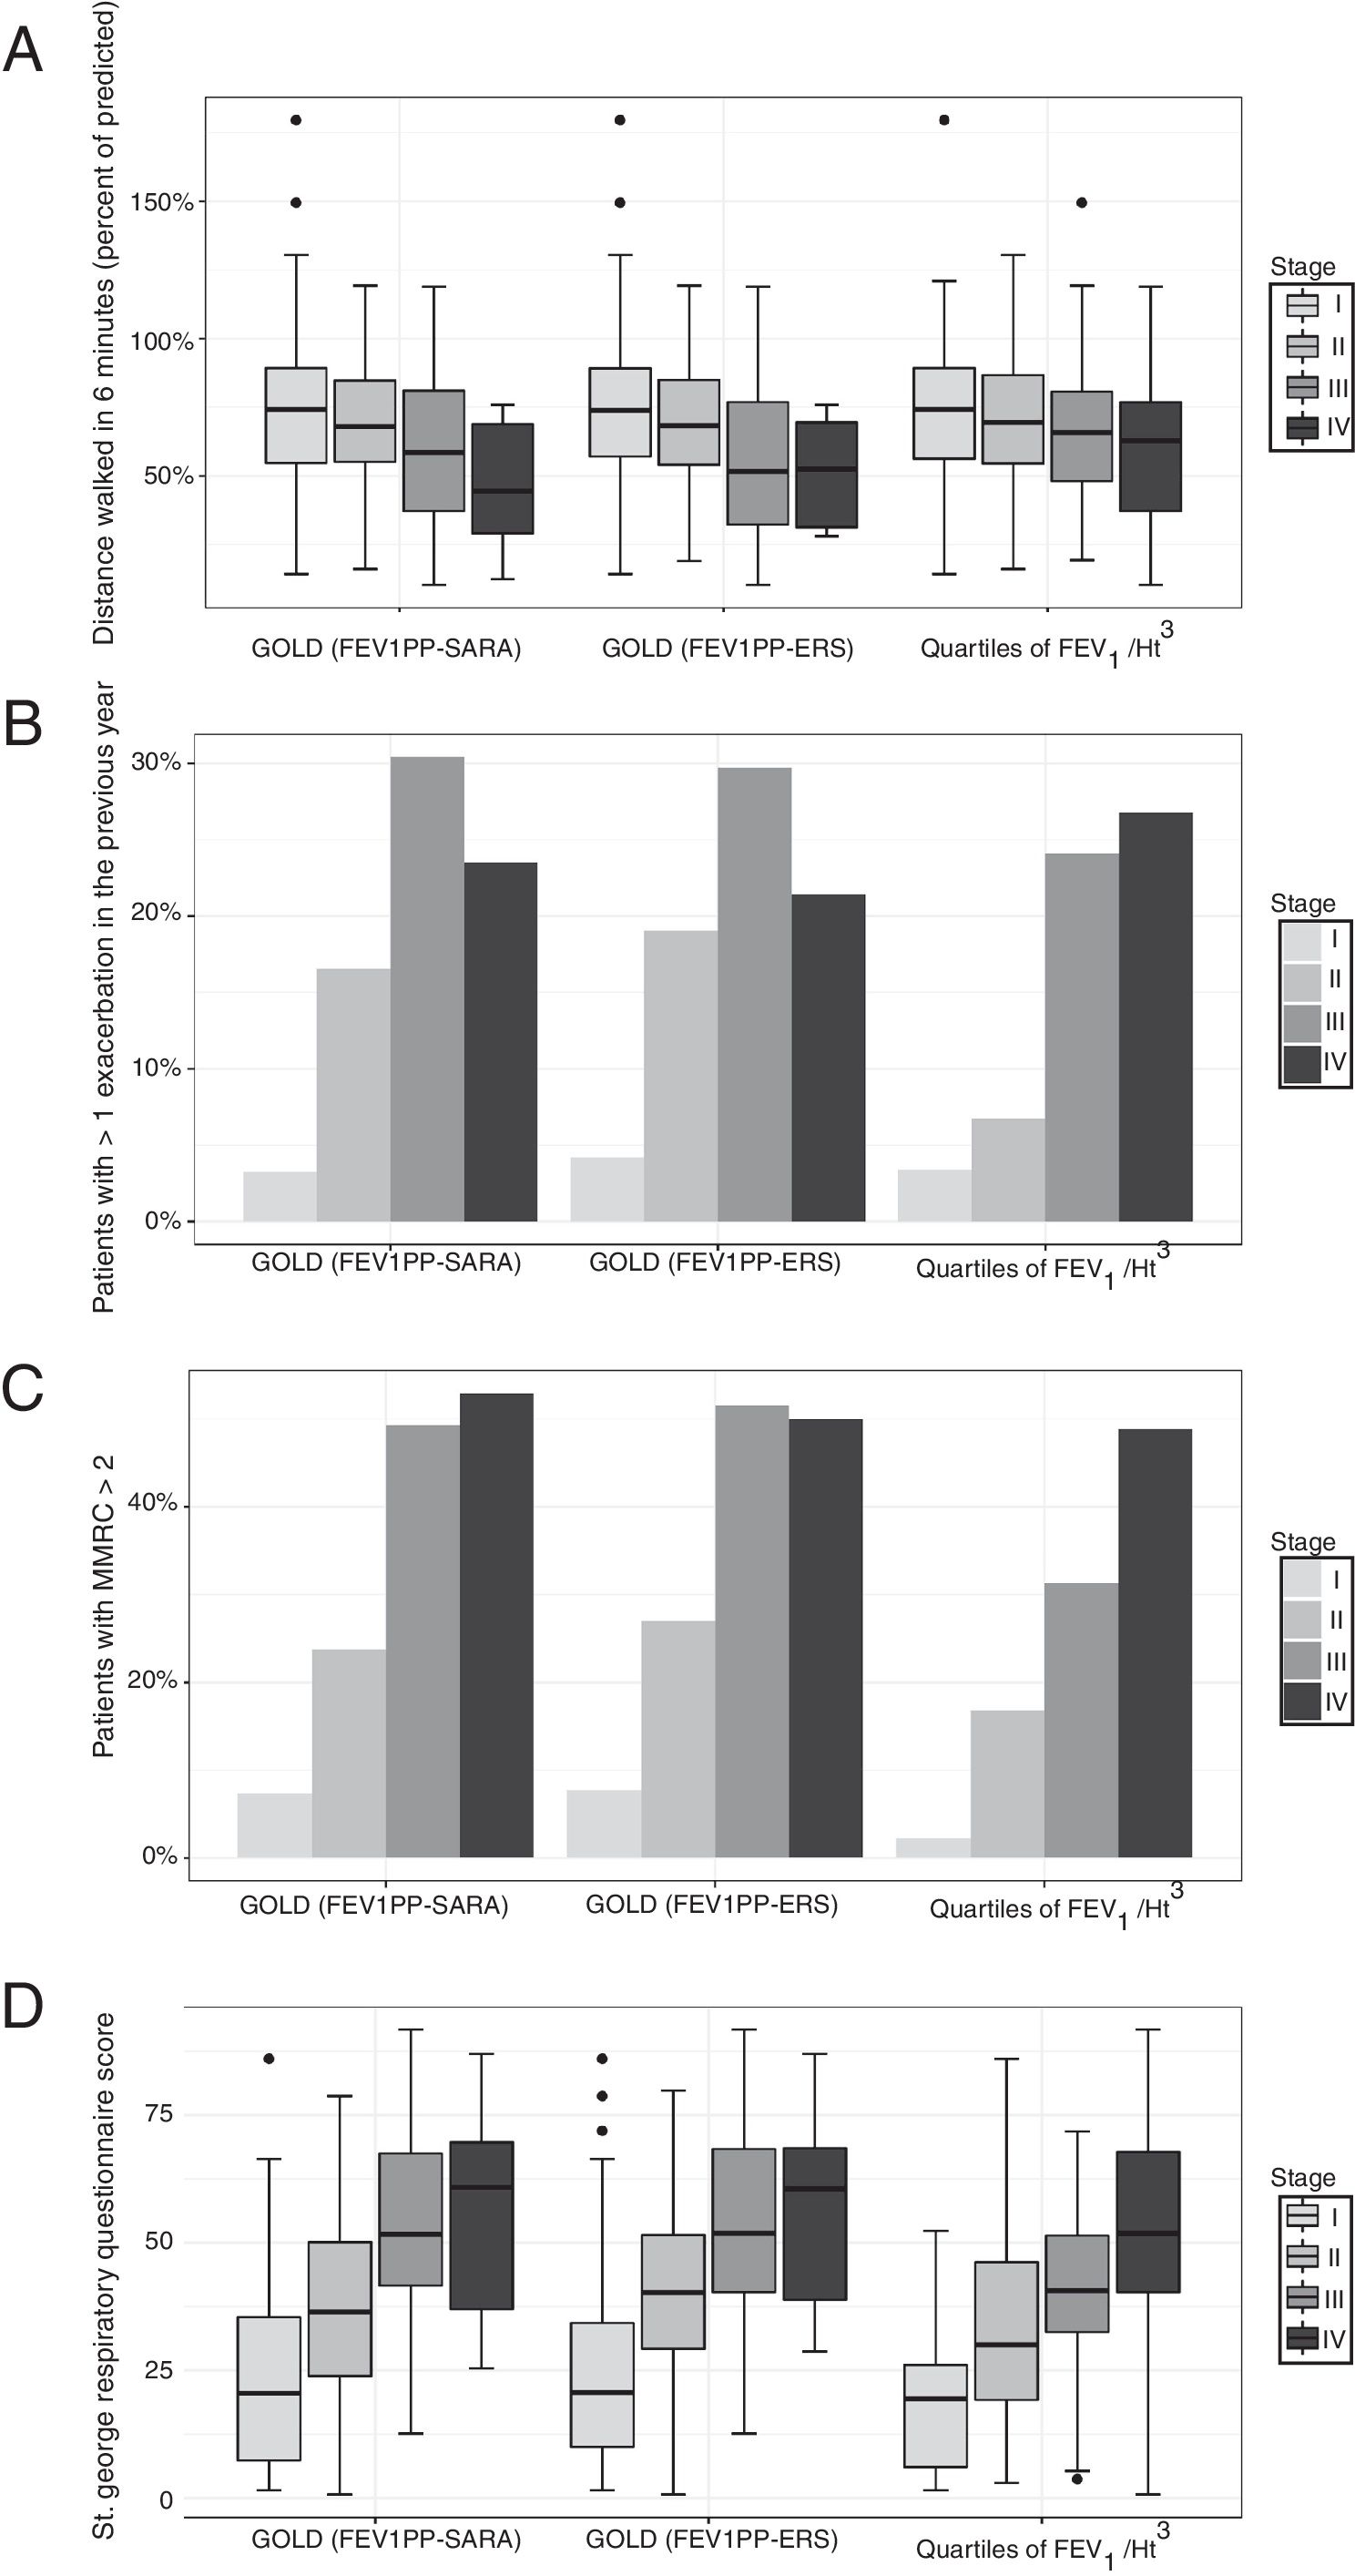
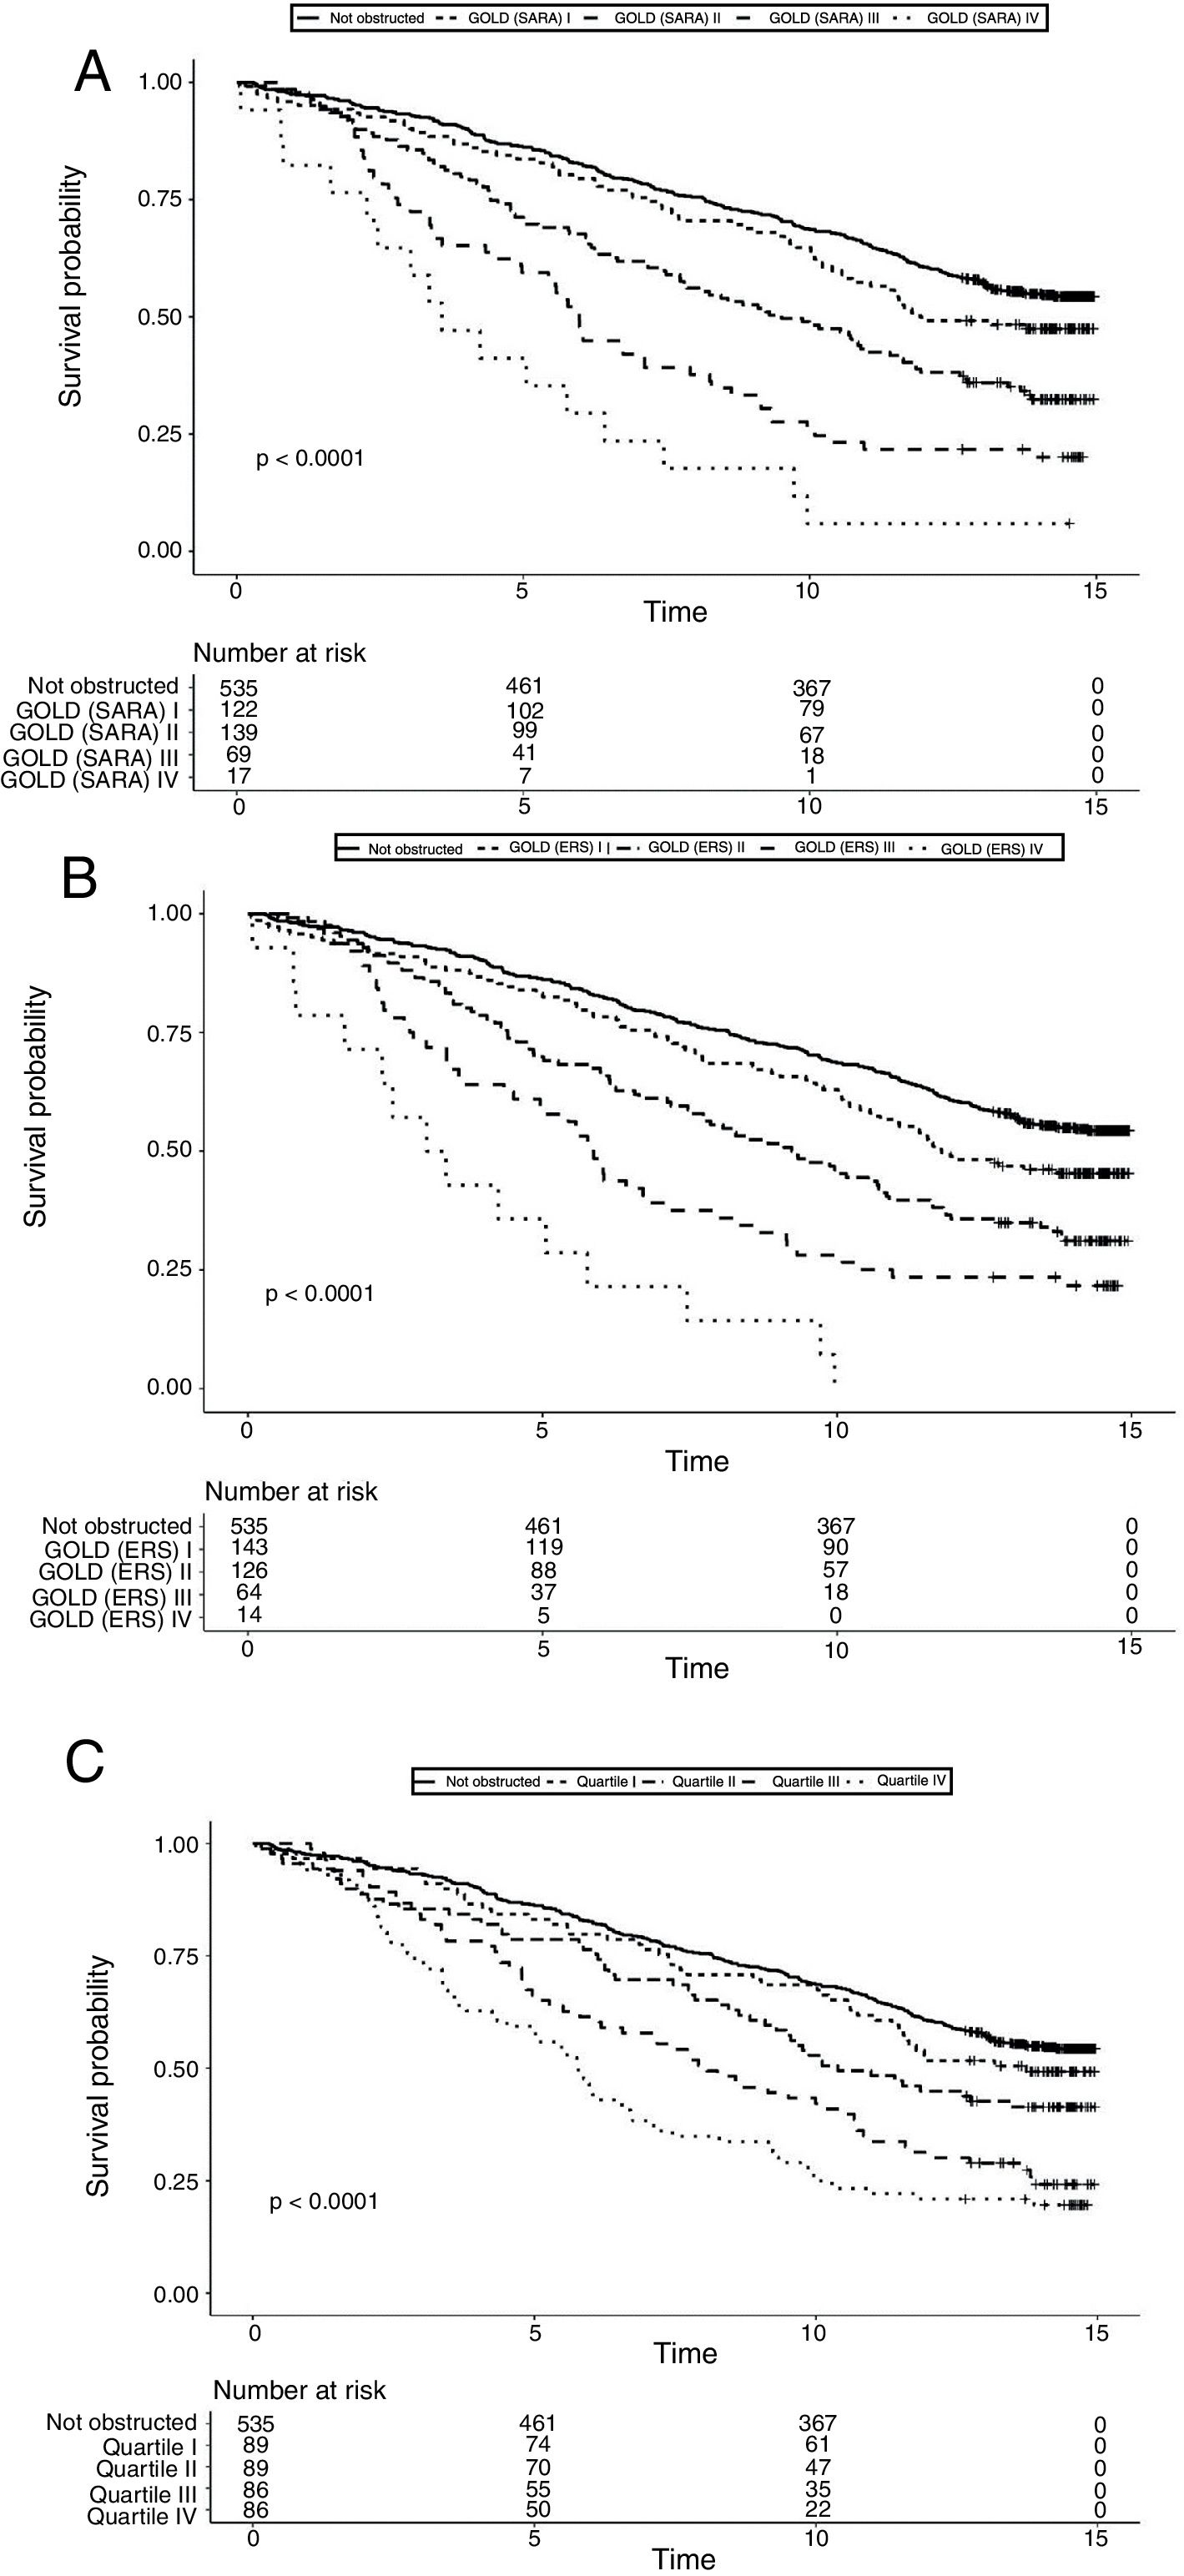
Data on vital status were gathered after a median of 13 years (range: 0.5–15). The risk for mortality was 19.5% at 5 years and 53,7% at the end of follow-up. Fig. 2 shows the Kaplan–Meier curves for 15-year mortality risk stratified by stages. Considering the 5-years mortality, all the classification systems showed a fairly linear relationship with mortality. Nonetheless, as reported in Table 3, the incremental changes in risk associated with each class were not statistically significant, except for the increase in risk from stage II to stage III of both GOLD classifications. The goodness of fit of the quartiles of FEV1/Ht3 was somewhat worse compared to the GOLD classifications, but the overall discriminative capacity expressed by the c statistics was 0.6 for all models. When the models were adjusted for age and sex, the incremental association between the GOLD stages defined using the SARA predicting equation was only marginally affected, while for GOLD stages defined using the ERS predicting equation the linear association was more evident, with significant increases of hazard ratio in group II vs. I, group III vs. II and group IV vs. III. No significant incremental risk was observed for quartiles of FEV1/Ht3.
Hazard ratio for mortality according to GOLD stages and quartiles of FEV1 divided by squared height. Each category is contrasted with the preceding category (e.g. GOLD I vs. not obstructed, GOLD II vs. GOLD I, etc.).
| GOLD (FEV1-SARA) | GOLD (FEV1-ERS) | Quartiles of FEV1/Ht3 | |
|---|---|---|---|
| 5-years mortality | |||
| Not obstructed | 1 | 1 | 1 |
| Stage I | 1.22 (0.74–1.99) | 1.25 (0.79–1.98) | 1.24 (0.71–2.16) |
| Stage II | 1.84 (1.08–3.15) | 1.88 (1.13–3.13) | 1.33 (0.68–2.63) |
| Stage III | 1.56 (0.96–2.53) | 1.56 (0.95–2.56) | 1.61 (0.9–2.88) |
| Stage IV | 1.79 (0.87–3.69) | 2.04 (0.96–4.34) | 1.38 (0.84–2.27) |
| Log-likelihood | 49.2 | 52.2 | 44.2 |
| C-statistic | 0.625 | 0.626 | 0.623 |
| 15-years mortality | |||
| Not obstructed | 1 | 1 | 1 |
| Stage I | 1.24 (0.94–1.63) | 1.31 (1.02–1.69) | 1.17 (0.85–1.6) |
| Stage II | 1.52 (1.11–2.09) | 1.5 (1.1–2.03) | 1.29 (0.87–1.93) |
| Stage III | 1.61 (1.16–2.25) | 1.52 (1.07–2.16) | 1.52 (1.05–2.2) |
| Stage IV | 1.89 (1.08–3.29) | 2.53 (1.4–4.59) | 1.37 (0.97–1.93) |
| Log-likelihood | 81.8 | 82.5 | 76.5 |
| C-statistic | 0.598 | 0.598 | 0.598 |
FEV1/Ht3: forced expiratory volume in 1 second divided by height cubed.
Considering the 15-years mortality risk (Fig. 2), the linear association across severity stages is more evident for the two GOLD classifications, as also confirmed by the significant increments in the hazard ratio, shown in Table 3. Although the linear association was evident also for quartiles of FEV1/Ht3, the increment in the hazard ratio was significant only for stage III compared to stage II. The goodness of fitness of the models obtained with the GOLD classification system was marginally better compared to that of the model including quartiles of FEV1/Ht3, but the overall discriminative capacity did not change between the three classification systems. After correction for age and sex, no substantial changes were observed.
Finally, when only deaths from respiratory causes were taken into account, the overall pattern did not change, although the estimates were more unstable due to the relatively low number of events (46 overall, 28 in the first 5 years).
DiscussionOur data indicate that the GOLD classification system is superior to a stratification based on quartiles of FEV1 standardized by height in predicting mortality in older persons with COPD. This finding is partly in contrast with other reports9–11 showing that FEV1/Ht3 is superior to FEV1PP in stratifying the mortality risk. One possible explanation for this discrepancy is that previous studies on this issue have compared groups of FEV1PP and FEV1/Ht3 based on percentiles, and not GOLD classes vs. percentiles of FEV1/Ht3. One exception is a study by Miller et al.18 that compared GOLD classes vs. arbitrarily defined groups of FEV1 divided by height squared (FEV1/Ht2), in which the authors found that FEV1/Ht2 could better stratify mean survival compared to GOLD classes. In this study, however, the cut-off to define bronchial obstruction was set at FEV1/FVC<0.89, and the authors did not provide information on the mortality risk across groups.
A possible explanation of our findings is that the GOLD classification uses pragmatic cut-off of FEV1PP based on consensus, clinical experience, and previous epidemiological data,19 and in this study we compared it with a distribution-based classification. The use of arbitrary cut-off (as in the GOLD classification) may better fit the risk of mortality compared to distribution-based cut-off (i.e. quartiles) if the relationship between FEV1 and risk was not linear, while the opposite would be true if the relationship was linear. An alternative explanation is that FEV1PP, on which the GOLD classification is based, better captures the underlying pathophysiologic changes compared to FEV1/Ht3. Several studies, however, starting from the seminal observation by Fletcher and Peto,20 indicate that FEV1 standardized using height is a good indicator of reduction of pulmonary function with respect to the mortality risk. Further studies investigating different cut-off for FEV1/Ht3 are needed to better explore this issue.
To our knowledge, this is the first study comparing the discriminative capacity of GOLD classification and quartiles of FEV1/Ht3 with respect to walking speed, dyspnea, rate of exacerbations, and disease-specific quality of life in COPD. In contrast to what we observed for mortality, quartiles of FEV1/Ht3 could better stratify more specific clinical indicators (dyspnea, exacerbations, disease-specific quality of life) compared to the GOLD classification, while no grading system could stratify an overall indicator of exercise capacity such as the distance walked in 6′. The same observation made above about mortality risk may apply for these findings: the distribution-based classification may have a better fit because the relationship is linear. Furthermore, these outcomes were evaluated at the same time of the spirometry, therefore the discriminative capacity of the classification systems are relevant to the actual clinical conditions, not to a future outcome such as mortality. Based on these data, the GOLD classification seems better suited to identify people at generic risk for mortality, but not patients with worse health status related to pulmonary problems. In keeping with this hypothesis, the discriminative capacity of GOLD stages is better for very long-term compared to medium-term survival, and there was no difference in the discriminative capacity for mortality from any cause or mortality from pulmonary causes.
Results obtained using predicting equations developed in the same population that gave rise to the cases differed marginally from those obtained using equation developed in a different population. Thus, although guidelines recommend the use of internally developed standards,21 the use of externally developed standards seem to be acceptable. Indeed, we found a relatively small discrepancy between GOLD classes assigned by FEV1-SARA or FEV1-ERS.
Limitations of this study deserve consideration. An important limitation is that we do not have follow-up data on pulmonary and physical function and symptoms, therefore we cannot evaluate which classification system better identifies people with worse prognosis in terms of clinical course of disease. At the same time we cannot discriminate if some subjects has changed GOLD class during the follow-up. We used measured height, and this could introduce a bias as vertebral fractures are frequent in the older population (especially women) and COPD.22 Due to this problem, people with vertebral fractures might have been misclassified as having a FEV1/ht3 higher than the real. Since vertebral fractures are a risk factor for adverse outcomes in COPD,23 this bias may have caused a reduction in the discriminative capacity of FEV1/ht3. Furthermore, even if a classification basing on quartiles of FEV1/Ht3 is statistically logical considering the absence of indications from epidemiological studies, it may occur than this would not be the best method.
The observed frequency of exacerbation refers to the last 3 months period and, thus, cannot be compared to that reported in other studies. for example by Hurst et al.24 Indeed, we based our definition on two SGRQ items that have a time frame of only 3 months; therefore our data are not directly comparable to those reporting yearly exacerbation rates. Finally, the loss of many patients to follow-up may have biased our results on mortality. However, patients followed up and patients lost to follow up had comparable clinical characteristics.
ConclusionIn conclusion, our study indicates that the severity of bronchial obstruction according to GOLD classes may stratify mortality risk better than quartiles of FEV1/Ht3, whereas the second seems to be more suited to stratify clinical outcomes, such as dyspnea, walking speed and quality of life. Concerns about the appropriateness of using externally developed reference values to calculate FEV1PP do not seem to be confirmed, at least for GOLD classification.
Authors’ contributionEach have substantially contributed to data collection, manuscript drafting and revision. All authors read the final manuscript and approved it for publication.
Conflict of interestThe authors declare they have no conflict of interest.


