


To analyze changes in the incidence, diagnostic procedures, comorbidity, length of hospital stay, and costs of patients hospitalized for lung cancer in Spain between 2001 and 2011.
Patients and methodsRetrospective study including all patients hospitalized with a primary diagnosis of lung cancer between 2001 and 2011. Data were collected from the National Hospital Discharge Database, encompassing the entire Spanish population. Economic and sociodemographic characteristics and health-related variables were analyzed.
ResultsA total of 298435 hospitalizations occurred. The overall crude incidence increased from 61.18 per 100000 inhabitants in 2001 to 65.08 per 100000 in 2011 (P<.05), with a decrease in men and a proportionate increase in women. The age group with the highest incidence was 70–79 years. In 2001, 4.5% of patients had a Charlson comorbidity index (CCI) >2, and in 2011, prevalence of CCI>2 increased to 9.1% (P<.05). Mean length of hospital stay decreased during the study period. Computed tomography was the most common procedure. Mean cost per patient increased from €4471.22 in 2001 to €5562.54 (P<.05) in 2011. Factors related to the incidence of hospitalizations were age, sex and year of study in the multivariate analysis.
ConclusionsWe found a decrease in the rate of hospitalizations in men and an increase in women, with a concomitant increase in comorbidities and cost; however, length of hospital stay decreased. Factors related to incidence of hospitalizations were age, sex, and year of study.
Analizar los cambios en incidencia, características clínicas, procedimientos diagnósticos, comorbilidad, estancia hospitalaria y coste en los pacientes hospitalizados por cáncer de pulmón (CP) en España entre 2001 y 2011.
Pacientes y métodosEstudio retrospectivo mediante la utilización del registro nacional de hospitalizaciones conjunto mínimo básico de datos (CMBD). Se reclutaron todos los pacientes hospitalizados por CP en España durante el periodo de estudio. Se analizaron variables sociodemográficas, económicas y relacionadas con la salud.
ResultadosSe detectaron 298.435 hospitalizaciones, cuya tasa global aumentó desde 61.18 hasta 65.08 por 100.000 habitantes desde 2001 a 2011 (p<0.05), evidenciándose una disminución progresiva en hombres y un aumento en mujeres. El intervalo de edad con mayor incidencia fue el registrado entre los 70 a 79años. El porcentaje de pacientes con un índice de comorbilidad de Charlson>2 se incrementó desde el 4.5 al 9,1% (p<0,05). El procedimiento diagnóstico más realizado fue la tomografía computarizada (TC) torácica. La estancia media disminuyó a lo largo del periodo de estudio, pero el coste por hospitalización aumentó desde 4.471,22€ en 2001 hasta 5.562,54€ en 2011 (p<0,05). Los factores asociados con la incidencia de ingresos hospitalarios en el análisis multivariado fueron: edad, sexo y año de estudio.
ConclusionesObservamos una disminución en la tasa de ingresos en hombres y un aumento en mujeres, con incremento concomitante de comorbilidad y coste y disminución de la estancia hospitalaria media. Los factores asociados con la incidencia de ingresos por CP son la edad, el sexo y el año del estudio.
Cancer is the primary cause of morbidity and mortality throughout the world. The World Health Organization (WHO) estimates that the overall burden of cancer is increasing, and predicts that in 20 years1 it will account for over 50% of all morbidity and mortality. Lung cancer (LC) is the third most common cancer in the world, the most common if both sexes are taken together, and the malignancy with the highest mortality, with 1824701 new cases being diagnosed every year worldwide, leading to 1589925 deaths every year.2
In Spain, it is estimated that 27859 new cases were diagnosed in 2014, 22455 in men and 5404 in women. In men, it was the third most common cancer after prostate and colorectal cancers, and in women, the fourth after breast, colorectal and uterine cancers. Age-adjusted incidence rates standardized to the European population were 75.8 per 100000 and 16.6 per 100000 for men and women, respectively.3
Diagnosis has improved spectacularly in the last 30 years with the use of methods such as computed tomography (CT) and positron emission tomography (PET)-CT,4,5 but diagnosis is often made when the disease is in advanced stages, and 5-year survival rates remain low. LC has traditionally been a man's disease, but disease rates among women have risen sharply since they started smoking, an increase that has been attributed, among other things, to hormonal factors and an increased sensitivity to tobacco smoke.6–8
According to the literature, mean age at diagnosis is between 65 and 75 years.2,6,7,9–11 However, technological advances have extended the survival of LC patients, causing a direct increase in the associated comorbidity burden.6,11
Several studies have indicated that 50%–80% of the healthcare costs of these patients is associated with hospital admissions, while only 20% goes on diagnostic procedures, medical interventions, and palliative care.12 However, very few studies indicate the specific costs of hospitalizations for LC, or the procedures most frequently performed in these patients.
The aim of this study was to analyze changes in the incidence, clinical characteristics, diagnostic procedures, comorbidities, length of stay, and costs in patients hospitalized for LC in Spain between 2001 and 2011.
Patients and MethodsWe performed a retrospective study using the National Epidemiological Surveillance System for hospital data (minimum basic data set [MBDS]) managed by the Ministry for Health, Social Affairs and Equality. This system uses the clinical codes of the Spanish version of the 9th International Classification of Diseases (Clinical Modification International Classification of Diseases [ICD-9-CM])13 for data management and coding. The following data are collected annually: patient details (age, sex, and autonomous community of residence), episode (date of admission, type of admission, type of hospital, hospital group, date of discharge, type of discharge, readmission, and cost), and various clinical variables (primary diagnosis, 14 secondary diagnoses, and procedures performed).
All patients hospitalized in Spain between 2001 and 2011 with a primary diagnosis of LC were recruited (codes ICD-9: 162, 162.2, 162.3, 162.4, 162.5, 162.8, 162.9 and 231.2).
Study VariablesThe incidence rates of hospitalization were determined by sex, and for each age group, dividing the number of cases by year, and for each age group, sex and number of inhabitants according to the National Institute of Statistics report for the 31 December of each year. The incidence rate was expressed as the number of cases per 100000 inhabitants, and days and cost of hospital stay, and the type of hospital were estimated.
Costs were calculated using diagnosis-related groups (DRG) for LC, and adjusted for inflation rates in Spain over the study period. The principal clinical characteristics studied included comorbidities at the time of hospitalization, readmission, and the most important procedures undertaken. Comorbidity at the time of admission was quantified using the Charlson index14 (composed of 17 disease categories), by which an overall score is obtained for each patient by adding the points assigned to each of the component diseases.
Patients were classified into three categories: (1) low index: patients who had none of the diseases listed in the index, and therefore scored 0; (2) medium index: patients with 1–2 disease categories; and (3) high index: patients with 2 or more disease categories. Procedures recorded included imaging tests (chest radiograph, chest CT and scintigraphy), functional studies (arterial blood gases), and more invasive diagnostic and/or therapeutic procedures (thoracocentesis, mediastinoscopy, thoracotomy, and pleural biopsy).
Statistical AnalysisThe incidence of admission is shown as number of cases and incidence rate per 100000 inhabitants for each age group, sex, and year. Quantitative variables are expressed as mean±standard deviation (SD) and qualitative variables as percentages and absolute frequencies. Comparisons were performed using the chi-squared test, ANOVA, and ANCOVA. Time trends in the incidence of hospitalization and associated factors were calculated using Poisson multivariate regression models, adjusting for sex and age group. Interactions between independent variables were studied in the regression models. Statistical analysis was performed using the SPSS package, version 22, and Poisson models were generated using STATA version 11.2. Statistical significance was set at a two-tailed level of P<.05.
Confidentiality and Informed ConsentData were handled in a fully confidential manner, according to applicable Spanish legislation. To maintain strict confidentiality, patients’ identity was removed from the information before the database was constructed, thus making it impossible to obtain a patient's personal details from the study or from the database. In view of the mandatory anonymity of the data set, informed consent was not required. The Ministry of Health evaluated our study protocol and the data set, and considered that it met all ethical and legal requirements.
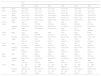
ResultsIncidence of HospitalizationsIn total, 298435 hospitalizations (257072 men and 41363 women) with LC as a primary diagnosis were detected in Spain between 2001 and 2011. Table 1 and Figs. 1–3 show the incidence of hospitalization and incidence rates by age group, sex, and year. The overall rate of hospitalizations rose from 61.18 to 65.08 per 100000 inhabitants between 2001 and 2011 (P<.001) with a marked difference between sexes. The rate for men fell progressively from 112.5 to 107.7 (P<.001), while for women, in contrast, the rate rose from 11.8 to 23.6 (P<.001). The age interval with the highest incidence was 70–79 years for both sexes.
Incidence of Hospital Admissions in Spain 2001–2011 with Lung Cancer as Primary Diagnosis, by age and sex.
| Year | |||||||
|---|---|---|---|---|---|---|---|
| 2001 | 2002 | 2003 | 2004 | 2005 | 2006 | ||
| <40 years | Men | 246 (2.20) | 249 (2.19) | 231 (2.01) | 252 (2.16) | 198 (1.68) | 173 (1.45) |
| Women | 146 (1.37) | 133 (1.23) | 131 (1.20) | 124 (1.13) | 142 (1.28) | 102 (0.91) | |
| Total | 392 (1.79) | 382 (1.72) | 362 (1.61) | 376 (1.66) | 340 (1.49) | 275 (1.19) | |
| 40–49 years | Men | 1581 (55.77) | 1568 (53.41) | 1522 (49.97) | 1540 (48.41) | 1384 (41.96) | 1443 (42.27) |
| Women | 330 (11.58) | 350 (11.90) | 477 (15.69) | 559 (17.70) | 569 (17.45) | 592 (17.63) | |
| Total | 1911 (33.61) | 1918 (32.64) | 1999 (32.84) | 2099 (33.11) | 1953 (29.78) | 2035 (30.05) | |
| 50–59 years | Men | 4442 (193.18) | 4273 (179.98) | 4233 (174.96) | 4591 (186.27) | 4634 (184.54) | 4459 (172.92) |
| Women | 456 (19.18) | 502 (20.48) | 546 (21.88) | 617 (24.31) | 677 (26.24) | 798 (30.18) | |
| Total | 4898 (104.73) | 4775 (98.97) | 4779 (97.24) | 5208 (104.11) | 5311 (104.32) | 5257 (100.66) | |
| 60–69 years | Men | 7235 (389.21) | 6658 (361.06) | 6566 (353.27) | 6738 (357.70) | 6835 (356.03) | 6708 (345.29) |
| Women | 561 (27.03) | 584 (28.46) | 571 (27.73) | 650 (31.28) | 694 (32.89) | 719 (33.87) | |
| Total | 7796 (198.14) | 7242 (185.89) | 7137 (182.17) | 7388 (186.47) | 7529 (186.84) | 7427 (182.68) | |
| 70–79 years | Men | 7347 (514.41) | 7282 (496.58) | 7113 (473.47) | 7637 (498.75) | 7542 (484.38) | 7382 (466.44) |
| Women | 673 (36.02) | 719 (37.72) | 695 (35.73) | 748 (37.93) | 827 (41.45) | 863 (42.71) | |
| Total | 8020 (243.26) | 8001 (237.25) | 7808 (226.49) | 8385 (239.35) | 8369 (235.61) | 8245 (228.83) | |
| ≥80 years | Men | 1796 (335.26) | 1866 (329.08) | 2095 (351.59) | 2301 (366.24) | 2469 (375.73) | 2483 (357.39) |
| Women | 294 (27.91) | 345 (31.28) | 349 (30.54) | 362 (30.34) | 406 (32.80) | 421 (32.52) | |
| Total | 2090 (131.53) | 2211 (132.40) | 2444 (140.58) | 2663 (146.21) | 2875 (151.73) | 2904 (145.98) | |
| Total | Men | 22647 (112.58) | 21896 (106.59) | 21760 (103.99) | 23059 (108.08) | 23062 (106.18) | 22648 (102.39) |
| Women | 2460 (11.76) | 2633 (12.37) | 2769 (12.81) | 3060 (13.93) | 3315 (14.87) | 3495 (15.42) | |
| Total | 25107 (61.18) | 24529 (58.64) | 24529 (57.65) | 26119 (60.33) | 26377 (59.93) | 26,143 (58.37) | |
| 2007 | 2008 | 2009 | 2010 | 2011 | P | P trend | ||
|---|---|---|---|---|---|---|---|---|
| <40 years | Men | 227 (1.88) | 192 (1.58) | 162 (1.35) | 132 (1.11) | 140 (1.20) | <.001 | <.001 |
| Women | 121 (1.06) | 136 (1.19) | 137 (1.21) | 124 (1.10) | 123 (1.11) | <.001 | <.001 | |
| Total | 348 (1.48) | 328 (1.39) | 299 (1.28) | 256 (1.11) | 263 (1.15) | <.001 | <.001 | |
| 40–49 years | Men | 1443 (40.88) | 1371 (37.93) | 1246 (33.90) | 1200 (32.18) | 1110 (29.32) | <.001 | <.001 |
| Women | 593 (17.17) | 602 (17.09) | 656 (18.34) | 564 (15.58) | 631 (17.19) | <.001 | <.001 | |
| Total | 2036 (29.16) | 1973 (27.64) | 1902 (26.23) | 1764 (24.00) | 1741 (23.35) | <.001 | <.001 | |
| 50–59 years | Men | 4561 (171.45) | 4663 (171.57) | 4605 (165.18) | 4585 (159.50) | 4571 (154.75) | <.001 | <.001 |
| Women | 914 (33.59) | 1191 (42.93) | 1287 (45.31) | 1265 (43.24) | 1470 (48.91) | <.001 | <.001 | |
| Total | 5475 (101.73) | 5854 (106.59) | 5892 (104.69) | 5850 (100.85) | 6041 (101.37) | <.001 | .319 | |
| 60–69 years | Men | 6790 (340.88) | 7256 (349.13) | 7710 (355.48) | 7785 (356.66) | 7933 (354.25) | <.001 | <.001 |
| Women | 770 (35.50) | 933 (41.34) | 1064 (45.25) | 1309 (55.45) | 1375 (56.81) | <.001 | <.001 | |
| Total | 7560 (181.69) | 8189 (188.90) | 8774 (194.11) | 9094 (200.16) | 9308 (199.76) | <.001 | <.001 | |
| 70–79 years | Men | 7740 (486.50) | 7840 (498.24) | 7780 (506.82) | 7740 (496.45) | 7705 (498.49) | <.001 | .62 |
| Women | 1004 (49.61) | 973 (48.82) | 1012 (52.13) | 1090 (55.81) | 1205 (62.58) | <.001 | <.001 | |
| Total | 8744 (241.91) | 8813 (247.10) | 8792 (252.91) | 8830 (251.41) | 8910 (256.68) | <.001 | <.001 | |
| ≥80 years | Men | 2762 (379.82) | 2817 (368.02) | 3184 (396.15) | 3329 (393.21) | 3421 (385.45) | <.001 | <.001 |
| Women | 476 (35.43) | 569 (40.64) | 597 (41.02) | 655 (43.08) | 785 (49.78) | <.001 | <.001 | |
| Total | 3238 (156.36) | 3386 (156.36) | 3781 (167.37) | 3984 (168.30) | 4206 (170.67) | <.001 | <.001 | |
| Total | Men | 23523 (104.12) | 24139 (105.50) | 24687 (107.42) | 24771 (107.47) | 24880 (107.71) | <.001 | .039 |
| Women | 3878 (16.80) | 4404 (18.85) | 4753 (20.22) | 5007 (21.20) | 5589 (23.56) | <.001 | <.001 | |
| Total | 27401 (60.00) | 28543 (61.73) | 29440 (63.33) | 29778 (63.81) | 30469 (65.08) | <.001 | <.001 |


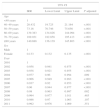
Table 2 and Fig. 4 show the length of stay (in days), cost per hospitalization, and distribution of the Charlson index, together with the rates of readmission and hospital type. Mean length of stay fell significantly during the study period, from 12.13 days (SD 11.60) in 2001 to 10.07 days (SD 11.22) in 2011 (P<.001); in contrast, cost per hospitalization rose progressively from €4471.22 (SD 2677.80) in 2001 to €5562.54 (SD 6222.50) in 2011 (P<.001).
Characteristics of Admissions for Lung Cancer as Primary Diagnosis in Spain, 2001–2011.
| Year | ||||||||||||||||
|---|---|---|---|---|---|---|---|---|---|---|---|---|---|---|---|---|
| 2001 | 2002 | 2003 | 2004 | 2005 | 2006 | 2007 | 2008 | |||||||||
| SD | Mean | SD | Mean | SD | Mean | SD | Mean | SD | Mean | SD | Mean | SD | Mean | SD | Mean | |
| Length of stay | 12.13 | 11.60 | 11.81 | 11.14 | 11.85 | 11.45 | 11.85 | 11.23 | 11.64 | 11.47 | 11.64 | 11.10 | 11.61 | 12.29 | 11.16 | 11.10 |
| Cost (€) | 4.471.2 | 2.677.8 | 4.733.1 | 2.826.6 | 4.913.5 | 3.001.7 | 5.090.1 | 3.120.4 | 4.910.7 | 3.124.2 | 5.197.5 | 3.470.9 | 5.460.65 | 3.852 | 5.717.9 | 4.051.3 |
| Year | ||||||||||||||||
|---|---|---|---|---|---|---|---|---|---|---|---|---|---|---|---|---|
| 2001 | 2002 | 2003 | 2004 | 2005 | 2006 | 2007 | 2008 | |||||||||
| n | % | n | % | n | % | n | % | n | % | n | % | n | % | n | % | |
| Charlson 0 | 7.532 | 30.0 | 7.183 | 29.3 | 6.776 | 27.6 | 6.860 | 26.3 | 6.953 | 26.4 | 7.238 | 27.7 | 7.388 | 27.0 | 7.532 | 26.4 |
| Charlson 1–2 | 16.434 | 65.5 | 16.071 | 65.5 | 16.249 | 66.2 | 17.532 | 67.1 | 17.629 | 66.8 | 17.010 | 65.1 | 18.010 | 65.7 | 18.690 | 65.5 |
| Charlson>2 | 1.141 | 4.5 | 1.275 | 5.2 | 1.504 | 6.1 | 1.727 | 6.6 | 1.795 | 6.8 | 1.895 | 7.2 | 2.003 | 7.3 | 2.321 | 8.1 |
| New episode | 20.183 | 80.4 | 19.798 | 80.7 | 19.913 | 81.2 | 21.202 | 81.2 | 21.236 | 80.5 | 21.127 | 80.8 | 22.295 | 81.4 | 23.117 | 81.0 |
| Readmission | 4.924 | 19.6% | 4.731 | 19.3 | 4.616 | 18.8 | 4.917 | 18.8 | 5.141 | 19.5 | 5.016 | 19.2 | 5.106 | 18.6 | 5.426 | 19.0 |
| National Health System | 25.107 | 100.0 | 24.529 | 100.0 | 24.529 | 100.0 | 26.119 | 100.0 | 25.826 | 97.9 | 25.559 | 97.8 | 26.167 | 95.5 | 26.729 | 93.6 |
| Private | 0 | 0.0 | 0 | 0.0 | 0 | 0.0 | 0 | 0.0 | 551 | 2.1 | 584 | 2.2 | 1.234 | 4.5 | 1.814 | 6.4 |
| Year | Unadjusted | Adjusted for age and sex | ||||||||
|---|---|---|---|---|---|---|---|---|---|---|
| 2009 | 2010 | 2011 | p linear trend | |||||||
| Mean | SD | Mean | SD | Mean | SD | P | P | |||
| Length of stay | 11.02 | 11.41 | 10.56 | 11.68 | 10.07 | 11.22 | <.001 | <.001 | <.001 | <.001 |
| Cost (€) | 5776.22 | 4112.02 | 5463.77 | 6446.78 | 5562.54 | 6222.50 | <.001 | <.001 | <.001 | <.001 |
| Year | Unadjusted | Adjusted for age and sex | ||||||||
|---|---|---|---|---|---|---|---|---|---|---|
| 2009 | 2010 | 2011 | P linear trend | P linear trend | ||||||
| n | % | n | % | n | % | P | P | |||
| Charlson 0 | 7259 | 24.7 | 7239 | 24.3 | 7427 | 24.4 | <.001 | <.001 | <.001 | <.001 |
| Charlson 1–2 | 19669 | 66.8 | 19846 | 66.6 | 20258 | 66.5 | .019 | .001 | ||
| Charlson>2 | 2512 | 8.5 | 2693 | 9.0 | 2784 | 9.1 | <.001 | <.001 | ||
| New Episode | 23947 | 81.3 | 24122 | 81.0 | 24645 | 80.9 | .063 | .073 | 0.12 | .86 |
| Readmission | 5493 | 18.7 | 5656 | 19.0 | 5824 | 19.1 | ||||
| National Health System | 27555 | 93.6 | 27609 | 92.7 | 27686 | 90.9 | <.001 | <.001 | <.001 | <.001 |
| Private | 1885 | 6.4 | 2169 | 7.3 | 2.783 | 9.1 | ||||
Data are presented as mean and standard deviation or as number and percentage, as applicable. Association and linear trend P-values, raw and adjusted for age and sex, are shown.

During the study period, most patients had a Charlson comorbidity index score of 1–2. Moreover, the percentage of patients with a Charlson comorbidity index>2 increased from 4.5% in 2001 to 9.1% in 2011 (P<.05). All admissions between 2001 and 2004 were to hospitals belonging to the National Health System; in 2005, the hospital type expanded to include private hospitals, accounting for 2.1% of hospitalizations, rising to 9.1% of all hospitalizations by 2011 (P<.05). Readmission trends remained unchanged throughout the study period.
Diagnostic ProceduresAs shown in Table 3 and Figs. 5 and 6, the most frequent diagnostic procedure was chest CT, performed in 72.8% of patients in 2001 and 74.8% in 2011 (P<.05). In second place was chest radiography, which increased in frequency from 9.6% in 2001 to 17.7% in 2011.
Diagnostic Procedures Used in Patients Admitted for Lung Cancer as Primary Diagnosis in Spain, 2001–2011.
| Year | ||||||||||||||||||||||
|---|---|---|---|---|---|---|---|---|---|---|---|---|---|---|---|---|---|---|---|---|---|---|
| 2001 | 2002 | 2003 | 2004 | 2005 | 2006 | 2007 | 2008 | 2009 | 2010 | 2011 | ||||||||||||
| n | % | n | % | n | % | n | % | n | % | n | % | n | % | n | % | n | % | n | % | n | % | |
| Chest CT | 9130 | 36.4 | 9234 | 37.6 | 9455 | 38.5 | 10181 | 39.0 | 9952 | 37.7 | 9871 | 37.8 | 10646 | 38.9 | 10952 | 38.4 | 11366 | 38.6 | 11238 | 37.7 | 11384 | 37.4 |
| Chest radiograph | 2416 | 9.6 | 3285 | 13.4 | 3504 | 14.3 | 4245 | 16.3 | 4268 | 16.2 | 4368 | 16.7 | 4721 | 17.2 | 4932 | 17.3 | 4561 | 15.5 | 4967 | 16.7 | 5398 | 17.7 |
| Thoracocentesis | 928 | 3.7 | 979 | 4.0 | 1057 | 4.3 | 1232 | 4.7 | 1197 | 4.5 | 1171 | 4.5 | 1250 | 4.6 | 1299 | 4.6 | 1369 | 4.7 | 1398 | 4.7 | 1610 | 5.3 |
| Mediastinoscopy | 650 | 2.6 | 636 | 2.6 | 650 | 2.6 | 709 | 2.7 | 610 | 2.3 | 497 | 1.9 | 526 | 1.9 | 573 | 2.0 | 535 | 1.8 | 548 | 1.8 | 547 | 1.8 |
| Bronchoscopy | 2042 | 8.1 | 1962 | 8.0 | 2055 | 8.4 | 2163 | 8.3 | 2058 | 7.8 | 2105 | 8.1 | 2212 | 8.1 | 1995 | 7.0 | 1983 | 6.7 | 1894 | 6.4 | 1986 | 6.5 |
| Arterial blood gases | 1727 | 6.9 | 2159 | 8.8 | 2447 | 10.0 | 2729 | 10.4 | 2814 | 10.7 | 2650 | 10.1 | 2878 | 10.5 | 2964 | 10.4 | 2900 | 9.9 | 2676 | 9.0 | 2587 | 8.5 |
| Pleural biopsy | 227 | 0.9 | 263 | 1.1 | 217 | 0.9 | 238 | 0.9 | 215 | 0.8 | 239 | 0.9 | 203 | 0.7 | 222 | 0.8 | 260 | 0.9 | 280 | 0.9 | 338 | 1.1 |
| Exploratory thoracotomy | 218 | 0.9 | 242 | 1.0 | 180 | 0.7 | 201 | 0.8 | 177 | 0.7 | 181 | 0.7 | 203 | 0.7 | 175 | 0.6 | 188 | 0.6 | 136 | 0.5 | 142 | 0.5 |
| Lung scintigraphy | 592 | 2.4 | 501 | 2.0 | 525 | 2.1 | 567 | 2.2 | 608 | 2.3 | 587 | 2.2 | 669 | 2.4 | 566 | 2.0 | 707 | 2.4 | 542 | 1.8 | 478 | 1.6 |
| Procedure | Unadjusted | Adjusted for Age and Sex | ||
|---|---|---|---|---|
| p Linear | P Linear | |||
| P | Trend | P | Trend | |
| Chest CT | <.001 | .13 | <.001 | .43 |
| Chest radiograph | <.001 | <.001 | <.001 | <.001 |
| Thoracocentesis | <.001 | <.001 | <.001 | <.001 |
| Mediastinoscopy | <.001 | <.001 | <.001 | <.001 |
| Bronchoscopy | <.001 | <.001 | <.001 | <.001 |
| Arterial blood gases | <.001 | .001 | <.001 | .004 |
| Pleural biopsy | <.001 | .59 | <.001 | .68 |
| Exploratory thoracotomy | <.001 | <.001 | <.001 | <.001 |
| Lung scintigraphy | <.001 | <.001 | <.001 | <.001 |
Data are presented as number and percentage of admissions in which the procedure was used. Association and linear trend p-values, raw and adjusted for age and sex, are shown.
.")
.")
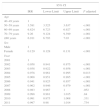
Tables 4 and 5 show the multivariate analysis of trends and factors associated with the incidence of hospitalization for LC during the study period. After adjusting for confounding factors using Poisson regression models, a statistically significant reduction in incidence was observed in all but the last 3 years (2009, 2010, and 2011) during which the reduction continued but was no longer statistically significant. Factors associated with the incidence of hospital admissions for LC were age (IRR, 189.03; 95% CI: 136.13–145.80 for patients aged 70–79 years compared to patients aged<40 years, P<.001) and sex (IRR 0.133; 95% CI: 0.132–0.135 in women compared to men, P<.001).
Multivariate Analysis of Trends and Factors Associated with the Incidence of Admissions for Lung Cancer as Primary Diagnosis in Spain, 2001–2011.
| 95% CI | ||||
|---|---|---|---|---|
| IRR | Lower Limit | Upper Limit | P adjusted | |
| Age | ||||
| <40 years | 1 | |||
| 40–49 years | 20.432 | 19.725 | 21.164 | <.001 |
| 50–59 years | 73.16 | 70.746 | 75.656 | <.001 |
| 60–69 years | 139.383 | 134.826 | 144.094 | <.001 |
| 70–79 years | 189.031 | 182.858 | 195.413 | <.001 |
| ≥80 years | 140.888 | 136.139 | 145.803 | <.001 |
| Sex | ||||
| Male | 1 | |||
| Female | 0.133 | 0.132 | 0.135 | <.001 |
| Year | ||||
| 2001 | 1 | |||
| 2002 | 0.958 | 0.941 | 0.975 | <.001 |
| 2003 | 0.938 | 0.921 | 0.955 | <.001 |
| 2004 | 0.977 | 0.96 | 0.994 | .009 |
| 2005 | 0.966 | 0.949 | 0.983 | <.001 |
| 2006 | 0.937 | 0.92 | 0.953 | <.001 |
| 2007 | 0.96 | 0.944 | 0.977 | <.001 |
| 2008 | 0.98 | 0.963 | 0.997 | .002 |
| 2009 | 0.994 | 0.977 | 1.011 | .485 |
| 2010 | 0.986 | 0.97 | 1.003 | .107 |
| 2011 | 0.992 | 0.976 | 1.009 | .351 |
IRR: incidence rate ratio.
A Poisson multivariate regression model was used.
Independent variables are shown in the table. The population in each stratum is the exposure variable.
The dependent variable is the number of cases of lung cancer.
Multivariate Analysis of Trends and Factors Associated with the Incidence of Admissions for Lung Cancer as Primary Diagnosis in Spain, 2001–2011 (Excluding Patients<40 Years of Age).
| 95% CI | ||||
|---|---|---|---|---|
| IRR | Lower Limit | Upper Limit | P adjusted | |
| Age | ||||
| 40–49 years | 1 | |||
| 50–59 years | 3.581 | 3.525 | 3.637 | <.001 |
| 60–69 years | 6.824 | 6.723 | 6.927 | <.001 |
| 70–79 years | 9.26 | 9.124 | 9.399 | <.001 |
| ≥80 years | 6.911 | 6.793 | 7.03 | <.001 |
| Sex | ||||
| Male | 1 | |||
| Female | 0.129 | 0.128 | 0.131 | <.001 |
| Year | ||||
| 2001 | 1 | |||
| 2002 | 0.958 | 0.941 | 0.975 | <.001 |
| 2003 | 0.938 | 0.922 | 0.956 | <.001 |
| 2004 | 0.978 | 0.961 | 0.995 | 0.013 |
| 2005 | 0.968 | 0.951 | 0.985 | <.001 |
| 2006 | 0.941 | 0.925 | 0.957 | <.001 |
| 2007 | 0.962 | 0.946 | 0.979 | <.001 |
| 2008 | 0.983 | 0.967 | 1 | .052 |
| 2009 | 0.998 | 0.981 | 1.015 | .84 |
| 2010 | 0.991 | 0.975 | 1.008 | .331 |
| 2011 | 0.997 | 0.98 | 1.014 | .734 |
IRR: incidence rate ratio.
A Poisson multivariate regression model was used.
Independent variables are shown in the table. The population in each stratum is the exposure variable.
The dependent variable is the number of cases of lung cancer.
In this study, we detected 298435 hospitalizations for LC in Spain between 2001 and 2011, with an increase in the overall rate of admissions during that period. Although few studies provide numerical data on hospitalizations in LC patients, it is worth mentioning the work of García et al.,15 who reported on 335186 hospitalizations for cancer in Spain in 2008. In our study, 28543 patients were hospitalized for LC during that year.
We also found a marked difference between men and women, with a reduction in the rate of hospitalization among men, and an increase among women. These data coincide with the general trend described in other studies, such as that of Bello et al.,1 conducted between 1995 and 2006. Egleston et al.8 reported a LC risk of 1 in 13 among men and 1 in 16 among women, and described a geographical distribution of the risk which was higher in Europe than in Asia and Australia. The incidence of LC among women has increased in the last 20 years, due, among other reasons, to the increase in smoking among women. Chang et al.2 noted this trend when they revealed a fall in the men-to-women incidence ratio from 2.16 in 1996 to 1.91 in 2008. Similar data were published by Galceran et al.3 who described a lower rate of hospitalization among men, probably due to a reduction in the incidence of LC in this subject subgroup, which fell by 6.1% a year in the period 1993–2014. In contrast, in Spain an increase of 48% was observed among women over the same period.3
The age group with the greatest incidence in our case was the 70–79-year-old group; in this group, no difference was observed between the sexes. Our data are in line with the mean age (72.1 years) of LC diagnosis in Spain reported in other studies,10,11,16 although women were younger at diagnosis than men.17 In other countries, such as Taiwan and Croatia, a younger mean age of 67.8 years has been reported, with an increased incidence of LC among patients aged between 70 and 79 years.2,18 However, we must remember that our study refers to the mean age of patients at the time of hospitalization, not only age at diagnosis, but also in patients who were admitted for other reasons apart from their diagnosis of LC and/or LC complications.
In the 10-year study period, we observed a reduction in the mean length of hospital stay, down to 10.07 days in 2011, and an increase in the mean cost of admission, up to €5562.54. It must be taken into account that the length of stay includes days that the patient remained in hospital for diagnostic procedures and/or for LC treatment, the management of complications, and performance of procedures. Although few studies have been published regarding hospitalizations in these patients, García et al.15 reported a mean length of stay of 11.2–11.4 days in patients admitted for LC attributable to occupational exposure in 2008, with a cost per admission of €5728.91–€5777.07, although they did not specify if the hospitalizations were scheduled for diagnostic or other procedures. Skaug et al.12 published a study of hospital stays in LC patients between 1990 and 1996, with follow-up until 2003. They classified hospital stay into three groups: diagnostic hospitalization, terminal hospitalization (patient admitted for palliative care including end-of-life care), and other hospital stays. They reported a mean stay of 7.8 days, with a total 35 days hospitalization per patient throughout the study period. Mean length of stay figures according to their classification were as follows: 18.5 days for diagnostic hospitalization, 21 days for terminal care, 27.5 days for palliative care, and 57 days for hospitalizations for other reasons. With regard to costs, Demeter et al.18 described the distribution of the annual costs of patients with a diagnosis of LC: 30% was spent on home care, 24% for long-term institutional care (nursing homes, etc.) and 46% for hospital management, including diagnostic procedures and/or treatment.
Most patients in our study had a low comorbidity burden (Charlson 1–2), although the percentage of patients with Charlson>2 increased during the study period. Other studies underline the importance of comorbidities as a prognostic factor in the diagnosis and treatment of LC, and report a comorbidity burden that increases with age at the time of the finding. However, we could not establish any specific relationship between comorbidities and how they were divided numerically.
All admissions registered in this study occurred in hospitals belonging to the National Health System, until private hospitals were incorporated in 2005, which by 2011 accounted for 9% of all hospitalizations. We have not found any other similar studies with which to compare our data.
The procedure most frequently performed during the hospital stay was chest CT, at a rate of 74.8% in 2011. These data coincide with the percentages registered in the published series. This examination and PET-CT are the procedures which have done most to improve diagnosis, staging and follow-up in LC.5,8,19
In the multivariate analysis of trends and factors associated with the incidence of hospitalization for LC during the study period, we observed a statistically significant reduction in incidence in all years except the 2009–2011 period. Factors associated with the incidence of admissions were age for patients aged 70–79 years, compared to those aged<40 years, and female compared to male sex. A similar reduction in incidence over the last 10 years has been highlighted by other authors, interestingly in the same age group and with same difference between sexes.2,7,10
This study has several limitations. Firstly, the information collected in the database has certain methodological problems (including lost data and transcription errors): although the database contains a wealth of information, access to data that would be of great clinical interest is limited, e.g. smoking habit and lung tumor histology (several histologies in the same patient cannot be differentiated), and it is impossible to establish in which hospital admission the diagnosis was made. Moreover, the relative lack of literature and the absence of similar studies to ours have restricted our ability to set up comparisons and parallels.
In conclusion, between 2000 and 2010, the hospitalization rate fell among men and rose among women, the comorbidity burden and cost of LC increased, and mean hospital stay became shorter. Factors associated with the incidence of admissions for LC are age, sex, and year of study: patients were predominantly in the 70–79-year age group, and with regard to sex, women predominated over men.
Conflict of InterestsThe authors declare that they have no conflict of interests directly or indirectly related with the contents of this manuscript.
Please cite this article as: Palacio Nebreda MM, de Miguel-Diez J, Villegas Fernández FR, Segura Fragoso A, Rodríguez Calderón JL, Martínez Hernández D. Tendencias en la incidencia de hospitalizaciones por cáncer de pulmón en España entre 2001 y 2011. Arch Bronconeumol. 2016;52:411–419.


