To determine the prevalence of influenza vaccination in chronic obstructive pulmonary disease (COPD) patients, and the effectiveness of the procedure.
MethodsRetrospective population-based cohort study. On 31 December 2011, influenza vaccination history was retrieved from 899 patients with confirmed COPD selected by simple random sampling from all COPD patients in Cantabria (northern Spain). Severe exacerbations (hospitalization due to COPD exacerbation) and overall mortality during 2012 were treated as dependent variables. Odds ratios (OR) were estimated by logistic regression, adjusting for age, sex, smoking status, severity of COPD, and frequency of exacerbations during the previous year. Prevented fraction among the exposed (PFe-adjusted) was determined as a measure of impact.
ResultsOverall prevalence of influenza vaccination was 62.7%, but this rate fell in patients classified as more severe according to FEV1 (52.0%). Influenza vaccination showed a statistically significant protective effect against severe exacerbations in the following year: aOR: 0.54 (95% CI: 0.35–0.84); FPe-adjusted: 0.46 (95% CI: 0.16–0.65). A non-significant protective effect for overall mortality was observed: aOR: 0.76 (95% CI: 0.41–1.40). When stratified according to COPD severity (FEV1), the protective effect against risk of hospitalization was higher in more severe COPD patients: aOR: 0.23 (95% CI: 0.11–0.48); FPe-adjusted: 0.77 (95% CI: 0.52–0.89).
ConclusionsWe found that influenza vaccination has a protective effect and reduces the risk of hospitalization due to exacerbations in the following year. Despite the evidence for protection, prevalence of vaccination was not optimal, especially in more severe COPD patients.
Determinar la prevalencia de vacunación antigripal en una muestra poblacional de pacientes EPOC y la efectividad de la vacunación.
MetodologíaEstudio de cohortes retrospectivo. Se identificaron los antecedentes de vacunación antigripal (campaña 2011-2012) en 899 pacientes con EPOC confirmada obtenidos mediante muestreo aleatorio simple a partir de todos los EPOC identificados a 31 de diciembre de 2011 en Cantabria. Las agudizaciones graves (ingresos por agudización EPOC) y la mortalidad por todas las causas durante el año 2012 fueron tratadas como variables dependientes, calculándose odds ratios ajustadas (ORa) como medida de asociación y fracciones de prevención ajustadas en los expuestos (PFe-ajustada) como medida de impacto.
ResultadosLa prevalencia global de vacunación fue del 62,7%. Esta prevalencia fue menor en EPOC muy grave en base al FEV1 (52,0%). La vacunación antigripal mostró un efecto protector estadísticamente significativo sobre el riesgo de agudizaciones graves al año siguiente: ORa: 0,54 (IC 95%: 0,35-0,84); PFe-ajustada: 0,46 (IC 95%: 0,16-0,65). El riesgo de mortalidad fue menor, pero sin alcanzar significación estadística: Ora: 0,76 (IC 95%: 0,41-1,40). Al estratificar en función de la gravedad de la EPOC, el efecto protector para el riesgo de ingreso por agudización fue mayor en EPOC más graves: Ora: 0,23 (IC 95%: 0,11-0,48); PFe-ajustada: 0,77 (IC 95%: 0,52-0,89).
ConclusionesNuestros resultados apoyan el efecto protector de la vacunación antigripal, disminuyendo el riesgo de ingreso por agudización. A pesar de nuestros resultados protectores, la prevalencia global de vacunación antigripal fue subóptima, especialmente en los EPOC con un estadio más grave.
Several systematic reviews and meta-analyses have been published recently, supporting the safety and benefits of influenza vaccination in the general adult population. In this population, vaccination is expected to have a modest effect on influenza-like symptoms and time off work.1,2
In specific risk subgroups, such as patients with chronic obstructive pulmonary disease (COPD), the general consensus is in favor of influenza vaccination, but the number of published studies is smaller.3
Moreover, in developed countries, rates of vaccination among COPD patients vary widely, and the prevalence of vaccination is largely described as suboptimal.4,5 COPD prevalence also varies among different series, depending on the country and region of the study, according to international consensus guidelines.6
For this reason, most COPD studies and reviews7–13 conclude that more work is needed to determine the effectiveness of influenza vaccination in different geographical regions and patient subgroups.
This heterogeneity in vaccination prevalence appears to be greater in Spain, where the latest studies report a prevalence of between 52.2%13 and 87.2%.14,15 Similarly, COPD prevalence appears to vary in Spain, depending on the region under study.16
The main objective of our study was to determine influenza vaccination rates in a population sample of COPD patients in Cantabria, and the effectiveness of the vaccine in reducing the risk of severe exacerbations.
MethodologyStudy Design and PopulationThis was a retrospective cohort study. The flow chart for selecting study patients is shown in Fig. 1.
We examined an overall population of 362372 healthcare users aged 35 years or older, registered in the public health system of Cantabria as of December 31, 2011, and selected those with an International Classification of Primary Care (ICPC)17 consistent with COPD (codes R91 and R95). A total of 9334 cases were identified. Of these, a simple randomized sampling procedure was used to select 2000 cases.
Data were collected from the individualized review of health center clinical records, using the OMP-AP database and the Corporate Visor (eVISOR), which provides access to emergency department reports, discharge reports and outpatient clinic records in hospitals in Cantabria.
The personal clinical records of 11 cases could not be accessed, for reasons unknown, despite consulting the CIVITAS population data system which records registrations and deregistrations (deaths, relocation, loss of health cover, etc.).
An active search was performed in the clinical records of the 1989 accessible patients, and of these, COPD was ruled out in 70 who had a reversible obstructive pattern on least 1 post-bronchodilator spirometry. The spirometries of another 127 patients showed a non-obstructive pattern, so COPD was also ruled out in these patients.
No spirometry records were available for 315 patients, so in these cases diagnosis could be neither confirmed nor ruled out. At least 1 spirometry showing an obstructive pattern was available for 577 patients, but either no post-bronchodilator challenge was performed, or no record of post-bronchodilator challenge was available, so diagnosis was also inconclusive in these patients.
COPD could be confirmed in 45.3% (n=900) of the patients included in the original sample, according to confirmed spirometric data (FEV1/FVC<70% post-bronchodilation). We decided to use an analysis strategy that would prioritize internal validity, limiting the analysis to that population.
VariablesSociodemographic characteristics were collected for each patient, including sex, age, smoking habit, alcohol consumption, comorbidities, years since COPD diagnosis, treatments, and history of 23-valent pneumococcal and influenza vaccination (seasons 2011–2012 and 2012–2013), and number and severity of COPD exacerbations.
“COPD exacerbation” was defined as any episode involving an increase in the patient's baseline COPD symptoms (cough, expectoration, and/or dyspnea), requiring the prescription of an antibiotic and/or systemic corticosteroid (moderate exacerbation), or hospitalization for more than 24h (severe exacerbation).18–20
The total frequency of exacerbations (moderate and severe) was quantified in the previous year (2011) and the following year (2012). “Exacerbator phenotype” was defined as a patient who presented at least 2 exacerbations in 1 year, according to the definition of the main national and international guidelines.6,13,18,20 A “non-exacerbator phenotype” was one who had ≤1 exacerbation in 1 year.
Each exacerbation had to be separated by a period of at least 4 weeks since the end of treatment for the previous exacerbations, to differentiate a new event from a previous treatment failure.
All-cause mortality in 2012 was calculated.
Study patients were classified in 2 cohorts, according to whether they had received or not received influenza vaccination in the 2011–2012 campaign (between 18 October and 30 November). Information for this variable was obtained in 899 of the 900 patients.
Patients were also classified according to their degree of bronchial obstruction, based on FEV1 data, defined by the GOLD guidelines6: mild: ≥80%; moderate: ≥50% to <80%; severe: ≥30% to <50%; very severe: <30% (GOLD stages 1–4).
Statistical AnalysisFor categorical and discrete variables, proportions were estimated using Pearson's Chi-squared test for comparisons, or Fisher's exact test, when necessary. Quantitative variables were expressed as mean and standard deviation (SD) using the Student t test for comparisons, after normal distribution had been confirmed using the Shapiro–Wilk test.
Dichotomous values: “at least 1 admission for COPD exacerbation”, “all-cause death”, and “exacerbator phenotype or not” during 2012 were treated as dependent (effect) variables. The final sample size (n=899) would have sufficient power (1−β>90%) to detect relative risks ≥1.16 as significant for a 50% risk of the effect in the unexposed, considering an unexposed/exposed ratio of 1, using a 2-tailed Chi-squared test with an alpha level <0.05.
As a measure of association, crude odds ratios (cOR) were estimated using unconditional logistic regression, with 95% confidence intervals (95% CI) and odds ratios adjusted (aOR) for age (continuous variable), sex, and smoking habit (ordinal variable: non-smoker, former smoker, current smoker), and a “propensity score” which included: COPD severity (GOLD stages 1–4), frequency and severity of exacerbations the previous year, and presence of comorbidities (diabetes mellitus and heart failure).
Associations for a history of influenza vaccination in the 2011–2012 campaign were stratified according to COPD severity (GOLD stages 1–2 versus GOLD stages 3–4).
Prevented fraction in the exposed (PFe-adjusted) was determined as a measure of impact, using the formula (1−aOR), together with its 95% CI, using the formula [(1−upper limit of 95% CI of the aOR) to (1−lower limit of 95% CI of the aOR)].
The alpha error was set at 0.05, and all P-values were 2-tailed. All statistical analyses were performed using the IBM SPSS v22.0 software package.
The study protocol was approved by the Clinical Research Ethics Committee of Cantabria, and data were anonymised before the statistical analysis was performed.
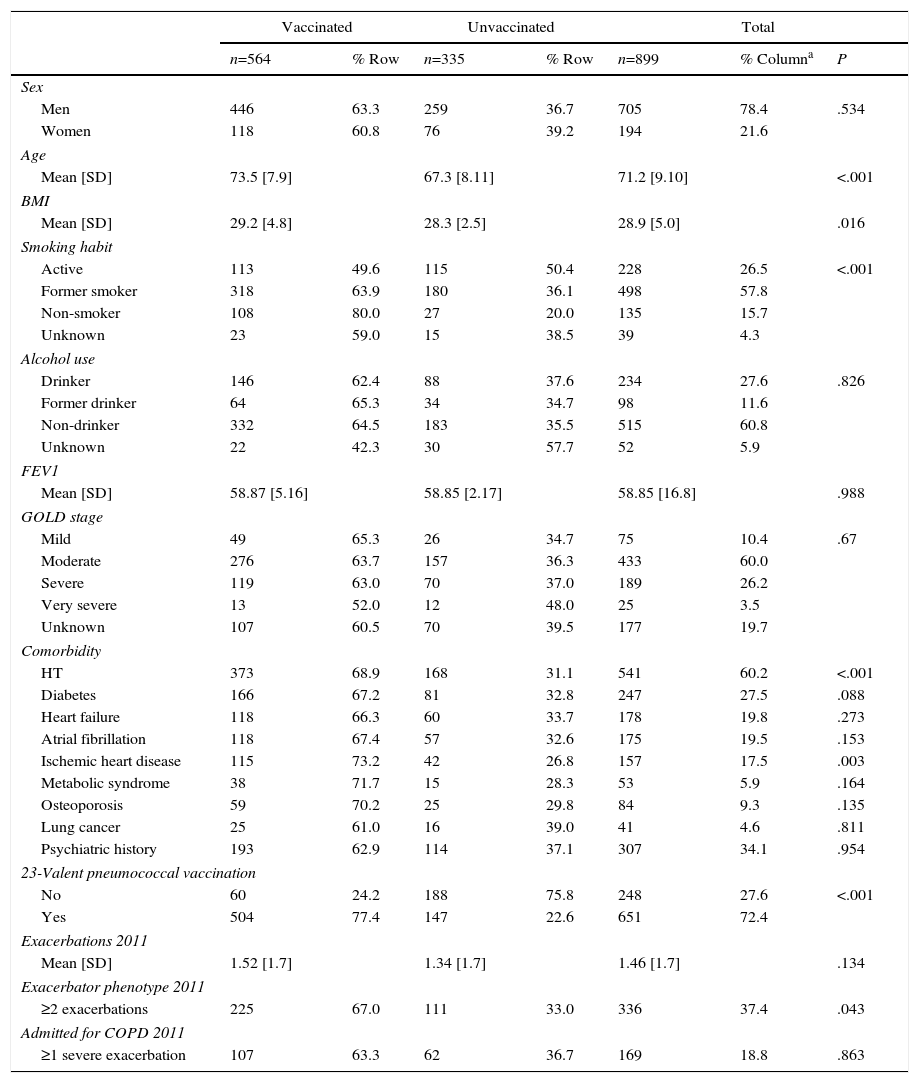
ResultsTable 1 shows influenza vaccination prevalence in the 2011–2012 campaign, by principal clinical and sociodemographic characteristics.
Influenza Vaccination Prevalence During the 2011/2012 Campaign, by Principal Clinical and Sociodemographic Features.
| Vaccinated | Unvaccinated | Total | |||||
|---|---|---|---|---|---|---|---|
| n=564 | % Row | n=335 | % Row | n=899 | % Columna | P | |
| Sex | |||||||
| Men | 446 | 63.3 | 259 | 36.7 | 705 | 78.4 | .534 |
| Women | 118 | 60.8 | 76 | 39.2 | 194 | 21.6 | |
| Age | |||||||
| Mean [SD] | 73.5 [7.9] | 67.3 [8.11] | 71.2 [9.10] | <.001 | |||
| BMI | |||||||
| Mean [SD] | 29.2 [4.8] | 28.3 [2.5] | 28.9 [5.0] | .016 | |||
| Smoking habit | |||||||
| Active | 113 | 49.6 | 115 | 50.4 | 228 | 26.5 | <.001 |
| Former smoker | 318 | 63.9 | 180 | 36.1 | 498 | 57.8 | |
| Non-smoker | 108 | 80.0 | 27 | 20.0 | 135 | 15.7 | |
| Unknown | 23 | 59.0 | 15 | 38.5 | 39 | 4.3 | |
| Alcohol use | |||||||
| Drinker | 146 | 62.4 | 88 | 37.6 | 234 | 27.6 | .826 |
| Former drinker | 64 | 65.3 | 34 | 34.7 | 98 | 11.6 | |
| Non-drinker | 332 | 64.5 | 183 | 35.5 | 515 | 60.8 | |
| Unknown | 22 | 42.3 | 30 | 57.7 | 52 | 5.9 | |
| FEV1 | |||||||
| Mean [SD] | 58.87 [5.16] | 58.85 [2.17] | 58.85 [16.8] | .988 | |||
| GOLD stage | |||||||
| Mild | 49 | 65.3 | 26 | 34.7 | 75 | 10.4 | .67 |
| Moderate | 276 | 63.7 | 157 | 36.3 | 433 | 60.0 | |
| Severe | 119 | 63.0 | 70 | 37.0 | 189 | 26.2 | |
| Very severe | 13 | 52.0 | 12 | 48.0 | 25 | 3.5 | |
| Unknown | 107 | 60.5 | 70 | 39.5 | 177 | 19.7 | |
| Comorbidity | |||||||
| HT | 373 | 68.9 | 168 | 31.1 | 541 | 60.2 | <.001 |
| Diabetes | 166 | 67.2 | 81 | 32.8 | 247 | 27.5 | .088 |
| Heart failure | 118 | 66.3 | 60 | 33.7 | 178 | 19.8 | .273 |
| Atrial fibrillation | 118 | 67.4 | 57 | 32.6 | 175 | 19.5 | .153 |
| Ischemic heart disease | 115 | 73.2 | 42 | 26.8 | 157 | 17.5 | .003 |
| Metabolic syndrome | 38 | 71.7 | 15 | 28.3 | 53 | 5.9 | .164 |
| Osteoporosis | 59 | 70.2 | 25 | 29.8 | 84 | 9.3 | .135 |
| Lung cancer | 25 | 61.0 | 16 | 39.0 | 41 | 4.6 | .811 |
| Psychiatric history | 193 | 62.9 | 114 | 37.1 | 307 | 34.1 | .954 |
| 23-Valent pneumococcal vaccination | |||||||
| No | 60 | 24.2 | 188 | 75.8 | 248 | 27.6 | <.001 |
| Yes | 504 | 77.4 | 147 | 22.6 | 651 | 72.4 | |
| Exacerbations 2011 | |||||||
| Mean [SD] | 1.52 [1.7] | 1.34 [1.7] | 1.46 [1.7] | .134 | |||
| Exacerbator phenotype 2011 | |||||||
| ≥2 exacerbations | 225 | 67.0 | 111 | 33.0 | 336 | 37.4 | .043 |
| Admitted for COPD 2011 | |||||||
| ≥1 severe exacerbation | 107 | 63.3 | 62 | 36.7 | 169 | 18.8 | .863 |
SD, standard deviation.
In total, 21.6% of cases were women. The overall mean age was 71.2 years (SD=10.9). A total of 15.7% of confirmed COPD cases were non-smokers. With respect to COPD severity, in descending order, the majority of patients (60%) had moderate COPD, 26.2% had severe disease, 10.4% mild, and 3.5% very severe COPD.
Overall prevalence of vaccination was 62.7% (565/899). This vaccination prevalence was slightly higher in patients with mild COPD (65.3%) (49/75), falling as COPD severity advanced: moderate (63.7%) (276/433), severe (63.0%) (119/189), very severe (52.0%) (13/25), although these differences did not reach statistical significance (P=.67).
The rate of influenza vaccination was similar in men and women. More elderly patients were vaccinated, and vaccinated subjects were older by a mean of 6.2 years (P<.001). Eighty percent of non-smokers were vaccinated. A smaller proportion of ex-smokers was vaccinated (63.9%), while active smokers formed the group which was least vaccinated (49.6%) (P<.001). The presence of comorbidities was associated with higher influenza vaccination rates. Patients with a history of more COPD exacerbations during 2011 were vaccinated to a greater extent (P=.043). A greater percentage of patients with a history of 23-valent pneumococcal vaccine received the influenza vaccine (P<.001).
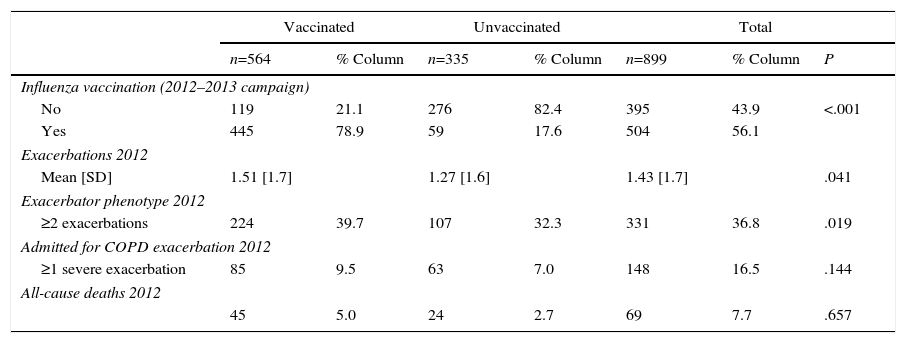
Table 2 shows a descriptive analysis of the primary follow-up variables during 2012, by history of influenza vaccination during the 2011–2012 campaign. A higher proportion of patients vaccinated against influenza in the 2011–2012 campaign were vaccinated in the following campaign (2012–2013) (P<.001).
Primary Follow-up Variables in 2012, by Influenza Vaccination History During the 2011–2012 Campaign.
| Vaccinated | Unvaccinated | Total | |||||
|---|---|---|---|---|---|---|---|
| n=564 | % Column | n=335 | % Column | n=899 | % Column | P | |
| Influenza vaccination (2012–2013 campaign) | |||||||
| No | 119 | 21.1 | 276 | 82.4 | 395 | 43.9 | <.001 |
| Yes | 445 | 78.9 | 59 | 17.6 | 504 | 56.1 | |
| Exacerbations 2012 | |||||||
| Mean [SD] | 1.51 [1.7] | 1.27 [1.6] | 1.43 [1.7] | .041 | |||
| Exacerbator phenotype 2012 | |||||||
| ≥2 exacerbations | 224 | 39.7 | 107 | 32.3 | 331 | 36.8 | .019 |
| Admitted for COPD exacerbation 2012 | |||||||
| ≥1 severe exacerbation | 85 | 9.5 | 63 | 7.0 | 148 | 16.5 | .144 |
| All-cause deaths 2012 | |||||||
| 45 | 5.0 | 24 | 2.7 | 69 | 7.7 | .657 | |
COPD, chronic obstructive pulmonary disease; SD, standard deviation.
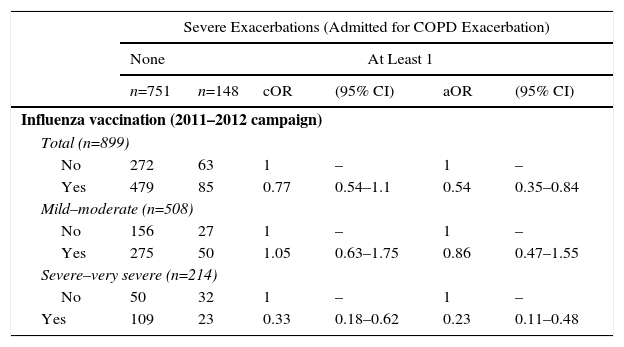
Table 3 shows the crude and adjusted measures of association of a history of influenza vaccination in the 2011–2012 campaign with the risk of admission due to COPD exacerbation in the following year (2012). Influenza vaccination in the 2011–2012 campaign had a statistically significantly protective effect against the risk of severe exacerbations (admission due to COPD exacerbation) in the following year: aOR: 0.54 (95% CI; 0.35–0.84); PFe-adjusted: 0.46 (95% CI: 0.16–0.65) (Table 3).
Crude and Adjusted Measures of Association of History of Influenza Vaccination With Risk of “Admission due to Copd Exacerbation” in Patients With Confirmed COPD.
| Severe Exacerbations (Admitted for COPD Exacerbation) | ||||||
|---|---|---|---|---|---|---|
| None | At Least 1 | |||||
| n=751 | n=148 | cOR | (95% CI) | aOR | (95% CI) | |
| Influenza vaccination (2011–2012 campaign) | ||||||
| Total (n=899) | ||||||
| No | 272 | 63 | 1 | – | 1 | – |
| Yes | 479 | 85 | 0.77 | 0.54–1.1 | 0.54 | 0.35–0.84 |
| Mild–moderate (n=508) | ||||||
| No | 156 | 27 | 1 | – | 1 | – |
| Yes | 275 | 50 | 1.05 | 0.63–1.75 | 0.86 | 0.47–1.55 |
| Severe–very severe (n=214) | ||||||
| No | 50 | 32 | 1 | – | 1 | – |
| Yes | 109 | 23 | 0.33 | 0.18–0.62 | 0.23 | 0.11–0.48 |
aOR: odds ratio adjusted for age (continuous variable), sex, smoking habit (ordinal variable: non-smoker, former smoker, current smoker), and a propensity score which included: COPD severity (GOLD stages 1–4), frequency and severity of exacerbations the previous year and presence of comorbidities (diabetes mellitus and heart failure); COPD, chronic obstructive pulmonary disease; cOR: crude odds ratio.
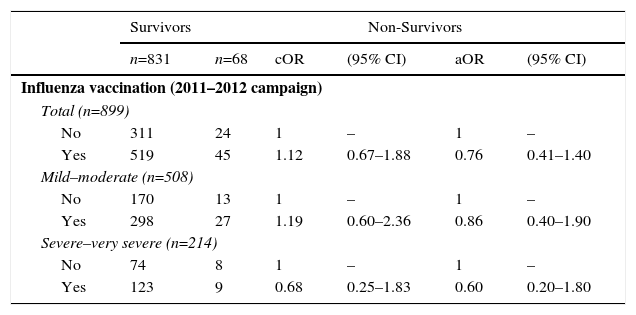
With regard to the risk of mortality, influenza vaccination in the 2011–2012 campaign was associated with a small adjusted risk of all-cause death the following year, but this did not reach statistical significance: aOR: 0.76 (95% CI: 0.41–1.40) (Table 4).
Crude and Adjusted Measurements of Association of History of Influenza Vaccination With Risk of All-Cause Death the Following Year (2012) in Patients With Confirmed COPD.
| Survivors | Non-Survivors | |||||
|---|---|---|---|---|---|---|
| n=831 | n=68 | cOR | (95% CI) | aOR | (95% CI) | |
| Influenza vaccination (2011–2012 campaign) | ||||||
| Total (n=899) | ||||||
| No | 311 | 24 | 1 | – | 1 | – |
| Yes | 519 | 45 | 1.12 | 0.67–1.88 | 0.76 | 0.41–1.40 |
| Mild–moderate (n=508) | ||||||
| No | 170 | 13 | 1 | – | 1 | – |
| Yes | 298 | 27 | 1.19 | 0.60–2.36 | 0.86 | 0.40–1.90 |
| Severe–very severe (n=214) | ||||||
| No | 74 | 8 | 1 | – | 1 | – |
| Yes | 123 | 9 | 0.68 | 0.25–1.83 | 0.60 | 0.20–1.80 |
aOR: odds ratio adjusted for age (continuous variable), sex, smoking habit (categorical variable: non-smoker, former smoker, current smoker), and a propensity score which included: COPD severity (GOLD stages 1–4), frequency and severity of exacerbations the previous year and presence of comorbidities (diabetes mellitus and heart failure); COPD, chronic obstructive pulmonary disease; cOR: crude odds ratio.
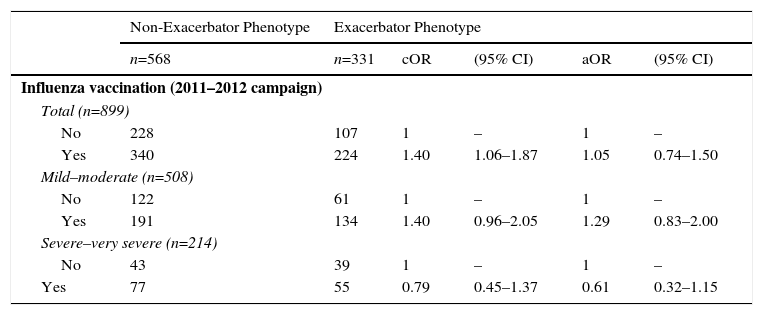
With regard to the risk of being an exacerbator phenotype, influenza vaccination showed a positive crude association which disappeared after adjustment in multivariate models: influenza vaccination aOR (2011–2012 campaign): 1.05 (Table 5).
Crude and Adjusted Measurements of Association of History of Influenza Vaccination With Risk of Exacerbator Phenotype the Following Year (2012) in Patients With Confirmed COPD.
| Non-Exacerbator Phenotype | Exacerbator Phenotype | |||||
|---|---|---|---|---|---|---|
| n=568 | n=331 | cOR | (95% CI) | aOR | (95% CI) | |
| Influenza vaccination (2011–2012 campaign) | ||||||
| Total (n=899) | ||||||
| No | 228 | 107 | 1 | – | 1 | – |
| Yes | 340 | 224 | 1.40 | 1.06–1.87 | 1.05 | 0.74–1.50 |
| Mild–moderate (n=508) | ||||||
| No | 122 | 61 | 1 | – | 1 | – |
| Yes | 191 | 134 | 1.40 | 0.96–2.05 | 1.29 | 0.83–2.00 |
| Severe–very severe (n=214) | ||||||
| No | 43 | 39 | 1 | – | 1 | – |
| Yes | 77 | 55 | 0.79 | 0.45–1.37 | 0.61 | 0.32–1.15 |
aOR: odds ratio adjusted for age (continuous variable), sex, smoking habit (categorical variable: non-smoker, former smoker, current smoker), and a propensity score which included: COPD severity (GOLD stages 1–4), frequency and severity of exacerbations the previous year and presence of comorbidities (diabetes mellitus and heart failure); COPD, chronic obstructive pulmonary disease; cOR: crude odds ratio.
When stratified for COPD severity according to FEV1 (mild and moderate COPD versus severe and very severe COPD; GOLD stages 1 and 2 versus 3 and 4), influenza vaccination in the 2011–2012 campaign showed a greater protective effect for the risk of admission for COPD exacerbations (severe exacerbations) in the more severe COPD stages: aOR: 0.23 (95% CI: 0.11–0.48); PFe-adjusted: 0.77 (95% CI: 0.52–0.89). The greater protective effect for vaccination in the more severe forms of COPD was less apparent for the risk of all-cause death and for the risk of being an exacerbator phenotype the following year (Tables 3–5).
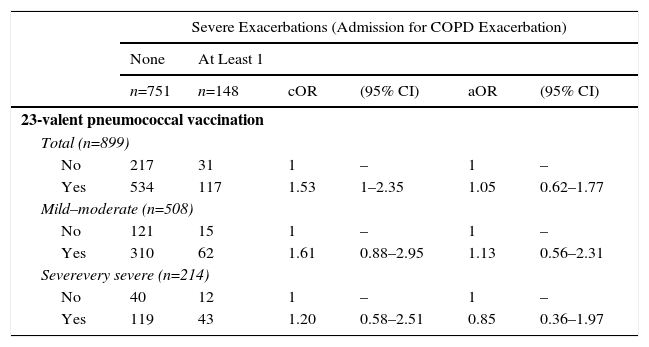
Pneumonia vaccination (23-valent pneumococcal) did not show any significant protective effect, either for severe exacerbations, all-cause death, or the risk of being an exacerbator phenotype (Table 6).
Crude and Adjusted Measurements of Association of History of Influenza Vaccination With Risk of Admission due to Copd Exacerbation the Following Year (2012) in Patients With Confirmed COPD.
| Severe Exacerbations (Admission for COPD Exacerbation) | ||||||
|---|---|---|---|---|---|---|
| None | At Least 1 | |||||
| n=751 | n=148 | cOR | (95% CI) | aOR | (95% CI) | |
| 23-valent pneumococcal vaccination | ||||||
| Total (n=899) | ||||||
| No | 217 | 31 | 1 | – | 1 | – |
| Yes | 534 | 117 | 1.53 | 1–2.35 | 1.05 | 0.62–1.77 |
| Mild–moderate (n=508) | ||||||
| No | 121 | 15 | 1 | – | 1 | – |
| Yes | 310 | 62 | 1.61 | 0.88–2.95 | 1.13 | 0.56–2.31 |
| Severevery severe (n=214) | ||||||
| No | 40 | 12 | 1 | – | 1 | – |
| Yes | 119 | 43 | 1.20 | 0.58–2.51 | 0.85 | 0.36–1.97 |
| Severe Exacerbations (Admission for COPD Exacerbation) | ||||||
|---|---|---|---|---|---|---|
| Survivors | Non-Survivors | |||||
| n=831 | n=68 | cOR | (95% CI) | aOR | (95% CI) | |
| 23-valent pneumococcal vaccination | ||||||
| Total (n=899) | ||||||
| No | 235 | 13 | 1 | – | 1 | – |
| Yes | 595 | 56 | 1.7 | 0.91–3.17 | 1.10 | 0.50–2.42 |
| Mild–moderate (n=508) | ||||||
| No | 128 | 8 | 1 | – | 1 | – |
| Yes | 340 | 32 | 1.51 | 0.68–3.35 | 0.91 | 0.35–2.35 |
| Severe–very severe (n=214) | ||||||
| No | 50 | 2 | 1 | – | 1 | – |
| Yes | 147 | 15 | 2.55 | 0.56–11.55 | 1.61 | 0.32–8.14 |
| Severe Exacerbations (Admission for COPD Exacerbation) | ||||||
|---|---|---|---|---|---|---|
| Non-exacerbator phenotype | Exacerbator phenotype | |||||
| n=568 | n=331 | cOR | (95% CI) | aOR | (95% CI) | |
| 23-valent pneumococcal vaccination | ||||||
| Total (n=899) | ||||||
| No | 174 | 74 | 1 | – | 1 | – |
| Yes | 394 | 257 | 1.53 | 1.12–2.1 | 1.00 | 0.67–1.48 |
| Mild–moderate (n=508) | ||||||
| No | 94 | 42 | 1 | – | 1 | – |
| Yes | 219 | 153 | 1.56 | 1.03–2.38 | 1.16 | 0.71–1.89 |
| Severe–very severe (n=214) | ||||||
| No | 29 | 23 | 1 | – | 1 | – |
| Yes | 91 | 71 | 0.98 | 0.52–1.85 | 0.64 | 0.30–1.36 |
aOR: odds ratio adjusted for age (continuous variable), sex, smoking habit (categorical variable: non-smoker, former smoker, current smoker), and a propensity score which included: COPD severity (GOLD stages 1–4), frequency and severity of exacerbations the previous year and presence of comorbidities (diabetes mellitus and heart failure); COPD, chronic obstructive pulmonary disease; cOR: crude odds ratio.
The overall prevalence of influenza vaccination in the 2011–2012 campaign was 62.7%. Our results suggest that influenza vaccination has a protective effect on the specific risk of severe exacerbations (admission for COPD exacerbation) in the following year, with a PFe-adjusted of 50%. Our results suggest, then, that if 335 patients who were not vaccinated in the 2011–2012 campaign had been vaccinated, approximately 50% of the admissions for COPD exacerbations would have been avoided (between 30 and 31 admissions).21
The evidence obtained from 6 clinical trials identified in the latest Cochrane review in COPD patients, published in 2006,8 suggested a reduction in the risk of hospitalization that supported the results of the early large cohort studies, such as that of Nichol et al.7 More recent results from prospective series, such as that of Seo et al.12 would also support these results, although these authors also included admission for cardiac pathology (ischemic heart disease) as a variable of response, in addition to admissions for respiratory pathology. Moreover, studies with a paired data design, such as that of Menon et al.,9 which compared the incidence of various events before and after vaccination, have also shown a protective effect on the risk of admissions.
In Spain, a recent retrospective cohort study in the Basic Healthcare Area of Mollerussa (Lleida),13 based on computerized clinical records, found a higher protective effect: aOR: 0.09 (95% CI: 0.05–0.17), with PFe-adjusted of 90.8% (95% CI: 83.5–94.8%). However, this study only included patients hospitalized for COPD exacerbation between December 1, 2011 and March 15, 2012 in the cohorts of subjects vaccinated and unvaccinated during the 2011–2012 campaign.
In our study, the protective effect of influenza vaccination was greater in patients with a more severe COPD pattern, based on FEV1: this phenomenon has also been described by other authors of observational studies9,13 and clinical trials.22
Our findings on the effect of influenza and pneumococcal vaccine on all-cause death, while not reaching statistical significance, support the results of the study published by Schembri et al.,11 who reported a protective effect for influenza vaccination, but not for pneumococcal vaccination. In Spain, a prospective cohort study published in COPD patients over the age of 65 years also found a non-significant protective effect: adjusted hazard ratio (HR): 0.76 (95% CI: 0.52–1.06).10
Finally, influenza vaccination did not appear to have a protective effect on the risk of being an exacerbator phenotype the following year (2012). These results are supported by the findings of the cohort study by Ting et al.,23 who found no significant differences in the overall number of exacerbations, after pairing for sex, age, COPD severity, and comorbidities.
Although our findings have shown the protective effect of influenza vaccination on the risk of severe exacerbations and mortality, prevalence was suboptimal. This coincides with the suboptimal prevalences generally reported in developed countries,4,5 including Spain.13 Our results also support the hypothetical existence of a group of patients that tends to get vaccinated (79% of those who were vaccinated in 2011 were also vaccinated in 2012), and another group that tends to reject vaccination (82% of those who were not vaccinated in 2011 were also not vaccinated in 2012). Rejection among these patients has been attributed to fear of exacerbations or adverse reactions caused by the vaccine itself, which may explain the greater rejection rates among patients with more severe disease according to FEV1 results among our sample.4,13,23 Nevertheless, the safety of the vaccine is supported by authors such as Tata et al.24 or Ting et al.23 who have ruled out a greater incidence of exacerbation in the early weeks after vaccination.
In our study, we found that patients with a higher comorbidity burden have a greater tendency to get vaccinated, a finding echoed by other authors.13,25 It should also be pointed out that uptake of vaccination among smokers is less than among non-smokers, also reported in other studies.13,26,27
The vaccine strains of the 2011–2012 season were a good match for the circulating H1N1 virus, a moderate match for H3N2 (predominant along with H1N1) and a poor match for the group B strain (that was more common in other countries). Influenza activity in Spain in the 2011–2012 season was considered moderate. It began to escalate in week 50/2011, and reached peak influenza incidence in week 7/2012 (13–19 February); pre-epidemic rates were re-established after week 11/2012.28,29 The 2012–2013 season came later, beginning to escalate in 2/2013, and reaching its peak in week 8/2013.30 Several studies have used hospital admission in only the months of maximum influenza activity as the dependent variable (or outcome), arguing that this would be the period of greatest risk for admission due to influenza virus. These studies have shown greater benefits for vaccination.13 One of the limitations of our study is that admissions during 2012 were included, but the date of admission was not recorded, so we could not perform a sensitivity analysis limited to the first months of 2012. However, since these studies have shown greater benefits for vaccination, we believe our results to be conservative.31 Moreover, the fact that the influenza incidence returned to pre-epidemic values after week 11/12 does not mean that the influenza activity was absent, rather that it was below the baseline limit, which, in the case of the 2011–2012 season, was 4.21 times lower than the rate at the peak of the epidemic.
Another limitation is the small sample size of patients with more severe GOLD stage disease (n=25). This is a result of our simple randomized sampling, which provided a representative population sample as regards COPD severity.
One of the strengths of our study is that the comparative group comprised unvaccinated COPD patients randomly selected from the same basic population. This is an advantage over other studies which used other comparative groups (general population, etc.) or which were limited to older populations (>65 years). However, all these methodological deficiencies would tend to underestimate the benefits of vaccination.32–35
Another advantage of our study is that confounding factors were controlled. It has been suggested that patients vaccinated against influenza might also have received the 23-valent pneumococcal vaccine, and this may act as another confounding variable.2 We were able to obtain information on this variable in all of our patients and could rule out any confounding effect.
In conclusion, the results of this study, along with the available evidence, support the protective effect of influenza vaccination in the risk of admission for COPD exacerbation the following year. Despite the evidence for a protective effect, overall prevalence of influenza vaccination was suboptimal, particularly in patients with more severe stages of COPD.
FundingThis study received no funding from private industry or from public grants.
AuthorshipMS, RG, JMH, SA, JLGR and JL designed the study. MS, RG and JL performed the statistical analysis. MS wrote the manuscript. RG, JMH, MR, SA, CB and CL contributed to data acquisition, analysis, and interpretation of results, performed a critical review of the manuscript and provided intellectual input, and gave their final approval for publication. JLGR and JL supervised the analysis, contributed to the preparation and edition of the manuscript, and gave their final approval for publication.
Conflict of InterestsDr. García Rivero has received fees for scientific consultancy and/or speaking engagements from Almirall, Boehringer Ingelheim, Pfizer, Astra Zeneca, Chiesi, GlaxoSmithKline, Menarini, Takeda, Teva, Ferrer, and Novartis. Dr. Helguera has received speakers’ fees from GlaxoSmithKline, Boehringer, Novartis, Mundipharma, and Astra Zeneca. Dr. Bonnardeaux has received speaker's fees from GlaxoSmithKline, Boehringer, Ferrer, Astra Zeneca, Teva, and Chiesi. The other authors state that they have no conflict of interests.
We would like to thank the Cantabrian Health Service for their support and practical help.
Please cite this article as: Garrastazu R, García-Rivero JL, Ruiz M, Helguera JM, Arenal S, Bonnardeux C, et al. Prevalencia de vacunación antigripal en pacientes con enfermedad pulmonar obstructiva crónica e impacto en el riesgo de agudizaciones graves. Arch Bronconeumol. 2016;52:88–95.


