


Field tests are commonly used as complements of cardiopulmonary exercise test (CPET) to evaluate the functional exercise capacity. The aims of this study were to validate the one-minute sit-to-stand test (STST) in congenital heart disease (CHD) children and to evaluate the possibility of predicting the peakVO2 using the STST in this paediatric population.
MethodsChildren (8- to 18-year-old) followed for a CHD and performing CPET were recruited prospectively. Concomitantly, they performed STST. The heart rate (HR), oxygen saturation (SpO2), muscular fatigue and dyspnoea were recorded before (t0), immediately after (t1) and 1min after the end of the STST (t2).
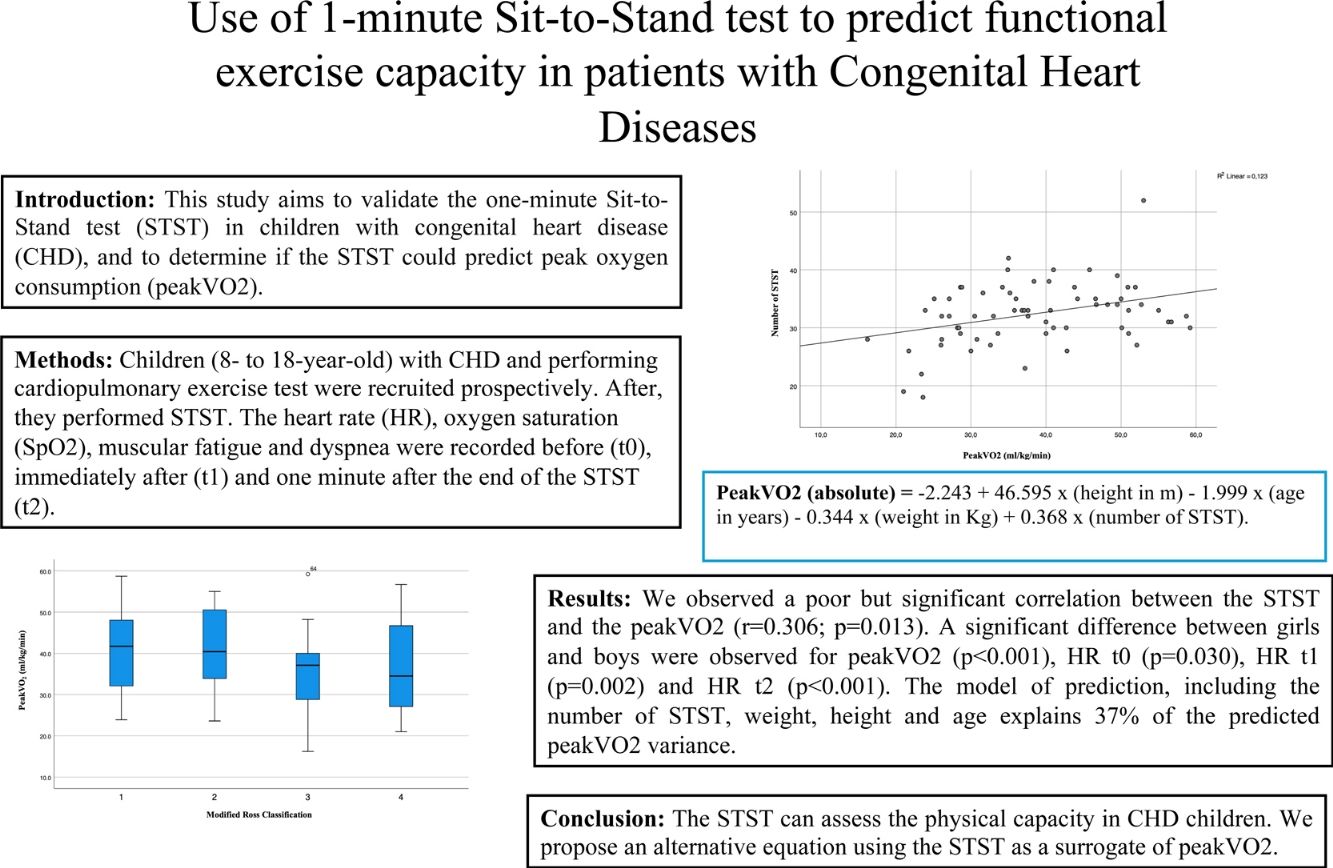
ResultsWe observed a poor but significant correlation between the STST and the peakVO2 (r=0.306; p=0.013). A significant difference between girls and boys were observed for peakVO2 (p<0.001), HR t0 (p=0.030), HR t1 (p=0.002) and HR t2 (p<0.001). The proposed model of prediction, including the number of STST, weight, height and age explains 37% of the predicted peakVO2 variance.
ConclusionThe STST can provide relevant data on physical capacity in children with CHD. When CPET cannot be performed, we therefore propose an alternative equation using the STST as a surrogate of peakVO2 in CHD children.

Maximal or peak oxygen uptake (peakVO2 or VO2max) reflects the body's maximal capacity to generate energy through aerobic metabolism.1 It represents maximal aerobic capacity, and its measurement is used to appraise health and performance as well as develop exercise prescriptions.2 In a medical setting, the measurement of this peakVO2 explores cardiac, respiratory and muscular functions.3
The cardiorespiratory data are relevant health indicators in children with heart diseases.4 The peakVO2 such as other parameters (i.e. blood pressure, anaerobic threshold, heart rate, oxygen saturation, lung function) is measured during a cardiopulmonary exercise test (CPET). The CPET provides in children with congenital heart disease (CHD) important information for diagnostic, prognostic and evaluation of the effects of a therapeutic intervention.3,4 Moreover, the peakVO2 is an indicator of physical performance and allows optimizing the prescription of exercises and revalidation in cardiac patients.5
The CPET is performed on a cycloergometer or a treadmill. The volumes of inspired and expired gas are analyzed during the test and compared with the available normal data.3,5,6 Unfortunately, this test is expensive and time-consuming test, and not always available because it requires specific equipment and a qualified team. Alternatives to estimate the physical performance are the sub-maximal fields tests such as the six minutes walk test (6MWT)7 or incremental shuttle walking test (ISWT).8 Moreover, the peakVO2 was correlated to the walked distance in the 6MWT7,9 as well as the ISWT8 in healthy children and adolescents. These tests offer a simplest way to obtain a good estimate of the peakVO2.
Unfortunately, the 6MWT and the ISWT both require time and space. Then, they are not always realistic approaches in the routine follow-up for practical reasons. The one-minute sit-to-stand test (STST) however is easy to implement and has been validated in adults with respiratory disease as an alternative to 6MWT.10,11 It can also be used as complement to CPET (or when it cannot be performed) to estimate the HR response during a sub-maximal exercise in children.12 Our hypothesis is that the STST could also be used to estimate peakVO2 appropriately in children, with CHD.
The primary objective of this study was to validate the STST in CHD children as alternative and complement to CPET. The secondary objective was to verify if the STST repetitions and some descriptive data (i.e. age, weight, height, BMI, gender and CHD severity) can be used to predict the peakVO2 in children with CHD.
MethodsStudy DesignChildren aged between 8 and 18 years, with a CHD diagnosis were prospectively included. All children with an appointment for a CPET in our Paediatric Cardiology Department from May to September 2023 were recruited for this study. The study protocol involved three steps1: their regular appointment with a paediatric cardiologist,2 the CPET, and3 the one-minute sit-to-stand test (STST). Anthropometric data were recorded just before to perform the STST. The experiments were carried out at Cliniques Universitaires Saint-Luc in Brussels. All CHD children with contra-indication(s) to physical activity were excluded.
The study was performed in accordance with the Helsinki declaration and was approved by the institutional medical ethics committee form the Catholic University of Louvain (B403201629869). Before any experiment, the subjects and their parents received a letter explaining the processes of the study and signed the consent form. In addition, the aim of the study and its objective were explained to children and their parents.
CPET ProtocolThe children performed a maximal CPET with a paediatric face mask (Hans Rudolph), a calibrated gas analyser (Oxycon Pro, Jaeger), a breath-to-breath measurements software (Windows 98, Jaeger), a 12-lead ECG monitoring (Cardiosoft, GE Healthcare), a pulse oxymeter (Nellcor), and an automated sphygmomanometer with adapted paediatric cuffs. All CPET were performed on the same treadmill following a standardized modified Bruce protocol4: 1-min rest, 3-min warm-up (1km/h, slope 0%), and then 2-min increments in speed (from 2.5 to 10.5km/h) and slope (from 3 to 18%), and finally a 3-min active recovery (2.5km/h, 0% slope) then 2-min rest. Exercise was pursued until the limit of the child's tolerance was reached, with active verbal encouragements. The following variables were measured: oxygen uptake (VO2; ml/kg/min), carbon dioxide production (VCO2; ml/kg/min), respiratory exchange ratio (RER=VCO2/VO2), minute ventilation (VE; breaths/min), ventilatory equivalent for oxygen (VE/VO2), ventilatory equivalent for carbon dioxide (VE/VCO2), dead space-to-tidal volume ratio (VD/VT), heart rate (HR; beats per minute – bpm), maximum workload (Watts and METS), and oxygen pulse (VO2/HR; ml). From all performed CPET, the investigator manually established the peak oxygen uptake (peakVO2), the ventilatory anaerobic threshold (AT) using Beaver's method,13 the ventilation efficiency (VE/VCO2 slope with VE=slope×VCO2+b), and the oxygen uptake efficiency slope (OUES with VO2=OUES×log10 VE+b).14–16 The VO2max and AT were normalized in percentage of predicted peak VO2 using normal values published by Wasserman and Cooper.17–19
STST ProtocolFor a reproductible protocol, the child should sit on a chair with his or her back firmly on the back and then stand up with full extension of the legs. This “sit-to-stand” must be complete. The child must repeat this movement as often as possible over a period of 1min. Throughout the experience, the child must keep his arms crossed on his chest. The height of the chair was 37cm for the short (<135cm) children (S) and 46cm for the tall children (T).
Before the experiment, a demonstration was performed in front of the child to make sure she/he had a full understanding of the test.
Evaluation and OutcomesThe same senior qualified physiotherapist (NMM) performed all the data collection and STST. An experienced paediatric cardiologist performed the CPET. Anthropometric data and CHD characteristics were collected from the medical records of the patients. The heart rate (HR) and the pulsed oxygen saturation (SpO2) were measured three times with a pulse oxymeter (NONIN Onyx): before and at the end of the test and after 1min of recovery. The difference between initial and final values (DeltaHR and DeltaSpO2) was calculated in the STST. The dyspnoea and muscular fatigue were quantified using the visual analogue scale (VAS) graduated from 0 to 10 (0=no dyspnoea or muscle fatigue, 10=extreme dyspnoea or maximal muscle fatigue). The collected data from CPET for this study was the peakVO2.
Statistical AnalysisA descriptive analysis was performed for all parameters of the study with SPSS software (27.0). The descriptive data are expressed as mean, standard deviation (SD) and confidence interval (CI). The validity of the STST was verified by the correlation with CPET parameters by Pearson's or Spearman's correlation coefficient.
The Pearson or Spearman correlation coefficients were also calculated to highlight any correlations between peakVO2 and independent variables (age, height, weight, BMI, HR, SpO2 and number of repetitions during STST). The correlation coefficients (r or rho) were characterized as follows: >0.80 was very good, 0.61–0.80 was good, 0.41–0.60 was moderate, 0.21–0.40 was poor and <0.21 was very poor.20 The comparison between girls and boys was made using the unpaired Student test. Multiple linear regression was used to create a peakVO2 regression equation using independent variables as predictor variables. The linear relationship between the independent and dependent variable and the absence of multicollinearity of the independent variables (using variance inflation factor) were verified. The R2 was calculated. In the statistical analysis, the threshold considered “significant” was p<0.05.
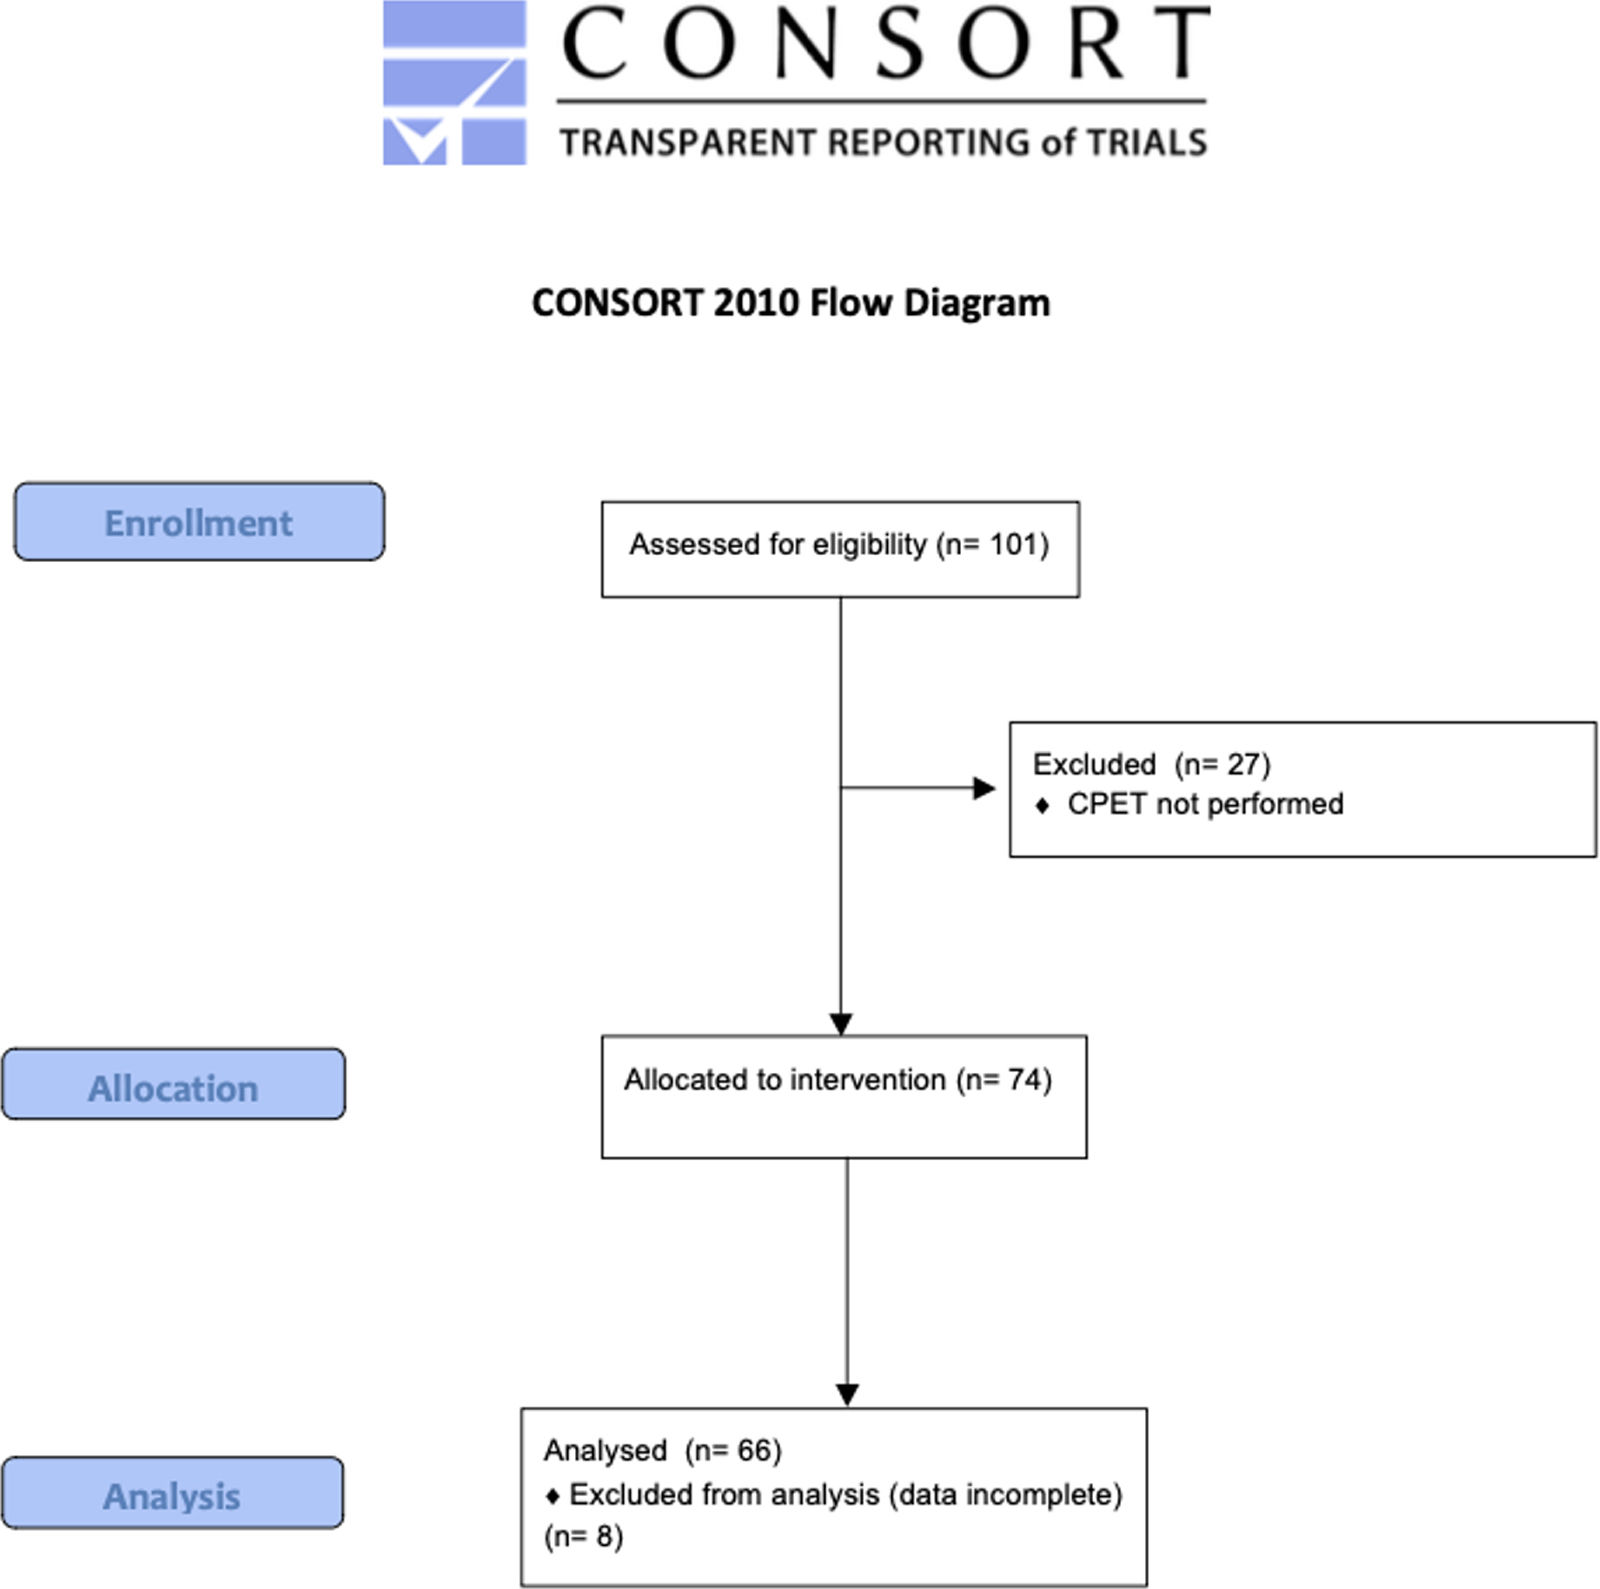
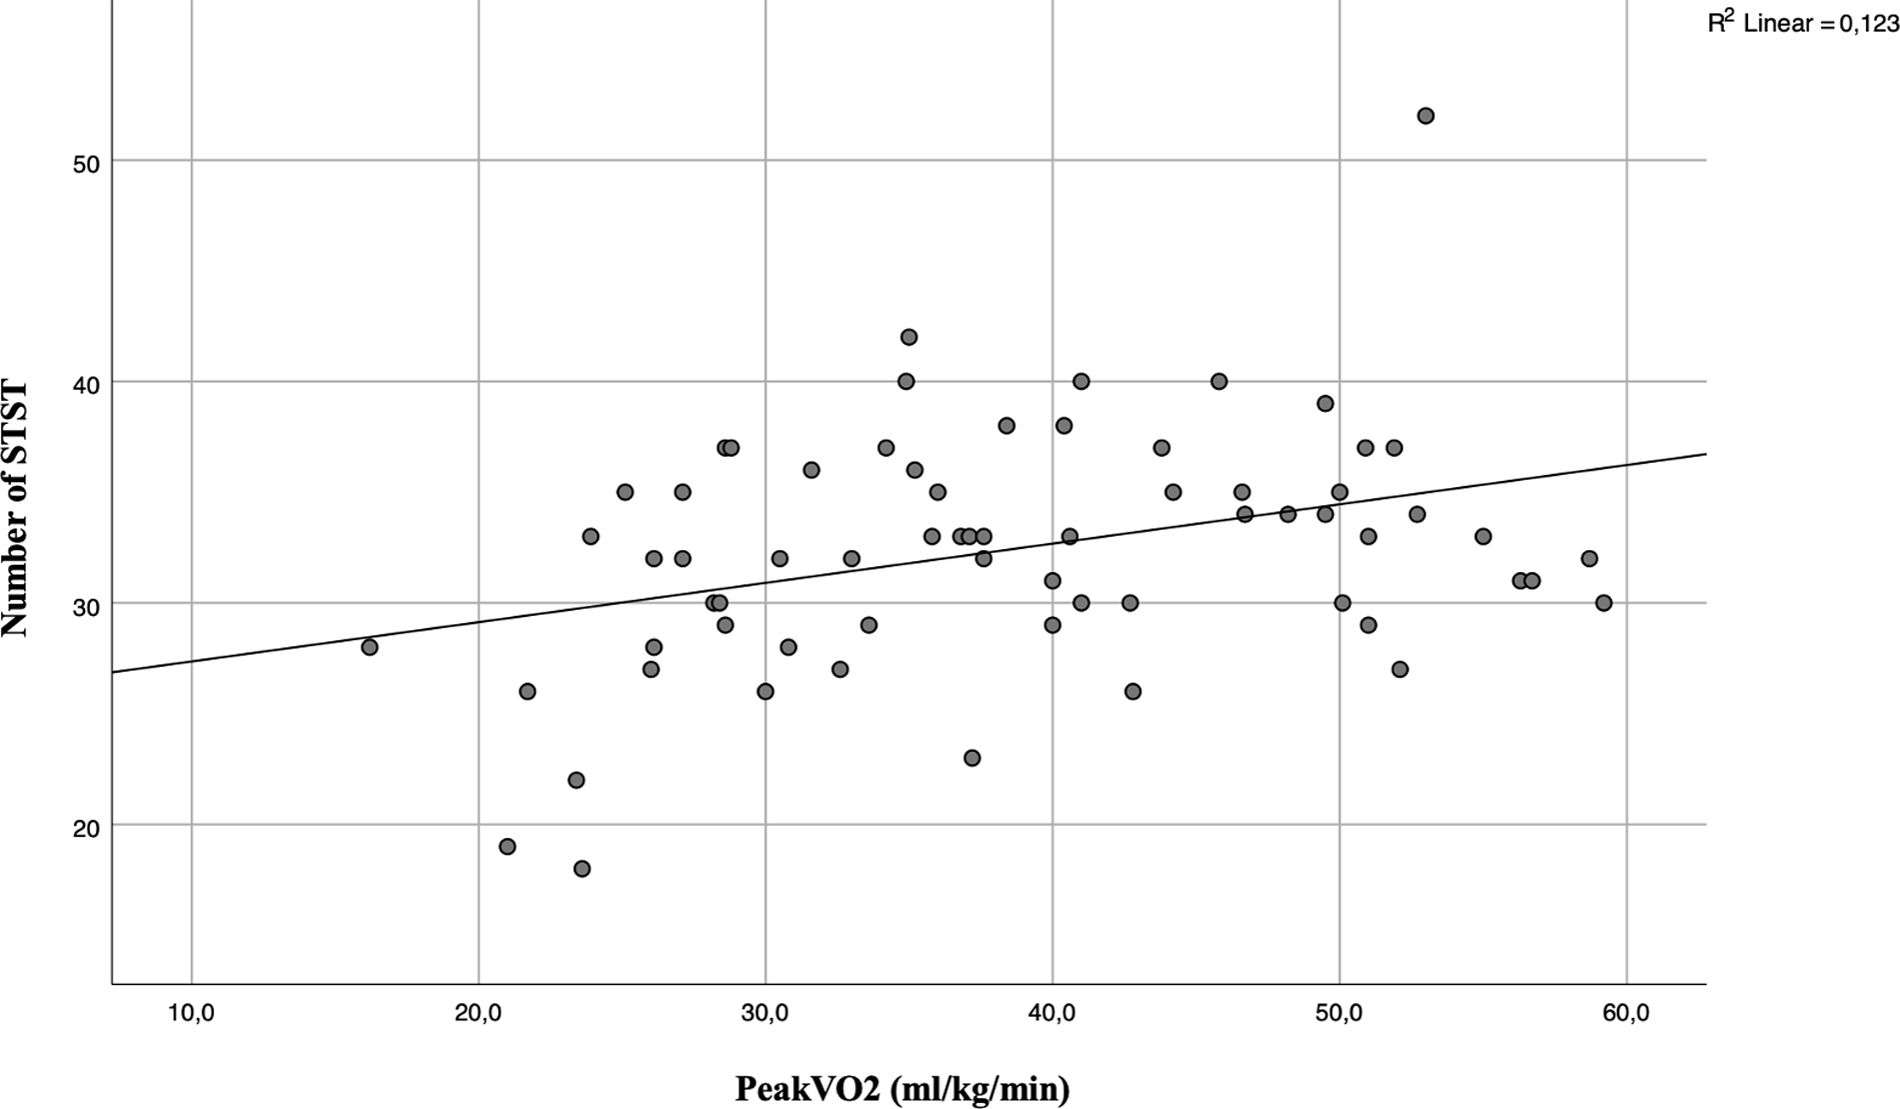
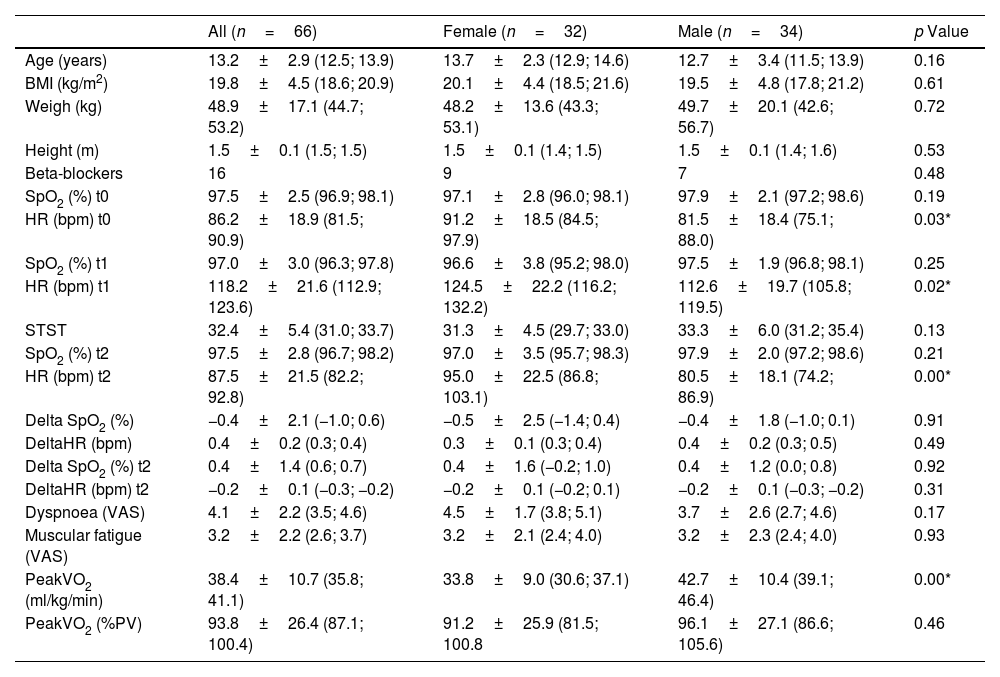
ResultsSixty-six children were recruited (32 girls and 34 boys; Fig. 1). The characteristics of the population and result of data collection are summarized in Table 1. The relative of peakVO2 was in the normal range for most cases (69%), but not severe cases. In our studied population, the mean relative peakVO2 was normal and no significant differences were found between girls and boys (91.2±25.9% vs 96.1±27.1% respectively, p=0.46). We observed a poor but significant correlation between the number of STS and absolute peakVO2 (r=0.306; p=0.013) (Fig. 2) but no correlation with the relative peakVO2 (r=0.168; p=0.184).

Characteristics of the Sample and Descriptive Outcomes.
| All (n=66) | Female (n=32) | Male (n=34) | p Value | |
|---|---|---|---|---|
| Age (years) | 13.2±2.9 (12.5; 13.9) | 13.7±2.3 (12.9; 14.6) | 12.7±3.4 (11.5; 13.9) | 0.16 |
| BMI (kg/m2) | 19.8±4.5 (18.6; 20.9) | 20.1±4.4 (18.5; 21.6) | 19.5±4.8 (17.8; 21.2) | 0.61 |
| Weigh (kg) | 48.9±17.1 (44.7; 53.2) | 48.2±13.6 (43.3; 53.1) | 49.7±20.1 (42.6; 56.7) | 0.72 |
| Height (m) | 1.5±0.1 (1.5; 1.5) | 1.5±0.1 (1.4; 1.5) | 1.5±0.1 (1.4; 1.6) | 0.53 |
| Beta-blockers | 16 | 9 | 7 | 0.48 |
| SpO2 (%) t0 | 97.5±2.5 (96.9; 98.1) | 97.1±2.8 (96.0; 98.1) | 97.9±2.1 (97.2; 98.6) | 0.19 |
| HR (bpm) t0 | 86.2±18.9 (81.5; 90.9) | 91.2±18.5 (84.5; 97.9) | 81.5±18.4 (75.1; 88.0) | 0.03* |
| SpO2 (%) t1 | 97.0±3.0 (96.3; 97.8) | 96.6±3.8 (95.2; 98.0) | 97.5±1.9 (96.8; 98.1) | 0.25 |
| HR (bpm) t1 | 118.2±21.6 (112.9; 123.6) | 124.5±22.2 (116.2; 132.2) | 112.6±19.7 (105.8; 119.5) | 0.02* |
| STST | 32.4±5.4 (31.0; 33.7) | 31.3±4.5 (29.7; 33.0) | 33.3±6.0 (31.2; 35.4) | 0.13 |
| SpO2 (%) t2 | 97.5±2.8 (96.7; 98.2) | 97.0±3.5 (95.7; 98.3) | 97.9±2.0 (97.2; 98.6) | 0.21 |
| HR (bpm) t2 | 87.5±21.5 (82.2; 92.8) | 95.0±22.5 (86.8; 103.1) | 80.5±18.1 (74.2; 86.9) | 0.00* |
| Delta SpO2 (%) | −0.4±2.1 (−1.0; 0.6) | −0.5±2.5 (−1.4; 0.4) | −0.4±1.8 (−1.0; 0.1) | 0.91 |
| DeltaHR (bpm) | 0.4±0.2 (0.3; 0.4) | 0.3±0.1 (0.3; 0.4) | 0.4±0.2 (0.3; 0.5) | 0.49 |
| Delta SpO2 (%) t2 | 0.4±1.4 (0.6; 0.7) | 0.4±1.6 (−0.2; 1.0) | 0.4±1.2 (0.0; 0.8) | 0.92 |
| DeltaHR (bpm) t2 | −0.2±0.1 (−0.3; −0.2) | −0.2±0.1 (−0.2; 0.1) | −0.2±0.1 (−0.3; −0.2) | 0.31 |
| Dyspnoea (VAS) | 4.1±2.2 (3.5; 4.6) | 4.5±1.7 (3.8; 5.1) | 3.7±2.6 (2.7; 4.6) | 0.17 |
| Muscular fatigue (VAS) | 3.2±2.2 (2.6; 3.7) | 3.2±2.1 (2.4; 4.0) | 3.2±2.3 (2.4; 4.0) | 0.93 |
| PeakVO2 (ml/kg/min) | 38.4±10.7 (35.8; 41.1) | 33.8±9.0 (30.6; 37.1) | 42.7±10.4 (39.1; 46.4) | 0.00* |
| PeakVO2 (%PV) | 93.8±26.4 (87.1; 100.4) | 91.2±25.9 (81.5; 100.8 | 96.1±27.1 (86.6; 105.6) | 0.46 |
BMI: body mass index; SpO2: peripheral capillary oxygen; HR: heart rate; STST: one-minute sit-to-stand test; VAS: visual analogue scale graduated from 0 to 10; peakVO2: maximum oxygen consumption during an exercise; PV: predicted value; *: significant p<0.05; t0: before STST; t1: after STST; t2: 1min after end the STST.

A poor but significant correlation was observed between dyspnoea and muscular fatigue (r=0.277; p=0.024), but no correlation was found between dyspnoea and absolute and relative peakVO2. A negative poor but significant correlation was observed between muscular fatigue and relative peakVO2 (r=−0.292; p=0.019).
A moderate significant correlation was observed between SpO2 at t0 and SpO2 at t2 (r=0.461; p<0.001). Good correlations were observed between HR at t0 and HR at t1 (r=0.629; p<0.001) and at t2 (r=0.786; p<0.001). However, a moderate correlation between HR at t0 and DeltaHR (r=0.488; p<0.001) was observed.
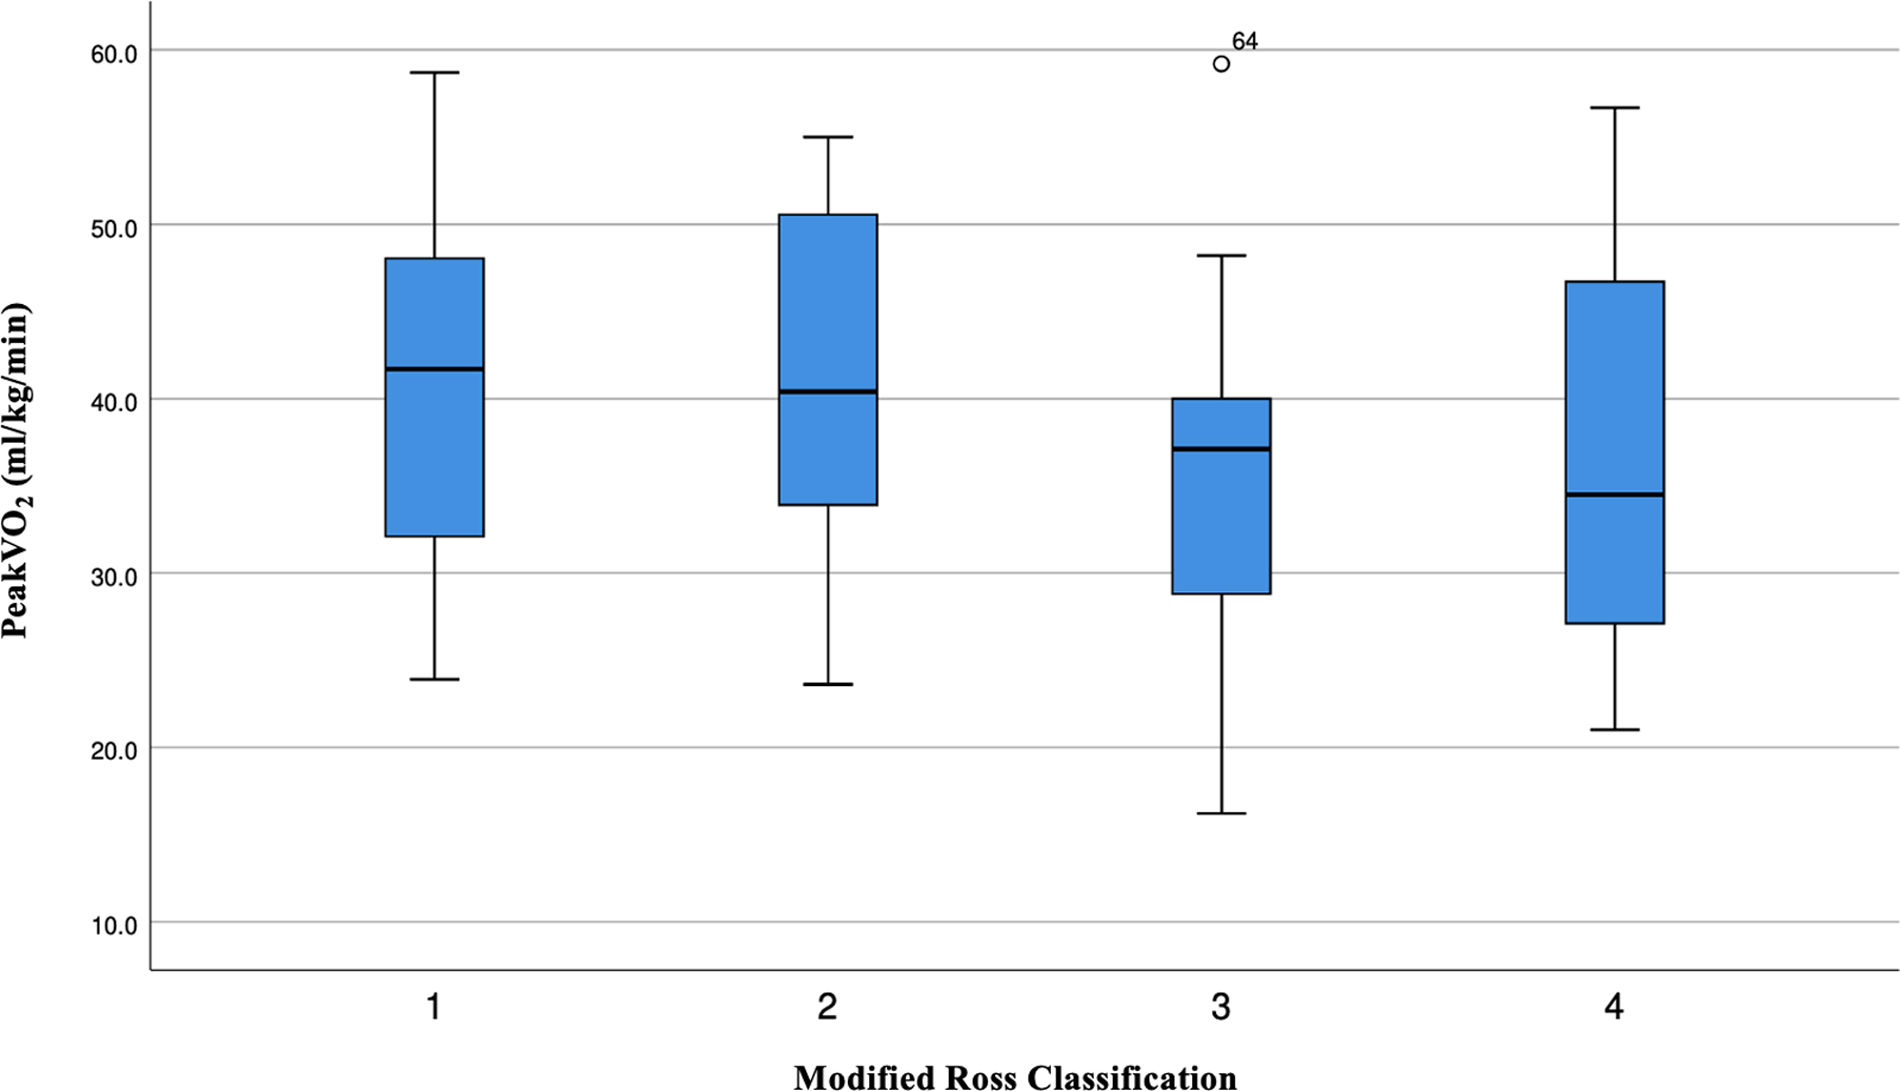
A significant and poor correlation was observed between STST and DeltaHR (r=0.329; p=0.007). As expected, a negative correlation was observed between absolute peakVO2 and age (r=−0.374; p=0.002), weight (r=−0.387; p=0.001) and height (r=−0.219; p=0.077). We also observed a lower absolute peakVO2 in the most severe patients (Fig. 3).

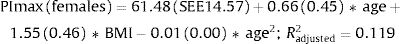
The best predictive model selected for peakVO2 in CHD children includes the age (years), the weight (kg), the height (m) and the number of STS repetitions (Table 2). There was a linear dependence between the dependent variable and the regressor variable (F=9.240; p<0.001). This model explains the 37% of peakVO2 variance. The predicted equation for peakVO2 in CHD children was:
Regression Analysis for the Prediction of PeakVO2 Thought the STST.
| R2 | Beta | Standard Error | t Stat | p Value | |
|---|---|---|---|---|---|
| Model | 0.377 | 0.000 | |||
| Height (m) | 46.595 | 15.092 | 3.087 | 0.003 | |
| Age (y) | −1.999 | 0.649 | −3.081 | 0.003 | |
| Weight (kg) | −0.344 | 0.122 | −2.823 | 0.006 | |
| Nb STST | 0.368 | 0.213 | 1.727 | 0.089 |
STST: one-minute sit-to-stand test.
The purpose of this study was, on the one hand, to verify the validation of the STST in CHD children, and on the other hand, to define the appropriate equation to estimate the predicted value peakVO2 in CHD children from basic data obtained during the STST. In healthy children the STST can be used to determine the chronotropic reserve (HR response) during sub-maximal test.21 In our study, we showed that in CHD children, STST may give information about the patient's physical capacity. Indeed, our new algorithm helped to estimate the peakVO2 using a combination of the number of STST and anthropological data (age, weight and height) with a 37% of confidence.
In our cohort of children with CHD, there was no difference between girls and boys in any of the anthropological data at rest. However, the HR measured after the test and after 1min of recovery was significantly different between gender. Surprisingly, the peakVO2, expressed as a percentage of the predicted value, was similar between girls and boys (p=0.46) and the measured values were, for most patients, in the normal range (Table 1). Indeed, the girls have usually a lower peakVO2 levels compared to boys, especially at the onset of puberty.5,22 This difference in peakVO2 is related to the stroke volume of the heart, which is greater in boys.5,22
Field tests were created as alternatives or complements to CPET which remains the gold standard to evaluate the physical capacity.3 The most widely used test in the clinical setting is the 6MWT which was demonstrated to be reliable to assess the functional capacity in healthy children.9 Currently, there are many equations to predict the normal value and verify if the walked distance (6MWD) is in the normal range for children.23–26 These equations consider the age and the height of the children.24,25,27 Others can be used to estimate the peakVO2.7,27 The main limitation of the 6MWT is the required infrastructure and time needed to perform the test. The recommended hallway's length (30m) can indeed be a limiting factor in many clinical settings. Hence, other more practical field tests such as the STST emerged. In adults, the STST was already validated10 and increasingly used as alternative to 6MWT.28,29 In healthy children, STST has been demonstrated to be valid and reliable to quantify the HR response during a sub-maximal exercise12 but it cannot be considered as a valid test to assess the functional exercise capacity in healthy children due to the lack of correlation with the 6MWD. However, the STST is a valid tool to assess functional exercise capacity in children with respiratory diseases, such as bronchiectasis30 or cystic fibrosis.31 Also in healthy children, the STST can also be regarded as a valid and valuable option for assessing muscle strength when it is measured in relation to body weight.32 In our study, as we hypothesized, we observed a poor but significant correlation between the STST and the absolute peakVO2 (r=0.306; p=0.013) while there was no correlation between the STST and the relative peakVO2. Clinically, it means that the STST is a satisfying tool to predict the functional exercise capacity in CHD children, contrarily to healthy children.21
Regarding the HR response, a poor correlation was observed between the STST and DeltaHR (r=0.329; p=0.007). It suggests that the STST does not effectively reflects the HR response during sub-maximal effort in CHD children contrarily to in healthy children.21 This discrepancy could be because 25% of the CHD children took beta-blockers that directly influence the HR.
Based on different independent variables, our work determined an original linear model, which explains the 37% of peakVO2 variance using the STST in CHD children. This is clinically useful when a CPET cannot be performed. Even if the regression coefficient of number of STST was not significant in the model, it has practical importance for therapists as the STST is a quick and easy test to perform compared to CPET. It justifies keeping it in this predictive model.
Like other paediatrics models (i.e. estimation peakVO2 with 6MWT27) the retained model includes simple parameters (age, height, weight and number of STST). The parameters (such as BMI, CHD severity and gender) were not adding additional value, with a lower R2 coefficient.
In adult model, to determine the reference values for the STST, there is a confidence of 28%.29 In contrast, in our study we obtained 37% of confidence, which is higher. A similar equation was proposed in adults with cardiopulmonary disorders, but the authors reported that 6MWD alone does not accurately predict the peakVO2, confirming the need to include other parameters like in our model.27
As an example, for a 12-year-old CHD child (weight=55kg, height=1.57m) who performs 42 repetitions of STST, we can predict a peakVO2 value of 43.46ml/kg/min.3,33
One study limitation in our paediatric cohort was the height of the chair. In adults, the recommended height is 46cm.29 However, in some children (<1.35m) this height was too high, and we used a not validated alternative of 37cm (n=14). Another factor, which could impact our results, is that proportion (25%) of our patients were treated with beta-blockers, a medication limiting their chronotropic response during exercise.
In conclusion, the STST can provide relevant data on physical capacity in children with CHD. In this work, we proposed an unperfect, but useful equation based on the STST and anthropometric parameters (age, weight and height) to estimate the peakVO2 when CPET is not available.
FundingThis research did not receive any specific grant from funding agencies in the public, commercial, or not-for-profit sectors.
Conflict of InterestsThe authors state that they have no conflict of interests.


