Journal Information
Share
Share
Download PDF
More article options
Visits
391
Original Article
Full text access
Available online 16 October 2024
Resectable Non-Small Cell Lung Cancer Heterogeneity and Recurrence Assessed by Tissue Next-Generation Sequencing Genotyping and Circulating Tumor Cell EZH2 Characterization
Visits
391
Abel Garcia-Diaza,1, María José Moyano-Rodríguezb,1, María del Carmen Garrido-Navasa, Diego de Miguel-Perezc, Jose Expósito-Hernándezd,e, Bernardino Alcázar-Navarretef, Francisco Ortuñog, David Landeiraa, Pedro J. Romeroh, Adrian Garcia-Morenoa, Jose A. Lorentea, Javier Lopez-Hidalgod,i, Clara Bayarri-Larab,
Corresponding author
ci.bayarri@gmail.com

Corresponding authors.
, Maria Jose Serranoa,d,i,
Corresponding author
mjose.serrano@genyo.es

Corresponding authors.
a GENYO Centre for Genomics and Oncological Research: Pfizer, University of Granada, Andalusian Regional Government, Liquid Biopsy and Cancer Interception Group, 18016 Granada, Spain
b Department of Thoracic Surgery, Virgen de las Nieves University Hospital, Av de las Fuerzas Armadas, 2, 18014 Granada, Spain
c Center for Thoracic Oncology, Tisch Cancer Institute, Mount Sinai Medical System & Icahn School of Medicine, Mount Sinai, New York, NY, USA
d IBS Granada, Instituto de Investigacion Biosanitaria de Granada, 18012 Granada, Spain
e Comprehensive Oncology Division, Virgen de las Nieves University Hospital, Av de las Fuerzas Armadas, 2, 18014 Granada, Spain
f Department of Pneumology Virgen de las Nieves University Hospital, Av de las Fuerzas Armadas, 2, 18014 Granada, Spain
g Department of Computer Engineering, Automation and Robotics, University of Granada, Granada 18071, Spain
h Department of Medicine School of Medicine, University of Granada, 18016 Granada, Spain
i Molecular Pathology Lab, Pathology Service, Virgen de las Nieves University Hospital, Av de las Fuerzas Armadas, 2, 18014 Granada, Spain
Ver más
This item has received
Article information
Abstract
Full Text
Bibliography
Download PDF
Statistics
Figures (6)
Show moreShow less
Tables (2)
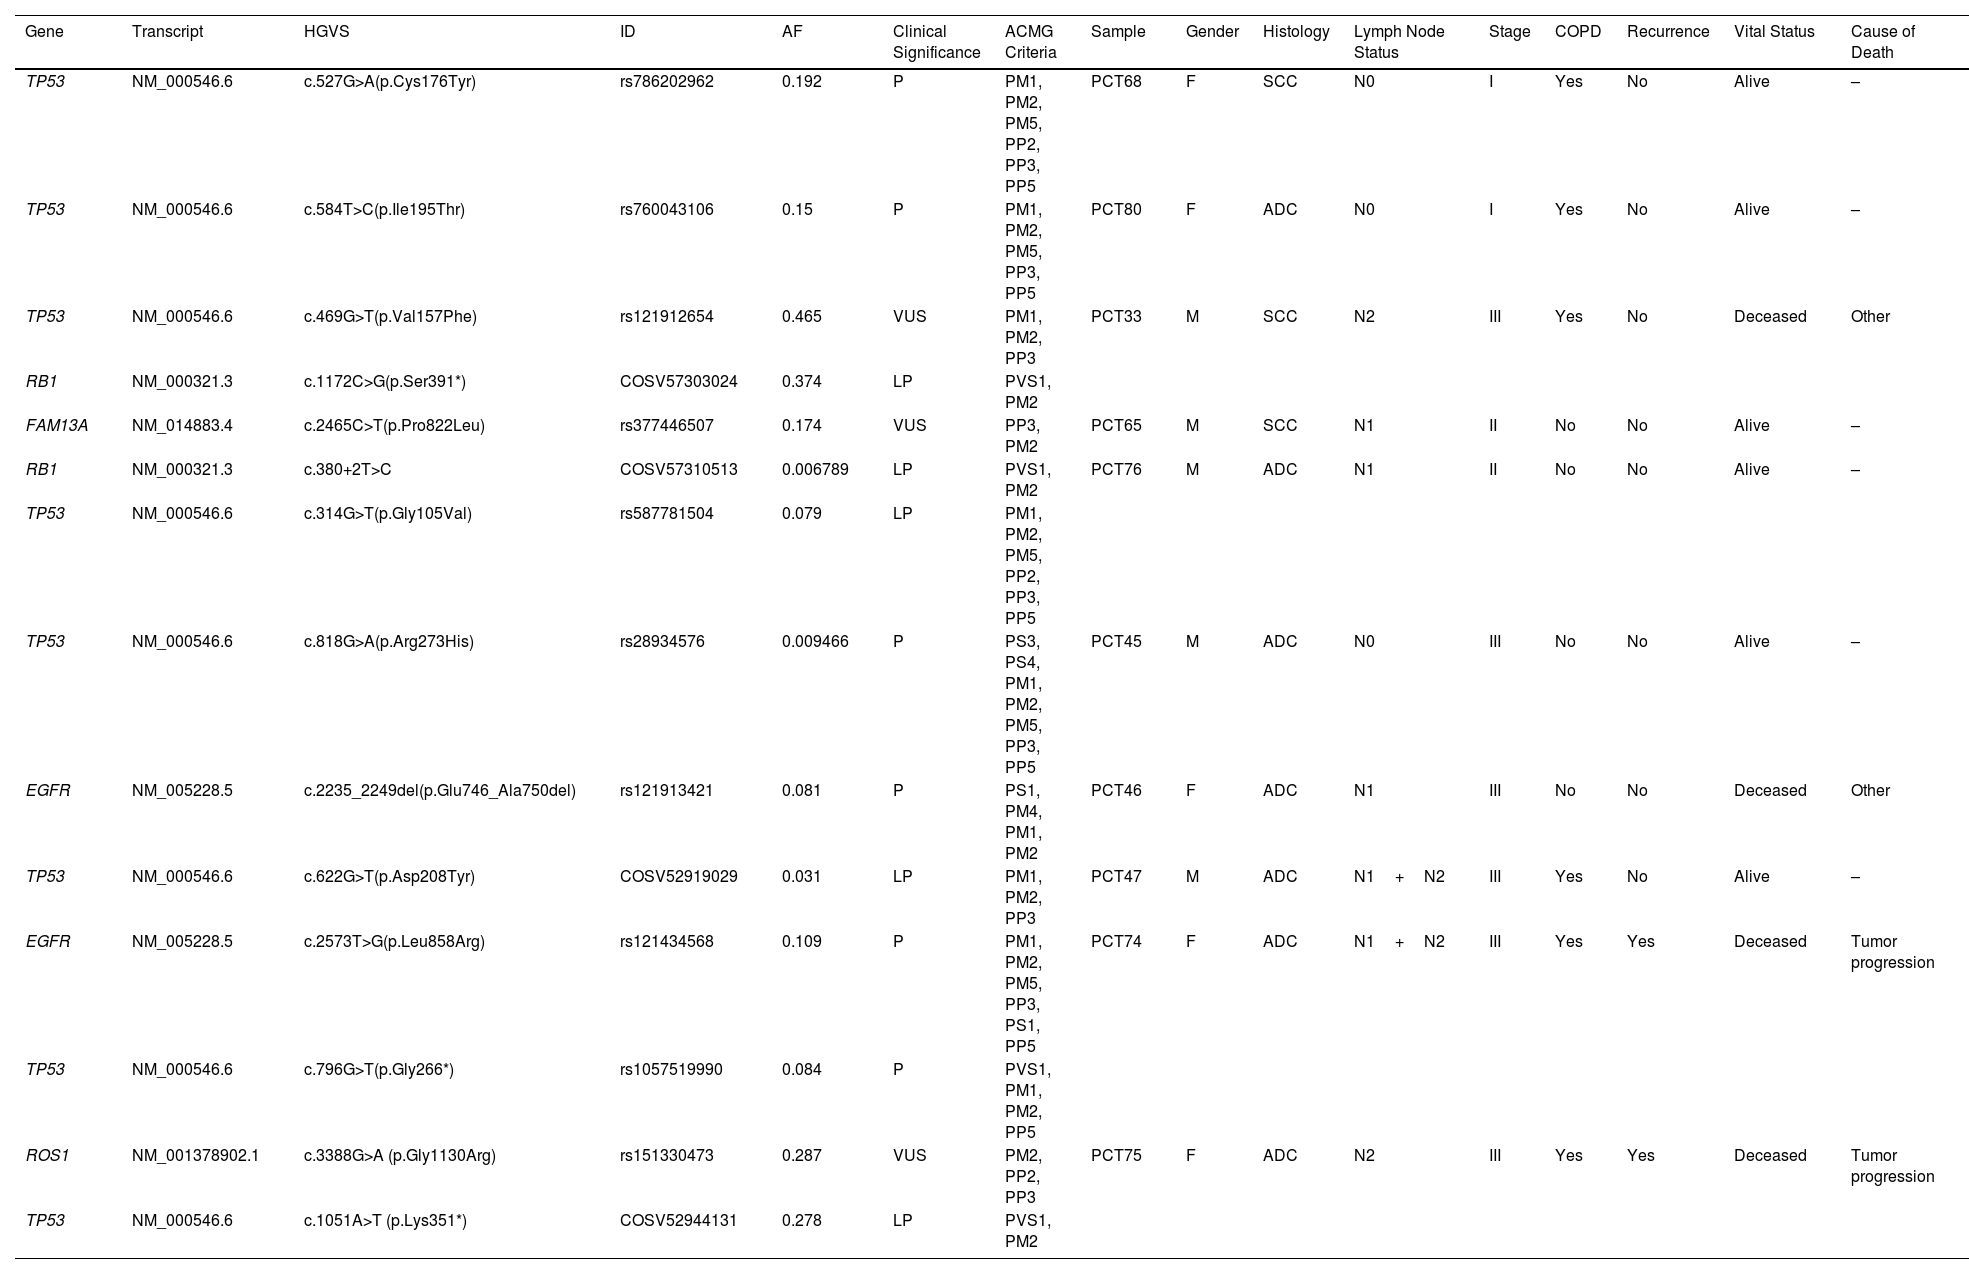
Table 1. Pathogenic, Likely Pathogenic Variants and Hot VUS were Detected in 10/23 Patients by Our Molecular Analyses.
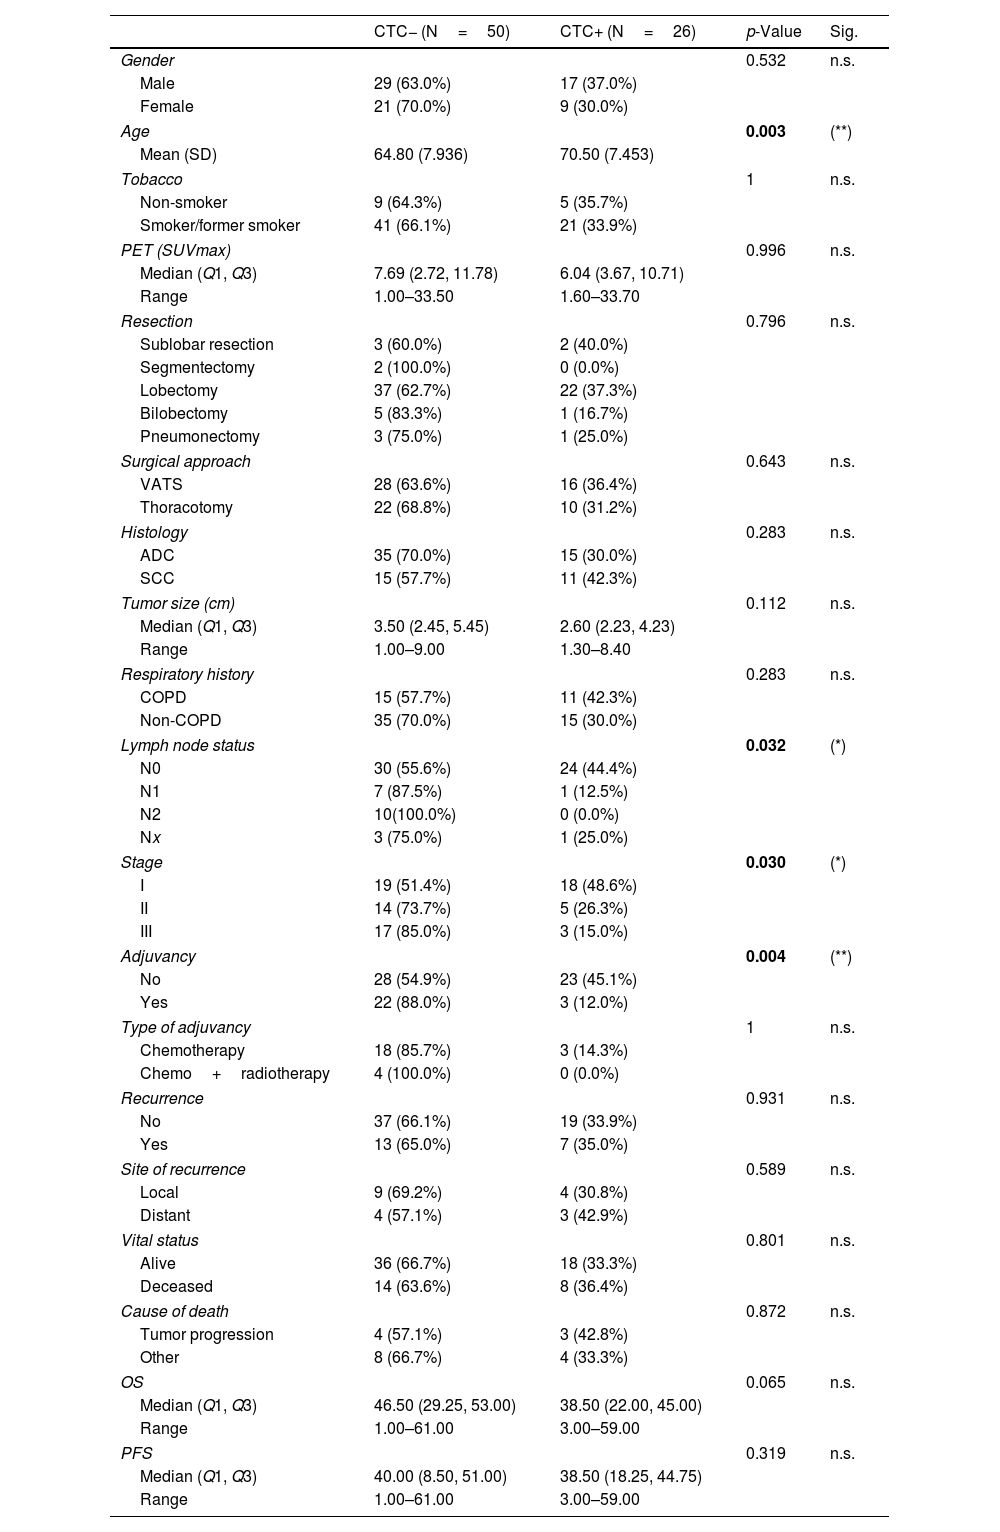
Table 2. Bivariate Analysis of the Clinical Characteristics of the Patients at CTC1.
Show moreShow less
Additional material (1)
Abstract
Introduction

Non-small cell lung cancer (NSCLC) is the most common type of lung neoplasm. Despite surgical resection, it has a high relapse rate, accounting for 30–55% of all cases. Next-generation sequencing (NGS) based on a customized gene panel and the analysis of circulating tumor cells (CTCs) can help identify heterogeneity, stratify high-risk patients, and guide treatment decisions. In this descriptive study involving a small prospective cohort, we focus on the phenotypic characterization of CTCs, particularly concerning EZH2 expression (a member of the Polycomb Repression Complex 2), as well as on the mutation profiles of the tissue using a customized gene panel and their association with poor outcomes in NSCLC.

Methods

Isolation and characterization of EZH2 on CTCs were evaluated before surgical resection (CTC1) and one month after surgery (CTC2) in resectable NSCLC patients. Targeted NGS was performed using a customized 50-gene panel on tissue samples from a subset of patients.

Results

76 patients with resectable NSCLC were recruited. The top mutated genes in the cohort included TP53, FLT1, MUC5AC, EGFR, and NLRP3. Pair of genes that had mutually exclusive mutations was TP53-RIN3, and pairs of genes with co-occurring mutations were CD163-TLR4, FGF10-FOXP2, ADAMTSL3-FLT1, ADAMTSL3-MUC5AC and MUC5AC-NLRP3. CTCs decreased significantly between the two time points CTC1 and CTC2 (p<0.0001), and CTCs+ patients with high EZH2 expression had an 87% increased risk of death (p=0.018).

Conclusions

Integrating molecular profiling of tumors and CTC characterization can provide valuable insights into tumor heterogeneity and improve patient stratification for resectable NSCLC.

Keywords:
NSCLC
NGS
CTCs
EZH2
MRD
Liquid biopsy
Abbreviations:
CK
COPD
CTCs
gDNA
IQR
MRD
NGS
NSCLC
OS
PFS
SEM
VUS
Full Text
Introduction

Lung cancer, which caused 1.8 million deaths in 2022,1 is mainly represented by non-small cell lung cancer (NSCLC), which makes up 85% of cases and has a 5-year survival rate of 20% that varies according to tumor stages.2 Factors that increase the risk of NSCLC include smoking, environmental exposures, and genetic expression dysregulation due to mutations in genes like EGFR, KRAS, and TP53, among others.3 NSCLC is mainly histologically divided into adenocarcinoma and squamous cell carcinoma. According to the last European Society for Medical Oncology (ESMO) guidelines surgery remains the mainstay treatment for stages I–II and resectable stage III NSCLC. After surgery, adjuvant chemotherapy should be offered to patients with resected stages IIB and III NSCLC and can be considered in patients with stage IIA.4 Management of locally advanced stage (IIIA/B) NSCLC consists of multimodal treatment including surgery, chemotherapy, chemoradiotherapy or immune checkpoint inhibitors/tyrosine kinase inhibitors, depending on disease and patient status and the molecular tumor profile.5,6 Despite the treatments used, 30–35% of patients with NSCLC relapse within five years, mainly due to minimal residual disease (MRD) from resection and high genetic heterogeneity.3 Tumors harbor driver mutations (i.e. EGFR, TP53) and branch mutations that cause intratumorally heterogeneity, being responsible for tumor resistance and survival.3,7 Precision medicine uses next-generation sequencing (NGS) to identify heterogeneity, select treatments, and unveil the origin and course of disease.8,9 Nevertheless, among various strategies in NGS, gene panels distinguish themselves for their cost-effectiveness and precision.10,11

Liquid biopsy (LB) monitors the real-time evolution of cancer and circulating tumor cells (CTCs) are one of the elements that correlate with MRD and the risk of relapse in lung cancer patients undergoing surgery.12,13 However, the phenotypic diversity of CTCs in lung cancer requires a clinically meaningful profile.13,14 CTCs reflect the complexity of tissues, and it is possible to identify clones of resistant tumors that cause relapse. The epithelial–mesenchymal transition marks the presence of diverse phenotypes and metastatic potential regulated by EZH2, associated with NSCLC progression, metastasis, and maintenance of cancer cell characteristics.15,16 Screening for CTC− EZH2+ could help stratify the risk of relapse/death and guide treatments.

The primary objective of this study is to investigate the relationship between the molecular profiles of resectable NSCLC tissue and the presence of CTCs that express EZH2 subpopulations. We aim to determine if these molecular profiles and CTC phenotypes can predict clinical outcomes and the likelihood of relapse. Specifically, we hypothesize that certain molecular characteristics are associated with an increased probability of detecting CTCs, which may serve as minimal residual disease (MRD) indicators. Our results will explore these associations to provide clearer insights into how molecular profiles and CTC presence can inform patient prognosis and treatment strategies.

Material and MethodsStudy Design and Patients

Conducted between July 2017 and December 2019, this prospective observational cohort study focused on NSCLC patients undergoing surgical treatment (I–III) at a single tertiary hospital. Surgery consisted of anatomical pulmonary resection and, systematic lymph node dissection for clinical stages II and IIIA and lobe-specific lymph node dissection for stage I. For the LB analyzes, the peripheral blood samples were collected at baseline (CTC1) and one month after surgery (CTC2). Tumor tissue was extracted during surgery, tumoral and peritumoral samples were obtained through a sterile field and placed in RNA Later tubes (AM7020, ThermoFisher Scientific, Waltham, Massachusetts, USA) for preservation.

The pathologic stage was determined by the 8th edition of the international tumor-node-metastasis (TNM) system and, according to the World Health Organization classification, the histologic subtypes of lung cancer were assigned. After surgery, patients were discussed in the hospital's thoracic multidisciplinary oncology committee. Adjuvant chemotherapy was indicated in stages IIb and III following the ESMO guidelines, and it was considered in patients with stage IIA.

The follow-up protocol consisted of surveillance every 6 months for the first 3 years, which included a chest and abdominal CT scan, with optional FDG-PET if required. Then, the follow-up was yearly. Clinical outcomes regarding overall survival (OS) and progression-free survival (PFS) were estimated using the Kaplan–Meier method and both were calculated at 5 years after surgical treatment.

The study, adhering to the Declaration of Helsinki and approved by regional institutional review boards, obtained written informed consent from all participants before enrollment.

gDNA extraction from tissue samples and quantification

Matched tumoral/peritumoral tissue biopsies were collected from patients that underwent surgical treatment. gDNA was extracted using the NucleoSpin® Tissue kit (740952.50, Macherey-Nagel, Düren, Germany), following the manufacturer's instructions. Briefly, 25mg of tissue was used for the extraction. Tissues were homogenized using the TissueLyser LT instrument (Qiagen, Venlo, Netherlands) for 5min at 50oscillations/s. After that, samples were lysed with Proteinase K solution at a final concentration of 2.7mg/ml at 56°C overnight in a shaker. After purification and precipitation, DNA was bound to a silica column, washed twice, and the column was dried out. DNA was eluted in a final volume of 75μl. Concentration was measured using a NanoDrop™ 2000 instrument (ThermoFisher) at a wavelength of 260nm.

Library Preparation

Sequencing libraries were constructed using the KAPA HyperCap workflow v3.0 (Roche, Basel, Switzerland) with a customized gene panel, following the manufacturer's protocol. This customized panel was developed to cover 50 genes (exons) involved in four different biological processes: tumor promotion (ROS1, ALK, TP53, APC, RB1, RET, FLT1, PTEN, STK11, TET2, CTNNB1, MLH1, EGFR, DDR2, SLC22A18, AKT1), Chronic Obstructive Pulmonary Disease (COPD) associated genes (ADAMTSL3, ADAM19, PTCH1, ADGRG6, HTR4, FAM13A, CHRNB4, RIN3, TGFB2, IREB2, SERPINA1, CHRNA3, STN1, CHRNA5, AGER), lung development (FGF10, FOXA1, FOXA2, FOXP2, FOXP4, HOXA2, HOXA5, HOXB2, PITX2, WNT2, ALX1, NKX2-1) and inflammation (CD163, S100A4, NLRP3, MUC5AC, EGR1, TLR4, FPR2), spanning approximately 140kb. It was tested on I–IIIB stage NSCLC to elucidate the contribution of non-tumoral gene mutations on cancer disease development, intercepting cancer. Libraries were quantified with Qubit 4.0 Fluorometer using dsDNA HS Assay kit. Individual libraries were diluted and pooled together in equal amounts (by mass, equimolarity) for obtaining equal numbers of sequencing reads (HiSeq X System, Illumina, San Diego, California, USA).

Sequencing Data Analysis

Once FASTQ files were demultiplexed and retrieved from the sequencer, files were ready for data processing. The GATK best practices-based on the Somatic Variant Pipeline (https://www.clinbioinfosspa.es/content/somatic-variant-pipeline) from the Clinical Bioinformatics Area from Fundación Progreso y Salud (Andalusian Govern – Health and Family Counseling) were followed. Briefly, raw data quality was evaluated using the FastQC tool (v0.11.9, Babraham Bioinformatics, Cambridge, UK). High quality reads were aligned against the human reference genome (GRCh38) using Burrow–Wheeler Aligner algorithm (https://github.com/lh3/bwa). After filtering steps, tumor with matched normal mode from Mutect2 pipeline from GATK (https://gatk.broadinstitute.org/hc/en-us) was run for variant calling. Generated filtered VCFs were annotated using VEP (v99, https://www.ensembl.org/info/docs/tools/vep/index.html). Clinical significance was assessed by following the American College of Medical Genetics (ACMG) criteria. R software (v4.2.1) and RStudio (2022.12.0+353 version) were used for file parsing and for plot generation. Maftools17 was used for oncoplot generation and somatic interactions plot.

Collection of Blood Samples. Enrichment and Isolation of CTCs

Peripheral blood (10ml) was collected in EDTA BD Vacutainer® tubes and stored at room temperature for processing within the next 4h. CTCs were isolated by density gradient centrifugation, following a previously described protocol.12 Briefly, blood samples were centrifuged by density gradient with Ficoll Histopaque®-1119 (density=1.119g/ml) (Merck, Darmstadt, Germany) for 45min at 700×g with no break. The buffy coat where CTCs and PBMCs are located was carefully extracted. Isolation of CTCs was performed by positive immunomagnetic selection using the Carcinoma Cell Enrichment kit (130-108-339, Miltenyi Biotec, Bergisch Gladbach, Germany). This selection is based on a multi-cytokeratin antibody (CK3-6H5), that recognizes the cytoplasmic cytokeratins 7 and 8. Cellular samples were spun down onto slides that were stained and characterized by immunofluorescence.

CTC Characterization by Immunofluorescence

The working area was marked with a hydrophobic pen (Dako). Each sample was hydrated with PBS 1× for 5min and incubated with anti-cytokeratin-FITC antibody, against cytokeratins 7 and 8 (130-060-301, Miltenyi Biotec), diluted 1:100 in PBS 1× – Tween 0.1%+BSA 2% (working solution) for 45min in the dark at room temperature. After this point, darkness was always maintained. After this incubation, samples were washed with PBS 1× for 5min. A blockade was performed with goat serum diluted at 1× in working solution for 1h. To detect the EZH2 protein, primary rabbit anti-EZH2 antibody (#5246S, Cell Signaling Technology) was diluted 1:100 in the working solution and was incubated for 45min. Then, samples are washed in PBS 1× for 5min. Secondary goat anti-rabbit IgG (Alexa Fluor 555, ThermoFisher) was diluted 1:200 in the working solution and was incubated for 45min to reveal EZH2 expression. Nuclei were counterstained using Hoechst33342 (Fluxion) at 1×. Slides were mounted using SlowFade™ Diamond Antifade Mountant (S36972, ThermoFisher) for visualization in Zeiss LSM 710 confocal microscope.

Evaluation of EZH2 in CTCs was analyzed after previous evaluation on A549 control cell line (CCL-185™, ATCC, Manassas, Virginia, USA) for antibody specificity (Supplementary Fig. 1). Because of the heterogeneity observed in patients with CTCs, the percentage expression of EZH2 was calculated as the number of EZH2+ CTCs divided by the total number of CTCs. This calculation aimed to quantify the heterogeneity of CTCs within patients.

Statistical Analysis

CTCs were assessed both as a continuous variable (number of CTCs per 10ml of blood) and as a binary variable (presence/absence and a cut-off of ≥2 CTCs per 10ml). Cut-offs to distinguish low/high CTC numbers and EZH2 expression were determined using the Cut-off Finder web application (fit for mixture model).18 Bivariate analysis examined the relation between clinical features and CTC presence/absence. Clinical variables were evaluated for normality using the Shapiro–Wilk test.

The clinical characteristics were evaluated by Chi-squared (Gender, Procedure, Histology, Respiratory history, Stage, Adjuvancy, Recurrence and Vital status), Fisher's exact test (Tobacco, Resection, Lymph node status, Type of adjuvancy, Site of recurrence, and Cause of death), t-test (Age) and Mann–Whitney U test (PET – SUVmax–, Tumor size (cm), overall survival – OS and progression-free survival – PFS, both in months). Parametric variables are expressed as mean with standard deviation and non-parametric variables as median with interquartile range or down/upper quartile (Q1, Q3).

Wilcoxon Signed-Rank test compared the median of CTC numbers and EZH2 expression between sampling points, to study the dynamics of these variables. Univariate Kaplan–Meier (log-rank test) analyzed the influence of CTC and EZH2 cut-offs on PFS and OS. Fisher's exact test evaluated somatic interactions between gene pairs, while t-tests and Fisher's exact test were further used to compare mutation profiles concerning recurrence and CTC presence, respectively.

Statistical analyses were performed using IBM SPSS Statistics (version 25.0 for MacOS, IBM Corp., Armonk, NY, USA), GraphPad Prism (version 9.0.2 for MacOS, GraphPad software, La Jolla, CA, USA), and R software (v4.2.1) and RStudio (2023.03.0+386 version), with a p-value<0.05 determining statistical significance.

Results

A total of 76 resectable NSCLC patients were enrolled in the study. A descriptive analysis of the cohort is shown in Supplementary Table 1. Most patients were males (60.5%) and smokers (81.6%), with a mean age of 66 years. Lobectomy was the main pulmonary resection performed (77.6%) by Video Assisted Thoracic Surgery (VATS) approach (58.0%). During the follow-up, 20 patients presented cancer recurrence (26.3%). The median time of PFS was 21 months. The histological evaluation of NSCLC was conducted using hematoxylin–eosin staining. The specific histologic types (adenocarcinoma or squamous) were assessed by a pathologist (Supplementary Fig. 2).

Detection of Somatic Variants in gDNA From Matched Tumoral–Peritumoral Tissue Biopsies

Out of the total of 76 patients, only 27 were eligible for inclusion in the NGS analyses due to meeting the required quality standards for library preparation. Average concentration of extracted gDNA was 316.53ng/μL (range: 43.85–946.85ng/μL). Minimal input ensured for library preparation was 500ng. After library preparation, sequencing yielded a mean coverage of approximately 500× along all the samples. From the 27 patients sequenced, only 4 did not pass variant calling filters and they were removed from subsequent analysis. The total number of variants identified for the 23 remaining patients were 143, with an average of 6 variants per patient (range: 1–25). Most of the variants (61.5%; 88/143) were non-coding and SNPs (91.6%), but only 34.3% (49/143) were known variants. Variants were submitted to ClinVar (Accession numbers: SCV003806285–SCV003806424). Regarding the clinical significance of the variants, 9.8% (14/143) were benign/likely benign, 83.2% (119/143) were variants of uncertain significance (VUS) and 7.0% (10/143) were pathogenic/likely pathogenic (Fig. 1A). Oncoplot in Fig. 1B summarizes data for the mutational profiles of each patient and gene. The number of mutations for each patient and the number of samples (patients) affected by mutations in that given gene are represented on both top and right plots, respectively. The top 5 most highly mutated genes were: TP53, FLT1, MUC5AC, EGFR and NLRP3, presented in 43%, 39%, 39%, 26% and 26% of the samples, respectively. Cancer stage, presence/absence of CTCs, expression of EZH2 and mutational signatures (transitions and transversions) are also provided for each patient (Fig. 1B).

Fig. 1.

Mutational landscape of the sequenced patients. (A) Descriptive flow of all the variants found in the 23 patients (Sankey plot) summarizing all the characteristics. (B) Oncoplot summarizing mutational profile for each patient and gene. Top bar plot represents the number of mutations for each patient filled depending on the consequence of mutation. Right side bar plot illustrates the number of samples affected by mutation in the given gene, filled depending on the consequence of mutation. Clinical stage of each patient is also present below sample names, with corresponding proportions of transitions/transversions.

(1.11MB).

Full description of the pathogenic, likely pathogenic variants and hot VUS found is described in Table 1. Both PCT74 and PCT75 patients recurred and had primary point mutations in EGFR and ROS1, respectively, and both had secondary point mutations in TP53 (according to allele frequencies). Contrarily, patients PCT33 and PCT76, had primary mutations in TP53 and secondary mutations in RB1, and they did not have recurrence, suggesting that secondary mutations in TP53 might have a stronger impact on disease recurrence.

Table 1.

Pathogenic, Likely Pathogenic Variants and Hot VUS were Detected in 10/23 Patients by Our Molecular Analyses.

Gene  Transcript  HGVS  ID  AF  Clinical Significance  ACMG Criteria  Sample  Gender  Histology  Lymph Node Status  Stage  COPD  Recurrence  Vital Status  Cause of Death 
TP53  NM_000546.6  c.527G>A(p.Cys176Tyr)  rs786202962  0.192  PM1, PM2, PM5, PP2, PP3, PP5  PCT68  SCC  N0  Yes  No  Alive  – 
TP53  NM_000546.6  c.584T>C(p.Ile195Thr)  rs760043106  0.15  PM1, PM2, PM5, PP3, PP5  PCT80  ADC  N0  Yes  No  Alive  – 
TP53  NM_000546.6  c.469G>T(p.Val157Phe)  rs121912654  0.465  VUS  PM1, PM2, PP3  PCT33  SCC  N2  III  Yes  No  Deceased  Other 
RB1  NM_000321.3  c.1172C>G(p.Ser391*)  COSV57303024  0.374  LP  PVS1, PM2                   
FAM13A  NM_014883.4  c.2465C>T(p.Pro822Leu)  rs377446507  0.174  VUS  PP3, PM2  PCT65  SCC  N1  II  No  No  Alive  – 
RB1  NM_000321.3  c.380+2T>C  COSV57310513  0.006789  LP  PVS1, PM2  PCT76  ADC  N1  II  No  No  Alive  – 
TP53  NM_000546.6  c.314G>T(p.Gly105Val)  rs587781504  0.079  LP  PM1, PM2, PM5, PP2, PP3, PP5                   
TP53  NM_000546.6  c.818G>A(p.Arg273His)  rs28934576  0.009466  PS3, PS4, PM1, PM2, PM5, PP3, PP5  PCT45  ADC  N0  III  No  No  Alive  – 
EGFR  NM_005228.5  c.2235_2249del(p.Glu746_Ala750del)  rs121913421  0.081  PS1, PM4, PM1, PM2  PCT46  ADC  N1  III  No  No  Deceased  Other 
TP53  NM_000546.6  c.622G>T(p.Asp208Tyr)  COSV52919029  0.031  LP  PM1, PM2, PP3  PCT47  ADC  N1+N2  III  Yes  No  Alive  – 
EGFR  NM_005228.5  c.2573T>G(p.Leu858Arg)  rs121434568  0.109  PM1, PM2, PM5, PP3, PS1, PP5  PCT74  ADC  N1+N2  III  Yes  Yes  Deceased  Tumor progression 
TP53  NM_000546.6  c.796G>T(p.Gly266*)  rs1057519990  0.084  PVS1, PM1, PM2, PP5                   
ROS1  NM_001378902.1  c.3388G>A (p.Gly1130Arg)  rs151330473  0.287  VUS  PM2, PP2, PP3  PCT75  ADC  N2  III  Yes  Yes  Deceased  Tumor progression 
TP53  NM_000546.6  c.1051A>T (p.Lys351*)  COSV52944131  0.278  LP  PVS1, PM2                   

The annotation of these variants and the clinical information of the patients that contained them are presented. HGVS: Human Genome Variation Society nomenclature, ID: identifier for the variant, AF: allele frequency, ACMG: The American College of Medical Genetics and Genomics classification, COPD: Chronic Obstructive Pulmonary Disease, P: pathogenic, LP: likely pathogenic, VUS: variants of uncertain significance, F: female, M: male, ADC: adenocarcinoma, SCC: squamous-cell carcinoma.

Analyze Mutually Exclusive and Co-occurring Events

Studying if a pair of genes were mutated simultaneously or if they were mutually exclusive, interactions of the somatic variants were analyzed. The top 5 most significant pairs of genes with co-occurring mutations were: CD163-TLR4, FGF10-FOXP2, ADAMTSL3-FLT1, ADAMTSL3-MUC5AC and MUC5AC-NLRP3 with p-values of 0.0056, 0.0118, 0.0142, 0.0144, 0.0183, respectively. There was only one significant pair of genes with mutually exclusive mutations: RIN3-TP53 (p=0.0457). Interactions among all the genes are represented in Fig. 2. Detailed data of significant pairs of genes highlighted in Fig. 2 can be found in Supplementary Table 2 with additional information for all the significant pairs of genes.

Fig. 2.

Somatic interactions between pairs of genes. Green color is for co-occurrence and pink for mutually exclusive, in boxes. Purple genes are tumor genes, red are inflammation genes, green are COPD-associated genes and black are lung development genes. Number in brackets represents the count of mutations for a given gene. *: p-Value<0.05 for Fisher's exact test.

(0.71MB).

Most variants were VUS (83.2%) and as they might be reclassified in the future as either pathogenic/likely pathogenic (P) or benign/likely benign (B), we studied their impact on recurrence by grouping them with either P or B. Two comparisons were done: P+VUS (pathogenic variants and VUS) and VUS+B (VUS and benign variants). P+VUS showed significant differences (p=0.0404) between no-recurrence and recurrence patients, with a mean number of variants of 4.8 (standard error of the mean – SEM=0.65) in the no-recurrence group versus a mean of 11 (SEM=5.54) variants in the recurrence group. On the other hand, VUS+B showed no significant differences (p=0.0597) between no-recurrence (mean of 5, SEM=0.71) and recurrence patients (mean of 11, SEM=7.09) (Fig. 3).

Fig. 3.

Differences in the number of variants between no recurrence vs. recurrence patients. Number of variants presented in both types of patients, grouped by clinical significance. P+VUS: Pathogenic variants and VUS, VUS+B: VUS and benign variants, P+B: Pathogenic variants and benign variants, Total: all types of variants. *: p-value<0.05, ns is for not significance. Mean with SEM is represented. t test was applied.

(0.06MB).
CTCs: Isolation, Characterization, and Prognostic Role

The possible correlation between the clinical–pathological characteristics of the patients and the presence or absence of CTCs (based on cytokeratin, CK, expression) was investigated before surgery (CTC1, Table 2) and one month after surgery (CTC2, Supplementary Table 3). The presence of CTC before surgery (CTC1) was significantly correlated with age, lymph node status (N), tumor stage, and adjuvant treatment. Regarding tumor stage, most patients with stages II and III were CTC− (p=0.0300). Focused on N status, most patients with lymph node metastasis were CTC− (p=0.0320). Consequently, it was observed that most CTC− patients received adjuvant treatment compared with the CTC+ patients (p=0.0040).

Table 2.

Bivariate Analysis of the Clinical Characteristics of the Patients at CTC1.

  CTC− (N=50)  CTC+ (N=26)  p-Value  Sig. 
Gender      0.532  n.s. 
Male  29 (63.0%)  17 (37.0%)     
Female  21 (70.0%)  9 (30.0%)     
Age      0.003  (**
Mean (SD)  64.80 (7.936)  70.50 (7.453)     
Tobacco      n.s. 
Non-smoker  9 (64.3%)  5 (35.7%)     
Smoker/former smoker  41 (66.1%)  21 (33.9%)     
PET (SUVmax)      0.996  n.s. 
Median (Q1, Q3)  7.69 (2.72, 11.78)  6.04 (3.67, 10.71)     
Range  1.00–33.50  1.60–33.70     
Resection      0.796  n.s. 
Sublobar resection  3 (60.0%)  2 (40.0%)     
Segmentectomy  2 (100.0%)  0 (0.0%)     
Lobectomy  37 (62.7%)  22 (37.3%)     
Bilobectomy  5 (83.3%)  1 (16.7%)     
Pneumonectomy  3 (75.0%)  1 (25.0%)     
Surgical approach      0.643  n.s. 
VATS  28 (63.6%)  16 (36.4%)     
Thoracotomy  22 (68.8%)  10 (31.2%)     
Histology      0.283  n.s. 
ADC  35 (70.0%)  15 (30.0%)     
SCC  15 (57.7%)  11 (42.3%)     
Tumor size (cm)      0.112  n.s. 
Median (Q1, Q3)  3.50 (2.45, 5.45)  2.60 (2.23, 4.23)     
Range  1.00–9.00  1.30–8.40     
Respiratory history      0.283  n.s. 
COPD  15 (57.7%)  11 (42.3%)     
Non-COPD  35 (70.0%)  15 (30.0%)     
Lymph node status      0.032  (*
N0  30 (55.6%)  24 (44.4%)     
N1  7 (87.5%)  1 (12.5%)     
N2  10(100.0%)  0 (0.0%)     
Nx  3 (75.0%)  1 (25.0%)     
Stage      0.030  (*
19 (51.4%)  18 (48.6%)     
II  14 (73.7%)  5 (26.3%)     
III  17 (85.0%)  3 (15.0%)     
Adjuvancy      0.004  (**
No  28 (54.9%)  23 (45.1%)     
Yes  22 (88.0%)  3 (12.0%)     
Type of adjuvancy      n.s. 
Chemotherapy  18 (85.7%)  3 (14.3%)     
Chemo+radiotherapy  4 (100.0%)  0 (0.0%)     
Recurrence      0.931  n.s. 
No  37 (66.1%)  19 (33.9%)     
Yes  13 (65.0%)  7 (35.0%)     
Site of recurrence      0.589  n.s. 
Local  9 (69.2%)  4 (30.8%)     
Distant  4 (57.1%)  3 (42.9%)     
Vital status      0.801  n.s. 
Alive  36 (66.7%)  18 (33.3%)     
Deceased  14 (63.6%)  8 (36.4%)     
Cause of death      0.872  n.s. 
Tumor progression  4 (57.1%)  3 (42.8%)     
Other  8 (66.7%)  4 (33.3%)     
OS      0.065  n.s. 
Median (Q1, Q3)  46.50 (29.25, 53.00)  38.50 (22.00, 45.00)     
Range  1.00–61.00  3.00–59.00     
PFS      0.319  n.s. 
Median (Q1, Q3)  40.00 (8.50, 51.00)  38.50 (18.25, 44.75)     
Range  1.00–61.00  3.00–59.00     

p: p-value for the correspondent statistic, Sig.: significance, n.s.: no significance.

*

p-value<0.05.

**

p-value<0.01. CTC: circulating tumor cell, SD: standard deviation, PET: positron emission tomography, VATS: video-assisted surgery, ADC: adenocarcinoma, SCC: squamous cell carcinoma, COPD: Chronic Obstructive Pulmonary Disease, OS: overall survival, DFS: disease-free survival, Q1: lower quartile, Q3: upper quartile.

At CTC1, CTCs were detected in 26/76 patients (34.2%) with a median number of 3 in those CTCs+ patients (IQR=3, range=1–8) meanwhile, at CTC2 the presence of CTCs was detected in only 3/76 patients (3.9%) with a median number of 2 CTCs in those CTCs+ patients (IQR=3, range=1–4). In addition, the dynamics of CTCs between the two time points, CTC1 and CTC2, were also analyzed. We observed a significant decrease in the number of CTCs because of the surgery (p<0.0001, Wilcoxon test) (Fig. 4A).

Fig. 4.

Dynamics of circulating tumor cells (CTCs) and expression of EZH2 in CTCs from NSCLC patients. (A) Differences in the number of CTCs between CTC1 (before surgery) and CTC2 (one month after surgery). ****: p value for Wilcoxon test, p=0.0001. (B) Comparison of the percentage of expression of EZH2 at CTC1 and CTC2. Abbreviation n.s. is not significant for Mann–Whitney U test, p=0.2562).

(0.07MB).

The expression of EZH2 on CTCs was measured (see CTC characterization by immunofluorescence methods Section) at CTC1 in the 26 CTC+ patients. We found that 13/26 patients were EZH2+ (50.0%), with a median percentage of expression of 6.25% (IQR: 54.17%, range: 0–100%). At CTC2, EZH2 was detected in 2/3 CTC+ patients (66.67%), with a median percentage of expression of EZH2 of 100% (IQR: 100%, range: 0–100%). Expression of EZH2 showed no significant differences between CTC1 and CTC2 (Fig. 4B).

The prognostic role of circulating tumor cells (CTCs) for PFS and OS was evaluated using either the presence/absence of CTCs or a cut-off of p=0.5430 and p=0.9070, respectively; see Supplementary Fig. 3). Using the CTC cut-off of p=0.1920 and p=0.4380, respectively). OS was measured at 5 years since surgical treatment.

Interestingly, when evaluating EZH2 expression in the CTCs using a cut-off of <70% or ≥70% for the previously calculated percentage of expression (EZH2low/EZH2high, respectively), significant differences in terms of OS were observed at CTC1 (p=0.0180, Log-Rank, Mantel–Cox) with EZH2high patients having an 87% greater risk of death. In terms of PFS no significant differences were found for EZH2 characterization (p=0.9130) (Fig. 5C and D).

Fig. 5.

Prognostic role of CTCs and EZH2 expression on CTCs. Kaplan–Meier at CTC1 of the effect of the number of CTCs based on a cut-off (high2/low<2) in the relapse-free survival (A) and overall survival (B). Kaplan–Meier of the influence of the EZH2 expression cut-off in the progression-free survival (C) and overall survival (D). Log-Rank (Mantel–Cox) test was applied in all the panels.

(0.37MB).

At CTC2 neither presence/absence of CTCs nor CTC2low/CTC2high showed significant differences in terms of PFS or OS (Supplementary Fig. 4). At this point, Kaplan–Meier curves could not be calculated for EZH2low/EZH2high in CTCs+ patients due to the very small sample size.

Integrative Analysis of Tissue Molecular Profiles and Presence of CTCs

Presence or absence of CTCs at baseline was analyzed based on the tissue molecular profiles. While we did not find statistical differences between the presence or absence of CTCs and VUS in the studied genes, we did observe a noteworthy trend. There were two out of three patients without CTCs in the follow-up but with VUS in ADAM19 that locally recurred (p=0.1739). The only patient with CTCs (both at baseline and the follow-up) and VUS in ADAM19 did not recur at time of these analyses (Supplementary Table 4).

Discussion

This study examines biological data from different approaches in stage I-IIIB NSCLC patients, evaluating the mutational profile of lung tissue with a customized panel of 50 genes and CTCs. Regarding the prognostic role of CTCs, despite this study including a small population, patients with a high percentage of CTC− EZH2+ showed poorer OS. Our recent results are consistent with previous data associating the expression of the EZH2 protein in breast cancer with metastatic recurrence and worse PFS and OS in this study19–21 and in lung cancer with tumor colonization.16 Due to the essential and heterogeneous role of EZH2 in regulating various sets of genes in cancer, many clinical trials have emerged to test inhibitors against this target.22 However, our results also suggest the importance of characterizing the CTCs to identify the aggressiveness of cell subpopulations.23–25 Interestingly, we observed that patients with negative lymph node status (pN0) but positive for circulating tumor cells (CTC) had a shorter OS. These preliminary findings suggest the presence of occult metastatic disease. These results are consistent with previous studies, which have shown that the shedding of tumor cells can occur through pathways independent of lymphatic drainage, indicating that the presence of CTCs in N0 breast cancer predicts disease relapse.26

In our study, the molecular profiling found an association between RIN3 and TP53, which might imply that RIN3 variants could induce lung cancer despite the initial normal function of TP53. The role of RIN3 regulating tyrosine kinase ABL relates to cytoskeletal remodeling, which affects processes crucial for the spread of lung cancer.27 A more extensive study integrating COPD and lung cancer patient data may elucidate RIN3's role in cancer development.

On the other hand, our results suggest that the presence of secondary point mutations affecting TP53 together with EGFR mutations is associated with the relapse of the patients. Despite having only two patients with these characteristics, this result aligns with previous works, which have associated concomitant TP53 mutations and EGFR mutations with OS and response to treatment. For example, in the study by X. Le et al., the impact of TP53 co-mutations on clinical outcomes in patients with EGFR-mutant advanced NSCLC was examined. This observational study used data from a de-identified database and found that patients with TP53 co-mutations had significantly shorter real-world PFS and OS compared to those with wild-type TP53 tumors.28

Furthermore, genetic variants co-occurring in ADAMTSL3 and FLT-1 (VEGFR-1) suggest involvement in tumor dissemination and prognosis,29 although the study could not establish their link to CTC presence due to sample size limitations. Investigating ADAMTSL3-FLT1 variants in more extensive studies may uncover lung cancer development after COPD.

NLRP3 and MUC5AC, highly mutated genes in our population, might indicate a potential link to aggressive lung adenocarcinoma and poor outcomes in COPD patients,30,31 suggesting their mutational presence could identify COPD patients prone to developing cancer.

Despite the limitations of the small population size, our study observed that baseline tissue variants could predict recurrence better than CTCs. Patients experiencing relapse expressed more potentially impactful (P+VUS) variants compared to non-relapsed patients. Less studied genes in the panel contributed to a higher rate of VUS, highlighting the need for further evidence and potential reclassification of these variants.

Conclusions

This work presents the preliminary results obtained from a small population. These findings aim to generate new hypotheses and lines of research. Our results suggest that combining CTC characterization with the molecular profiling of the tumor might elucidate tumor heterogeneity. A more extensive study with a larger population would enable the identification and stratification of resectable NSCLC patients at higher risk of recurrence.

Funding

This work was supported by the Health Counseling from the Andalusian Government and GlaxoSmithKline Spain (GSK Spain) (grant number: PIP-0192-2020).

Authors’ Contributions

M.J.S. conceptualized the study and acquired the funding. M.J.S. and M.dC.G.N. leaded the study. A.G.D., M.J.S., M.dC.G.N. designed the experiments. D.dM.P. and A.G.D. processed samples from patients. A.G.D. and M.J.M. carried out the experiments. M.J.M. and C.B.L. recruited the patients involved in the study. J.E.H. supervised clinical management. F.O., A.G.D. and A.G.M. performed bioinformatic analyses. A.G.D. visualized the data. A.G.D. and M.J.M. wrote the manuscript. J.L.H. assessed the diagnostic of the different histological subtypes of the patients. M.J.S., M.dC.G.N., D.dM.P., D.L., J.A.L., C.B.L., B.A.N, P.J.R. and C.R. conducted manuscript review and editing. All authors have read and agreed to the published version of the manuscript.

Conflict of Interest

The authors have no competing interests to declare that are relevant to the content of this article.

Data Availability Statement

Variants found in this work are accessible through ClinVar accession numbers SCV003806285 and SCV003806424.

Acknowledgments

We would like to extend our gratitude to all the patients enrolled in this study and to the Health Counselling from the Andalusian Government and GlaxoSmithKline (GSK) for funding this work (PIP-0192-2020).

Appendix A
Supplementary Data

The followings are the supplementary data to this article:

References
[1]
F. Bray, M. Laversanne, H. Sung, J. Ferlay, R.L. Siegel, I. Soerjomataram, et al.
Global cancer statistics 2022: GLOBOCAN estimates of incidence and mortality worldwide for 36 cancers in 185 countries.
CA Cancer J Clin, 74 (2024), pp. 229-263
[2]
C. Gridelli, A. Rossi, D.P. Carbone, J. Guarize, N. Karachaliou, T. Mok, et al.
Non-small-cell lung cancer.
Nat Rev Dis Primers, 1 (2015), pp. 1-16
[3]
B.C. Bade, C.S. de la Cruz.
Lung cancer 2020: epidemiology etiology, and prevention.
Clin Chest Med, 41 (2020), pp. 1-24
[4]
J. Remon, J.C. Soria, S. Peters.
Early and locally advanced non-small-cell lung cancer: an update of the ESMO Clinical Practice Guidelines focusing on diagnosis, staging, systemic and local therapy.
Ann Oncol, 32 (2021), pp. 1637-1642
[5]
C. Lieping, H. Xue.
Anti-PD-1/PD-L1 therapy of human cancer: past, present, and future.
J Clin Invest, 125 (2015), pp. 9
[6]
J.C. Soria, Y. Ohe, J. Vansteenkiste, T. Reungwetwattana, B. Chewaskulyong, K.H. Lee, et al.
Osimertinib in untreated EGFR-mutated advanced non-small-cell lung cancer.
N Engl J Med, 378 (2018), pp. 113-125
[7]
E.C. de Bruin, N. McGranahan, R. Mitter, M. Salm, D.C. Wedge, L. Yates, et al.
Spatial and temporal diversity in genomic instability processes defines lung cancer evolution.
Science, 346 (2014), pp. 251-256
[8]
N.I. Lindeman, P.T. Cagle, D.L. Aisner, M.E. Arcila, M.B. Beasley, E.H. Bernicker, et al.
Updated molecular testing guideline for the selection of lung cancer patients for treatment with targeted tyrosine kinase inhibitors: guideline from the College of American Pathologists, the International Association for the Study of Lung Cancer, and the Association for Molecular Pathology.
Arch Pathol Lab Med, 142 (2018), pp. 321-346
[9]
Y. Choudhury, M.H. Tan, J.L. Shi, A. Tee, K.C. Ngeow, J. Poh, et al.
[10]
M. Seleman, R. Hoyos-Bachiloglu, R.S. Geha, J. Chou.
Uses of next-generation sequencing technologies for the diagnosis of primary immunodeficiencies.
Front Immunol, 8 (2017), pp. 847
[11]
S.M. Group.
Comprehensive gene panels provide advantages over clinical exome sequencing for Mendelian diseases.
Genome Biol, 16 (2015), pp. 134
[12]
C. Bayarri-Lara, F.G. Ortega, A. Cueto Ladrón De Guevara, J.L. Puche, J. Ruiz Zafra, D. de Miguel-Pérez, et al.
Circulating tumor cells identify early recurrence in patients with non-small cell lung cancer undergoing radical resection.
[13]
D. de Miguel-Pérez, C.I. Bayarri-Lara, F.G. Ortega, A. Russo, M.J.M. Rodriguez, M.J. Alvarez-Cubero, et al.
Post-surgery circulating tumor cells and AXL overexpression as new poor prognostic biomarkers in resected lung adenocarcinoma.
Cancers (Basel), 11 (2019), pp. 1750
[14]
L. O’Flaherty, H. Wikman, K. Pantel.
Biology and clinical significance of circulating tumor cell subpopulations in lung cancer.
Transl Lung Cancer Res, 6 (2017), pp. 431-443
[15]
H. Cardenas, J. Zhao, E. Vieth, K.P. Nephew, D. Matei.
EZH2 inhibition promotes epithelial-to-mesenchymal transition in ovarian cancer cells.
Oncotarget, 7 (2016), pp. 84453-84467
[16]
A. Gallardo, A. Molina, H.G. Asenjo, L. Lopez-Onieva, J. Martorell-Marugán, M. Espinosa-Martinez, et al.
EZH2 endorses cell plasticity to non-small cell lung cancer cells facilitating mesenchymal to epithelial transition and tumour colonization.
Oncogene, 41 (2022), pp. 3611-3624
[17]
A. Mayakonda, D.C. Lin, Y. Assenov, C. Plass, H.P. Koeffler.
Maftools: efficient and comprehensive analysis of somatic variants in cancer.
Genome Res, 28 (2018), pp. 1747-1756
[18]
J. Budczies, F. Klauschen, B. Sinn v, B. Gyorffy, W.D. Schmitt, S. Darb-Esfahani, et al.
Cutoff finder: a comprehensive and straightforward Web application enabling rapid biomarker cutoff optimization.
[19]
T.J.N. Hiltermann, M.M. Pore, A. van den Berg, W. Timens, H.M. Boezen, J.J.W. Liesker, et al.
Circulating tumor cells in small-cell lung cancer: a predictive and prognostic factor.
Ann Oncol, 23 (2012), pp. 2937-2942
[20]
S.H. Alford, K. Toy, S.D. Merajver, C.G. Kleer.
Increased risk for distant metastasis in patients with familial early-stage breast cancer and high EZH2 expression.
Breast Cancer Res Treat, 132 (2012), pp. 429-437
[21]
Y.R. Hussein, A.K. Sood, S. Bandyopadhyay, B. Albashiti, A. Semaan, Z. Nahleh, et al.
Clinical and biological relevance of enhancer of zeste homolog 2 in triple-negative breast cancer.
Hum Pathol, 43 (2012), pp. 1638-1644
[22]
K.H. Kim, C.W.M. Roberts.
Targeting EZH2 in cancer.
Nat Med, 22 (2016), pp. 128-134
[23]
A. Roa-Colomo, M.Á. López Garrido, P. Molina-Vallejo, A. Rojas, M.G. Sanchez, V. Aranda-García, et al.
Hepatocellular carcinoma risk-stratification based on ASGR1 in circulating epithelial cells for cancer interception.
Front Mol Biosci, 9 (2022), pp. 1308
[24]
D.S. Micalizzi, S. Maheswaran, D.A. Haber.
A conduit to metastasis: circulating tumor cell biology.
Genes Dev, 31 (2017), pp. 1827
[25]
Z. Eslami-S, L.E. Cortés-Hernández, F. Thomas, K. Pantel, C. Alix-Panabières.
Functional analysis of circulating tumour cells: the KEY to understand the biology of the metastatic cascade.
Br J Cancer, 127 (2022), pp. 800-810
[26]
S.I. Mohammed, O. Torres-Luquis, E. Walls, F. Lloyd.
Lymph-circulating tumor cells show distinct properties to blood-circulating tumor cells and are efficient metastatic precursors.
Mol Oncol, 13 (2019), pp. 1400-1418
[27]
J.H. Luttman, A. Colemon, B. Mayro, A.M. Pendergast.
Role of the ABL tyrosine kinases in the epithelial–mesenchymal transition and the metastatic cascade.
Cell Commun Signal, 19 (2021), pp. 1-16
[28]
X. Le, C. Molife, M.S. Leusch, M.T. Rizzo, P.M. Peterson, N. Caria, et al.
TP53 co-mutation status association with clinical outcomes in patients with EGFR-mutant non-small cell lung cancer.
Cancers (Basel), 14 (2022), pp. 6127
[29]
A.K. Bauer, M. Umer, V.L. Richardson, A.M. Cumpian, A.Q. Harder, N. Khosravi, et al.
Requirement for MUC5AC in KRAS-dependent lung carcinogenesis.
JCI Insight, 3 (2018), pp. e120941
[30]
H. Wang, C. Lv, S. Wang, H. Ying, Y. Weng, W. Yu.
NLRP3 inflammasome involves in the acute exacerbation of patients with chronic obstructive pulmonary disease.
Inflammation, 41 (2018), pp. 1321-1333
[31]
B.A. Parris, H.E. O’Farrell, K.M. Fong, I.A. Yang.
Chronic obstructive pulmonary disease (COPD) and lung cancer: common pathways for pathogenesis.
J Thorac Dis, 11 (2019), pp. S2155-S2172

Contributed equally.

Copyright © 2024. SEPAR
Archivos de Bronconeumología
Article options
Tools

Are you a health professional able to prescribe or dispense drugs?