Expanding TNM staging system for lung cancer with the addition of new prognostic factors could enhance patient stratification and survival prediction. The goal of this study is to assess if TNM prognosis capacity could be improved by incorporating other pathological characteristics of surgical specimen.
MethodsWe retrospectively reviewed lung cancer resections, stages I–II, performed between January 1st 2010 and May 1st 2019. We collected clinical variables and pathological characteristics, including vascular, lymphovascular and perineural invasion, STAS, necrosis and stromal features. Mortality and recurrence-free survival were assessed with univariable and multivariable Cox analysis. We explored how these factors would modify the TNM Harrel's index.
Results629 tumors were analyzed. Median overall survival was 53.9 months. Median recurrence-free survival was 47.6 months. Specific survival at 3, 5 and 10 years was 90, 83 and 74%. Recurrence-free survival at 3, 5 and 10 years was 76, 70 and 65%.
The multivariable analysis showed that overall survival was significantly related to TNM classification (p<0.0002), vascular infiltration (HR 1.93, CI 1.42–2.64, p<0.0001), lymphovascular invasion (HR 1.88, CI 1.30–2.71, p<0.0015) and necrosis (HR 1.74, CI 1.24–2.45, p<0.0025). Harrell's index for TNM was 0.6139. Adding vascular, lymphovascular invasion and necrosis, it increased up to 0.6531.
The multivariable analysis showed that specific survival was significantly related to TNM classification (p<0.001), vascular infiltration (HR 2.23, CI 1.44–3.46, p<0.001) and lymphovascular invasion (HR 1.85, CI 1.09–3.13, p<0.021). Harrell's index for TNM was 0.6645. Adding vascular and lymphovascular invasion, it increased up to 0.7103. Recurrence-free survival was related to TNM, vascular infiltration (HR 1.48, CI 1.05–2.09, p<0.023) and lymphovascular invasion (HR 2.40, CI 1.64–3.50, p<0.001). Harrell's index for TNM was 0.6264. Adding vascular and lymphovascular invasion, it increased up to 0.6794.
ConclusionsIncluding vascular and angiolymphatic invasion in the staging system classification could better stratify patients at risk of recurrence and tumor-related death.
Cancer is one of the leading causes of mortality in the world. Lung cancer was the second cancer in incidence in 2020 and the most frequent cause of tumor-death despite therapeutic advances (18% of world deaths1). Patients are stratified according to their risk of recurrence and death by the TNM staging system, which is constantly under revision by the IASLC (International Association for the Study of Lung Cancer). Since January 2017 its 8th edition is in use. Adding molecular features to the anatomical TNM classification complements the pathologic description of the tumor and guides adjuvant therapies.
Previous editions of the TNM system mentioned that other pathological characteristics (such as lymphangitis, grade of differentiation, etc.) could have prognostic roles but none of them were included in the last edition. This possible prognostic role, apart from the anatomical descriptors, was underlined by several authors in the past.
For example, Bodendorf2 observed that lung cancer patients in early stages with lymphovascular and blood vessel invasion progressed and developed metastases more frequently than those without them. Tsuchiya,3,4 affirmed that patients in stage IA with vascular invasion should be upstaged so their expected survival would be more accurate and they were treated, additionally, with adjuvant therapy.
Several studies have confirmed that the presence of lymphovascular invasion was clearly related to cancer recurrence5–7 and to cancer-related death,8 specially in early stages.
The negative impact of perineural invasion, though previously studied, couldn’t be confirmed, due to its scarce presence in the tumors in the published series.9,10
Finally, other characteristics such as STAS (Spread through Air Spaces), tumoral necrosis and stromal features have been explored with uneven results.
For this reason, we have revised our database in order to determine the impact of the presence of these pathological characteristics in the patient's survival. We have tested if the prognostic capacity of the TNM system could be improved by adding them. Using the regression Cox model we have evaluated the prognostic capacity of the TNM system in our series and compared it with our proposed model, using the Harrell's index, AIC, BIC, AUC and the Brier score.
MethodsThe main objective of this study was to evaluate the prognostic value of the presence of several pathological characteristics usually described in the pathological reports but lacking of recognized impact in the patient's survival. The secondary objective was to create a risk model including the variables with significant value.
We retrospectively reviewed the medical reports of all the patients who underwent surgical resection for non-small-cell lung cancer between January 1st 2010 and May 1st 2019 in the Thoracic Surgery Department of Ramón y Cajal Hospital.
We included all the patients treated for non-small-cell lung cancer, stages I–II, with curative intent and complete resection during this period of time. The surgical procedures included anatomic and non-anatomic resections (only in tumor smaller than 2cm.) performed through open or VATS approaches. All procedures were completed with lymph node sampling. Patients with personal background of head and neck squamous tumors were excluded from the study to avoid the possible confusion between primary and secondary tumor. Finally, patients who died in direct relationship with the surgery, even if the event happened later than the 30th postoperative day, were excluded from the survival analysis (Fig. 1, Flow chart in Supplementary material).
TNM classificationWe revised all pathological reports to collect data regarding histology, pathological TNM and the variables of study (blood vessel and lymphatic vessel invasion, perineural invasion, spontaneous necrosis, STAS and stromal characteristics). The same pathologist has evaluated all the surgical specimens during the time span of the study, excluding the reader bias. We excluded cases whose pathological data were incomplete. The pathological data collector was blind to the patient's outcomes.
All the patients operated before 2017 were reclassified according to the 8th edition using the data present in the pathological report and the radiological images (for atelectatic lobe or lung).
Outcomes. Follow-up visits were scheduled every 3 months the first 2 years, every 6 months the third and fourth years and every 12 months afterwards. Local recurrence was defined as the appearance of soft tissue, nodular or mass, of the same histology as the primary tumor in the same lung, chest wall or mediastinum, while distant recurrence was defined when it appears in the other hemithorax, or any other distant site.
Statistical analysis: For comparison, T-test was used for continuous variables with normal distribution and Mann–Whitney U-test for continuous variables without normal distribution (median, range, quartiles, etc.). Categorical variables are presented as frequencies and percentages and Chi-square is used for comparison. When the expected frequency of an event is inferior to 5 in more than 25% of cells, we selected Fisher's test.
Overall survival (OS) spans from the day of surgery to the last date of follow up and recurrence-free survival (RFS) from the day of surgery to the day of demonstrated local or distant recurrence. Cancer-related survival or cancer-specific survival (CRS) extends from the day of surgery to the date of death, when this occurs as a direct result of cancer. Kaplan–Meier method was used to analyze OS, RFS and CRS for each variable.
Multivariable Cox regression analysis was used to test if the presence of the pathological variables of interest simultaneously with the TNM classification influenced the cancer-related and recurrence-free survival.
Significance level is set to 0.05, two-sided. All statistical analysis were performed using STATA 16.1.
The statistically significant variables were included in a model with the TNM classification. We calculated the Harrel's index, the Akaike information criteria (AIC) and the Bayesian Information criteria (BIC) of both, the TNM staging system and the new model that incorporates the TNM with statistically significant pathological characteristics, to evaluate if the new model really improves the prognostic capacity of the TNM staging system. Because adding more variables to a model usually increases the Harrel's Index, even if they are not relevant statistically, we calculated BIC and AIC (which penalize the addition of many variables, making the Harrell's index more useful). To provide a measure of the added prognostic value of the proposed model, we have also calculated the AUC for 36 months of follow-up and the Brier score for 36 and 48 months.
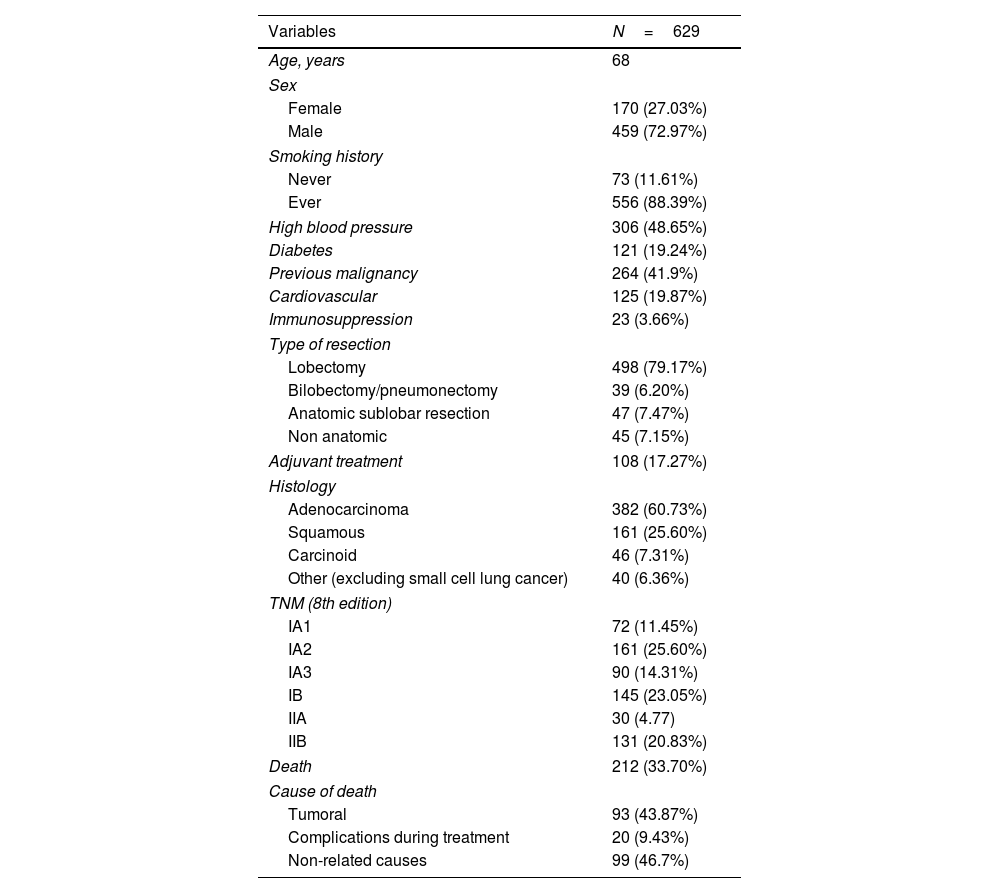
ResultsA total of 629 tumors were resected. Eight patients died during the first 30 days of the postoperative period. The distribution of clinical variables is exposed in Table 1.
Patient Characteristics.
Variables | N=629 |
---|---|
Age, years | 68 |
Sex | |
Female | 170 (27.03%) |
Male | 459 (72.97%) |
Smoking history | |
Never | 73 (11.61%) |
Ever | 556 (88.39%) |
High blood pressure | 306 (48.65%) |
Diabetes | 121 (19.24%) |
Previous malignancy | 264 (41.9%) |
Cardiovascular | 125 (19.87%) |
Immunosuppression | 23 (3.66%) |
Type of resection | |
Lobectomy | 498 (79.17%) |
Bilobectomy/pneumonectomy | 39 (6.20%) |
Anatomic sublobar resection | 47 (7.47%) |
Non anatomic | 45 (7.15%) |
Adjuvant treatment | 108 (17.27%) |
Histology | |
Adenocarcinoma | 382 (60.73%) |
Squamous | 161 (25.60%) |
Carcinoid | 46 (7.31%) |
Other (excluding small cell lung cancer) | 40 (6.36%) |
TNM (8th edition) | |
IA1 | 72 (11.45%) |
IA2 | 161 (25.60%) |
IA3 | 90 (14.31%) |
IB | 145 (23.05%) |
IIA | 30 (4.77) |
IIB | 131 (20.83%) |
Death | 212 (33.70%) |
Cause of death | |
Tumoral | 93 (43.87%) |
Complications during treatment | 20 (9.43%) |
Non-related causes | 99 (46.7%) |
After reaching a median follow-up of 44.32 months, 212 patients (33.70%) died. At the final follow-up, 368 of the patients (88.24%) remained completely free of disease, 37 of them (8.87%) had a relapse of the resected lung tumor, and 12 (2.87%) have developed a different tumor.
The overall survival at 3, 5 and 10 years was 80, 70 and 44% respectively (IA1 92%, 74%, 57%, IA2 87%, 82%, 54%, IA3 77%, 66% 41%, IB 84%, 73%, 42%, IIA 81%, 67%, 37%, IIB 62%, 54%, 38%), with a median survival of 53 months. The cancer-related survival at 3, 5 and 10 years was 90, 83 and 74% respectively (IA1 95%, 81%, 69%, IA2 97%, 94%, 84%, IA3 90%; 81%, 75%, IB 91%, 82%, 75%, IIA 91%, 86%, 67%, IIB 76%, 71%, 64%). The causes of death are displayed in Table 1.
Recurrence-free survival at 3, 5 and 10 years was 76, 70 and 65% respectively (IA1 82%, 79%, 73%, IA2 87%, 83%; 75%, IA3 82%, 76%, 65%, IB 71%, 65%, 62%, IIA 78%, 73%, 66%, IIB59%, 52%, 52%) with a median survival of 48 months.
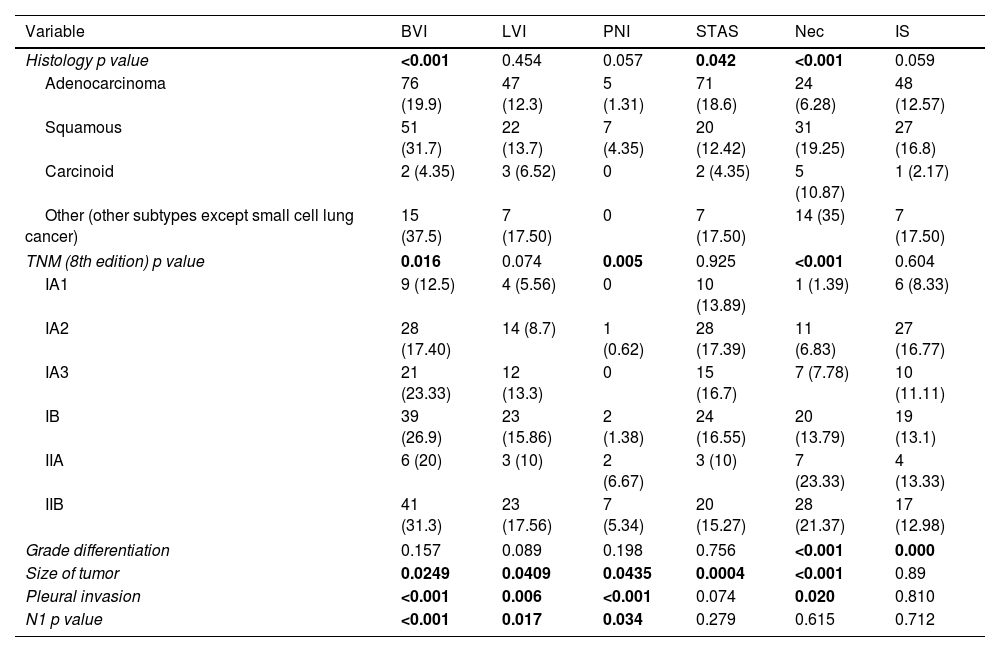
Table 2 shows the distribution of the pathological characteristics of interest in relation with histology, stage, grade of differentiation, tumor size, pleural invasion and nodal invasion (Expanded information in supplementary material).
Tumor Characteristics (N: 629).
Variable | BVI | LVI | PNI | STAS | Nec | IS |
---|---|---|---|---|---|---|
Histology p value | <0.001 | 0.454 | 0.057 | 0.042 | <0.001 | 0.059 |
Adenocarcinoma | 76 (19.9) | 47 (12.3) | 5 (1.31) | 71 (18.6) | 24 (6.28) | 48 (12.57) |
Squamous | 51 (31.7) | 22 (13.7) | 7 (4.35) | 20 (12.42) | 31 (19.25) | 27 (16.8) |
Carcinoid | 2 (4.35) | 3 (6.52) | 0 | 2 (4.35) | 5 (10.87) | 1 (2.17) |
Other (other subtypes except small cell lung cancer) | 15 (37.5) | 7 (17.50) | 0 | 7 (17.50) | 14 (35) | 7 (17.50) |
TNM (8th edition) p value | 0.016 | 0.074 | 0.005 | 0.925 | <0.001 | 0.604 |
IA1 | 9 (12.5) | 4 (5.56) | 0 | 10 (13.89) | 1 (1.39) | 6 (8.33) |
IA2 | 28 (17.40) | 14 (8.7) | 1 (0.62) | 28 (17.39) | 11 (6.83) | 27 (16.77) |
IA3 | 21 (23.33) | 12 (13.3) | 0 | 15 (16.7) | 7 (7.78) | 10 (11.11) |
IB | 39 (26.9) | 23 (15.86) | 2 (1.38) | 24 (16.55) | 20 (13.79) | 19 (13.1) |
IIA | 6 (20) | 3 (10) | 2 (6.67) | 3 (10) | 7 (23.33) | 4 (13.33) |
IIB | 41 (31.3) | 23 (17.56) | 7 (5.34) | 20 (15.27) | 28 (21.37) | 17 (12.98) |
Grade differentiation | 0.157 | 0.089 | 0.198 | 0.756 | <0.001 | 0.000 |
Size of tumor | 0.0249 | 0.0409 | 0.0435 | 0.0004 | <0.001 | 0.89 |
Pleural invasion | <0.001 | 0.006 | <0.001 | 0.074 | 0.020 | 0.810 |
N1 p value | <0.001 | 0.017 | 0.034 | 0.279 | 0.615 | 0.712 |
BVI: blood vessel invasion; LVI: lymphovascular invasion; PNI: perineural invasion; STAS: spread through air spaces; Nec: necrosis; IS: inflammatory stroma. Percentages between parentheses.
Blood vessel invasion, STAS and spontaneous necrosis seem to be distributed differently in the histological types considered. The presence of blood vessel invasion, perineural invasion and also necrosis increased gradually with the increasing of tumoral stage. The presence of necrosis and inflammatory stroma appeared to be related with the grade of differentiation. All the pathological characteristics except inflammatory stroma were present more frequently when the tumor size increased. Finally, blood vessel invasion, lymphovascular invasion and perineural invasion were related with the presence of nodal invasion (Table 2 and supplementary material).
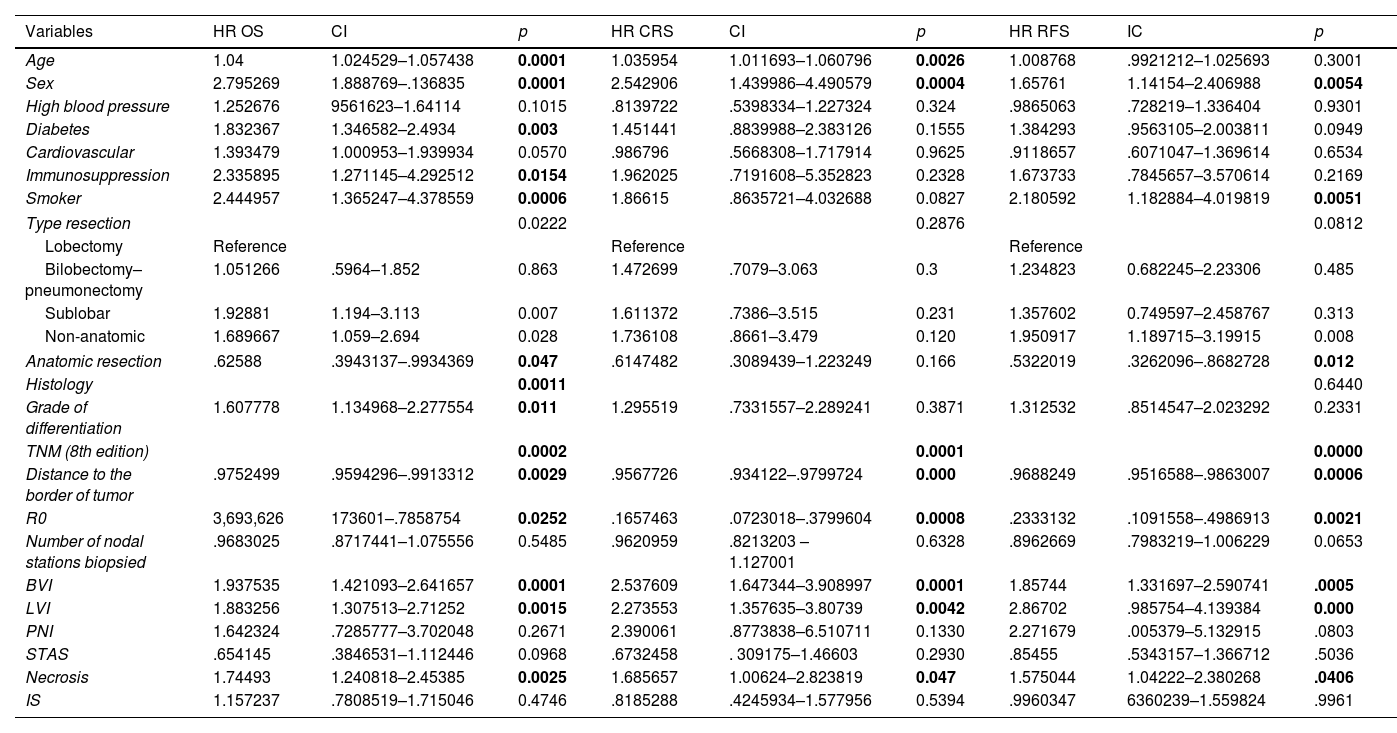
The univariable analysis of patients’ characteristics for CRS and RFS is shown in Table 3.
Univariable Analysis for Overall and Cancer-Related Survival (CRS) and Recurrence-Free Survival (RFS).
Variables | HR OS | CI | p | HR CRS | CI | p | HR RFS | IC | p |
---|---|---|---|---|---|---|---|---|---|
Age | 1.04 | 1.024529–1.057438 | 0.0001 | 1.035954 | 1.011693–1.060796 | 0.0026 | 1.008768 | .9921212–1.025693 | 0.3001 |
Sex | 2.795269 | 1.888769–.136835 | 0.0001 | 2.542906 | 1.439986–4.490579 | 0.0004 | 1.65761 | 1.14154–2.406988 | 0.0054 |
High blood pressure | 1.252676 | 9561623–1.64114 | 0.1015 | .8139722 | .5398334–1.227324 | 0.324 | .9865063 | .728219–1.336404 | 0.9301 |
Diabetes | 1.832367 | 1.346582–2.4934 | 0.003 | 1.451441 | .8839988–2.383126 | 0.1555 | 1.384293 | .9563105–2.003811 | 0.0949 |
Cardiovascular | 1.393479 | 1.000953–1.939934 | 0.0570 | .986796 | .5668308–1.717914 | 0.9625 | .9118657 | .6071047–1.369614 | 0.6534 |
Immunosuppression | 2.335895 | 1.271145–4.292512 | 0.0154 | 1.962025 | .7191608–5.352823 | 0.2328 | 1.673733 | .7845657–3.570614 | 0.2169 |
Smoker | 2.444957 | 1.365247–4.378559 | 0.0006 | 1.86615 | .8635721–4.032688 | 0.0827 | 2.180592 | 1.182884–4.019819 | 0.0051 |
Type resection | 0.0222 | 0.2876 | 0.0812 | ||||||
Lobectomy | Reference | Reference | Reference | ||||||
Bilobectomy–pneumonectomy | 1.051266 | .5964–1.852 | 0.863 | 1.472699 | .7079–3.063 | 0.3 | 1.234823 | 0.682245–2.23306 | 0.485 |
Sublobar | 1.92881 | 1.194–3.113 | 0.007 | 1.611372 | .7386–3.515 | 0.231 | 1.357602 | 0.749597–2.458767 | 0.313 |
Non-anatomic | 1.689667 | 1.059–2.694 | 0.028 | 1.736108 | .8661–3.479 | 0.120 | 1.950917 | 1.189715–3.19915 | 0.008 |
Anatomic resection | .62588 | .3943137–.9934369 | 0.047 | .6147482 | .3089439–1.223249 | 0.166 | .5322019 | .3262096–.8682728 | 0.012 |
Histology | 0.0011 | 0.6440 | |||||||
Grade of differentiation | 1.607778 | 1.134968–2.277554 | 0.011 | 1.295519 | .7331557–2.289241 | 0.3871 | 1.312532 | .8514547–2.023292 | 0.2331 |
TNM (8th edition) | 0.0002 | 0.0001 | 0.0000 | ||||||
Distance to the border of tumor | .9752499 | .9594296–.9913312 | 0.0029 | .9567726 | .934122–.9799724 | 0.000 | .9688249 | .9516588–.9863007 | 0.0006 |
R0 | 3,693,626 | 173601–.7858754 | 0.0252 | .1657463 | .0723018–.3799604 | 0.0008 | .2333132 | .1091558–.4986913 | 0.0021 |
Number of nodal stations biopsied | .9683025 | .8717441–1.075556 | 0.5485 | .9620959 | .8213203 –1.127001 | 0.6328 | .8962669 | .7983219–1.006229 | 0.0653 |
BVI | 1.937535 | 1.421093–2.641657 | 0.0001 | 2.537609 | 1.647344–3.908997 | 0.0001 | 1.85744 | 1.331697–2.590741 | .0005 |
LVI | 1.883256 | 1.307513–2.71252 | 0.0015 | 2.273553 | 1.357635–3.80739 | 0.0042 | 2.86702 | .985754–4.139384 | 0.000 |
PNI | 1.642324 | .7285777–3.702048 | 0.2671 | 2.390061 | .8773838–6.510711 | 0.1330 | 2.271679 | .005379–5.132915 | .0803 |
STAS | .654145 | .3846531–1.112446 | 0.0968 | .6732458 | . 309175–1.46603 | 0.2930 | .85455 | .5343157–1.366712 | .5036 |
Necrosis | 1.74493 | 1.240818–2.45385 | 0.0025 | 1.685657 | 1.00624–2.823819 | 0.047 | 1.575044 | 1.04222–2.380268 | .0406 |
IS | 1.157237 | .7808519–1.715046 | 0.4746 | .8185288 | .4245934–1.577956 | 0.5394 | .9960347 | 6360239–1.559824 | .9961 |
BVI: blood vessel invasion; LVI: lymphovascular invasion; PNI: perineural invasion; STAS: spread through air spaces; IS: inflammatory stroma. Percentages between parentheses.
In the univariable analysis the factors that influenced the OS were sex (p<0.0000), smoking status (p<0.0006), type of resection (p<0.0222), anatomic resection (p<0.047), grade of differentiation (p<0.0111), TNM stage (p<0.0002), Histology (0.011), distance to the resection border (p<0.0029) and achieving R0 (p<0.0252). Cancer-related survival was influenced by sex (p<0.0004), age (p<0.0026), TNM stage (p<0.0001), distance to the resection border (p<0.0001) and achieving R0 (p<0.0008). Recurrence-free survival was mostly influenced by sex (p<0.0054), smoking status (p<0.0051), anatomic resection (p<0.012), TNM stage (p<0.0000) and the distance to the resection border (p<0.0006). When alternative pathological characteristics were analyzed, OS, CRS and RFS were influenced by blood vessel invasion (CRS HR 2.23 CI 1.44–3.46 p<0.0001, RFS HR 1.48 CI 1.05–2.09 p<0.0005) and lymphovascular invasion (CRS HR 1.85 CI 1.09–3.13, p<0.0015, RFS HR 2.40 CI 1.64–3.5 p<0.0001) (Table 3 and supplementary material).
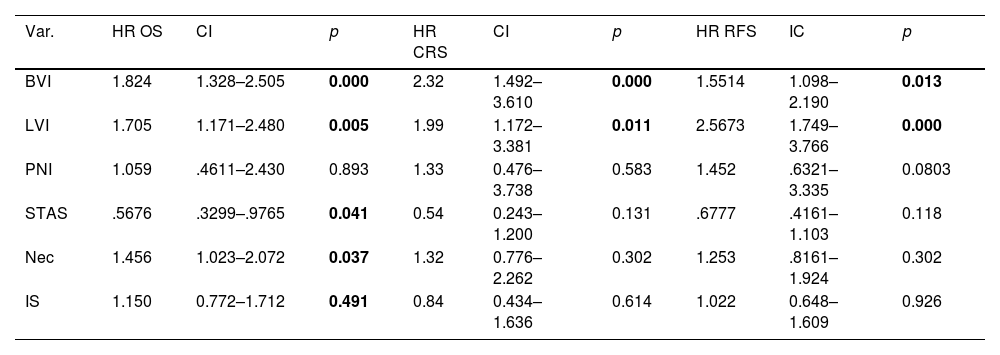
In the multivariable analysis we included the TNM staging and every pathological characteristics. The results are displayed in Table 4 (see also supplementary material).
Multivariable Analysis.
Var. | HR OS | CI | p | HR CRS | CI | p | HR RFS | IC | p |
---|---|---|---|---|---|---|---|---|---|
BVI | 1.824 | 1.328–2.505 | 0.000 | 2.32 | 1.492–3.610 | 0.000 | 1.5514 | 1.098–2.190 | 0.013 |
LVI | 1.705 | 1.171–2.480 | 0.005 | 1.99 | 1.172–3.381 | 0.011 | 2.5673 | 1.749–3.766 | 0.000 |
PNI | 1.059 | .4611–2.430 | 0.893 | 1.33 | 0.476–3.738 | 0.583 | 1.452 | .6321–3.335 | 0.0803 |
STAS | .5676 | .3299–.9765 | 0.041 | 0.54 | 0.243–1.200 | 0.131 | .6777 | .4161–1.103 | 0.118 |
Nec | 1.456 | 1.023–2.072 | 0.037 | 1.32 | 0.776–2.262 | 0.302 | 1.253 | .8161–1.924 | 0.302 |
IS | 1.150 | 0.772–1.712 | 0.491 | 0.84 | 0.434–1.636 | 0.614 | 1.022 | 0.648–1.609 | 0.926 |
Var: variable; BVI: blood vessel invasion; LVI: lymphovascular invasion; PNI: perineural invasion; STAS: spread through air spaces; Nec: necrosis; IS: inflammatory stroma. Percentages between parentheses.
We created a prognostic model for the OS, CRS and RFS with the variables that maintained significance (Table 5).
Harrell's Index, AIC, BIC AUC and Brier Score.
Harrell's I. OS Survival | AIC | BIC | AUC | Brier Score 36 Months | Brier Score 48 Months | |
---|---|---|---|---|---|---|
Current model | ||||||
TNM | 0.6139 | 2355.674 | 2377.831 | 0.55 | 0.18 (0.17–0.19) | 0.19 (0.158–0.22) |
Proposed model | ||||||
TNM+BVI+LVI+necrosis | 0.6531 | 2338.563 | 2374.013 | 0.681 | 0.17 (0.15–0.18) | 0.18 (0.1–0.20) |
Harrell's I. CRS Survival | AIC | BIC | AUC | Brier Score 36 Months | Brier Score 48 Months | |
---|---|---|---|---|---|---|
Current model | ||||||
TNM | 0.6645 | 1085.101 | 1107.101 | 0.623 | 0.07 (0.055–0.088) | 0.082 (0.06–0.09) |
Proposed model | ||||||
TNM+BVI+LVI | 0.7103 | 1071.054 | 1102.073 | 0.713 | 0.07 (0.052–0.085) | 0.07 (0.06–0.09) |
Variables | Harrell's I. Recurrence-Free Survival | AIC | BIC | AUC | Brier Score 36 Months | Brier Score 48 Months |
---|---|---|---|---|---|---|
Current Model | ||||||
TNM | 0.6264 | 2013.016 | 2035.173 | 0.56 | 0.17 (0.15–0.18) | 0.18 (0.169–0.20) |
Proposed Model | ||||||
TNM+BVI+LVI | 0.6794 | 1990.61 | 2021.63 | 0.694 | 0.16 (0.14–0.18) | 0.17 (0.15–0.19) |
Comparison between the models. BVI: blood vessel invasion; LVI: lymphovascular invasion.
The predictive capacity of the TNM system for the OS in our series, measured by the Harrell's Index, was 0.6139. It increased up to 0.6531 in the proposed model (TNM with blood vessel invasion, lymphovascular invasion and tumoral necrosis). The predictive capacity of the TNM system for the CRS in our series, measured by the Harrell's Index, was 0.6645. It increased up to 0.7103 in the proposed model (with TNM, blood vessel invasion and lymphovascular invasion). Parallel, AIC and BIC decreased, confirming that the changes observed in Harrell's index really reflected a better prognostic capacity. Regarding the RFS, the Harrell's index for the TNM staging system in our series was 0.6264, which increased up to 0.6794 in the proposed model (with TNM, blood vessel invasion and lymphovascular invasion), while the AIC and BIC decreased.
As we decided to include non-anatomical resection in our series, we performed a Cox regression analysis with the proposed model and the surgical procedure to evaluate if the latter influenced more than the pathological variables. We were able to see that, although non-anatomic resection influenced survival, when analyzed together with the variables of interest for the study (blood and lymphatic invasion), these remained statistically significant as risk factors, with minimal changes in their respective hazard ratios (supplementary material).
We have made an additional analysis focusing on the Stage I. In the univariable analysis the factors that influenced the OS were age (p<0.001), sex (p<0.0001), smoking status (p<0.003), immunosuppression (p<0.001), type of resection (p<0.048), anatomic resection (p<0.043), TNM stage (p<0.014), histology (0.011), distance to the resection border (p<0.003) and achieving R0 (p<0.0002). Cancer-related survival was influenced by sex (p<0.003), immunosuppression (p<0.011), TNM stage (p<0.0148), distance to the resection border (p<0.001) and achieving R0 (p<0.0001). Recurrence-free survival was mostly influenced by sex (p<0.036), smoking status (p<0.011), type of resection (p<0.0255), anatomic resection (p<0.013), TNM stage (p<0.0181), the distance to the resection border (p<0.001) and achieving R0 (p<0.001) (Tables 22, 28, supplementary material). When alternative pathological characteristics were analyzed, OS, CRS and RFS were influenced by blood vessel invasion (OS HR 1.84, CI 1.22–2.77, p<0.003, CRS HR 2.81, CI 1.60–4.93, p<0.0001, RFS HR 1.93, CI 1.26–2.94, p<0.002), lymphovascular invasion (OS HR 1.93, CI 1.22–3.06, p<0.005, CRS HR 2.68, CI 1.41–5.09, p<0.002, RFS HR 3.17, CI 2.00–5.00, p<0.0001) and also necrosis (OS HR 1.96, CI 1.25–3.09, p<0.003, CRS HR 2.11, CI 1.064–4.19, p<0.032, RFS HR 1.95, CI 1.13–3.38, p<0.016) (Tables 23–24, 29 in the supplementary material).
In the multivariable analysis we included the TNM staging and every pathological characteristics. The results are displayed in supplementary material, Tables 25–26, 30.
We created a prognostic model for the OS, CRS and RFS with the variables that maintained significance (vascular invasion and lymphovascular invasion, Tables 27, 31 supplementary material).
The predictive capacity of the TNM system for the OS in stage I, measured by the Harrell's Index, was 0.5610. It increased up to 0.6184 in the proposed model (TNM with blood vessel invasion, lymphovascular invasion and tumoral necrosis). The predictive capacity of the TNM system for the CRS in stage I, measured by the Harrell's Index, was 0.57. It increased up to 0.6943 in the proposed model (with TNM, blood vessel invasion and lymphovascular invasion). Parallel, AIC and BIC decreased, confirming that the changes observed in Harrell's index really reflected a better prognostic capacity. Regarding the RFS, the Harrell's index for the TNM staging system in our series was 0.5880, which increased up to 0.6736 in the proposed model (with TNM, blood vessel invasion, lymphovascular invasion and necrosis), while the AIC and BIC decreased.
DiscussionThe 8th edition of the TNM staging system stratifies lung cancer patients, correlating their stage with the expected overall survival. It is under continuous revision in order to improve its prognostic capacity.
In this series, we have explored whether other pathological characteristics could complement its predictive information.
The presence of tumoral cells in the vascular lumen could mean that they have traveled through the blood or the lymph to a distant organ and stay as dormant cells, from where they could later grow to become distant metastases. Several authors have explored if both types of vascular invasion were independent prognostic factors with discrepant results. Kessler,11 in a retrospective series of surgical patients confirmed that blood vessel invasion was an independent prognostic factor for overall survival together with the T and the N. Noma,8 using the 8th TNM edition, concluded that the prognosis of the patients in stage IA with blood vessel invasion is similar to that of the stage IB, suggesting that they should be upstaged, a similar conclusion of that of Tsuchiya3 using the previous edition of TNM.
As commented in the introduction, Bodendorf2 confirmed the impact of vascular invasion over the recurrence. Recently, in a multicenter study, Dziedzic12 found that vascular and lymphovascular invasion were associated independently to local and distant metastases.
In our database, lymphovascular invasion influenced both OS and RFS. Recently, Tao13 affirmed that in tumors less than 2 cm, the survival of patients with lymphovascular invasion was equivalent to that of the patients with pleural invasion, and suggested passing these patients to stage T2. Yun14 also demonstrated the negative impact of lymphovascular invasion in OS and RFS in the stage IA, which was even stronger in the sublobar resections, recommending to avoid them, something previously stated by Chen.7 Remarkable is Ruffini's15 conclusion, who affirmed that the effect of vascular invasion in the OS and RFS was so strong that it canceled the influence of tumor size.
Al-Alao6 and Park16 found a relationship between vascular invasion and OS in stages I and II, whilst lymphovascular invasion was related to RFS.
Spontaneous necrosis, related to hypoxia and higher aggressiveness of the tumor,17 emerged as a significant prognostic factor only for OS in our analysis.
The association between the presence of necrosis and OS and RFS has been previously described and used to stratify the patients for treatment by different groups.18–20
Several authors21–23 have stated that STAS may be present in every stage and in every histologic subtype, confirming likewise the negative repercussions on the OS and RFS. We were not able to demonstrate the prognostic significance of STAS, perineural invasion and stroma. A possible explanation is that the high influence of vascular invasion conceals their importance.
Regarding the inflammatory stroma, we could not demonstrate our hypothesis. Kessler11 obtained the same results. He had also introduced other variables, like vascular invasion, which could darken the real influence of the stroma in the survival.
Harrell's index measures the prognostic capacity of a model. It was used to evaluate the inclusion of changes in the 8th edition of the TNM system. Slight increases in Harrell's index served to introduce the modifications. External validations24,25 published after the publication of the 8th edition of the TNM, described the improvements as discrete and slight. In our series, the increase of Harrell's Index was outstanding when adding both types of vascular invasion to the TNM, showing an augmentation of the prognostic capacity of the proposed risk model. As commented, this increase accompanied by the decrease in AIC and BIC support the real improvement of the prognostic capacity of the model. Further prospective studies should confirm these findings in order to see if including them in the pathological classification could be of interest. In addition, a thorough analysis of the survival and recurrence rates in case of vascular or lymphovascular invasion presence is needed to evaluate if it is appropriate to upstage the patient.
There are several limitations in this study. First of all, its retrospective character makes it prone to several errors. In addition, the need to restage those patients operated before 2017, when the new edition started to be used, makes it possible that we could have made mistakes in the process, specially in evaluating the pleural infiltration. Consequently, patients that should have been included in stage IB could have been mistakenly staged in stage IA. This would have negatively impacted the OS and RFS rates. Regarding the modality of treatments, a possible bias could be found because some of the patients received adjuvant therapy due to the stage with the goal of increasing the survival. Nevertheless, adjuvant therapy is meant to increase survival, so it would have contributed to contradicting the main hypothesis of this work.
Additionally, the pathologists may have not described some of these variables along this period. For example, STAS, was accepted as a way of dissemination in 2015. For this reason, the previous pathologic reports could lack of its description even if it was present. Further, without a systematic search for vascular invasion, it could be ignored. This is why homogenization of the techniques to detect vascular invasion remains necessary, making the comparison between studies possible.6,26
On the other hand, a long period of time was revised. For this reason many patients’ information has been lost.
Finally, it could be pointed out that this model is only useful for surgical cases. Nevertheless, vascular invasion can also be identified in some large-core biopsies and, even when these pathological characteristics were only identifiable in surgical cases, their prognostic value should not be underestimated, since pleural involvement can only be accurately evaluated in surgical specimens and was introduced in the TNM classification.
ConclusionIncluding other pathological characteristics such as vascular invasion in the TNM classification could help us better stratify the patients according to their risk of death or recurrence. This could also lead us to include certain patients in a different stage than that in which, with the 8th TNM edition, are classified, and even modify the follow-up or the strategy of treatment. An international prospective study is needed to test other potentially prognostic pathological variables after a necessary homogenization of the detection techniques.
Authors’ ContributionsAll authors have contributed equally to the concept, revision, writing and editing of this work.
Ethical ConsiderationsAll the procedures were performed in compliance with relevant laws and institutional guidelines and have been approved by the appropriate institutional committee. This observational retrospective cohort study was approved by the Ethics Committee of Ramón y Cajal Hospital, 25/03/2021, ID number CEIM 082/21. The Institutional Review Board also waived the need for written informed consent from each patient.
Generative AIThe entire manuscript and supplementary material have not been, neither completely nor partially, produced with the help of any artificial intelligence software or tool.
Meeting PresentationThis work was partially presented at the 30th European conference on General Thoracic Surgery, The Hague, The Netherlands, 19–21 June 2022 as an oral presentation in the Pulmonary neoplastic I session and in the annual conference of the Sociedad Española de Cirugía Torácica (SECT) in Bilbao, 11–13 May 2022.
FundingThis research did not receive any specific grant from funding agencies in the public, commercial, or not-for-profit sectors.
Conflicts of InterestThe authors declare not to have any conflicts of interest that may be considered to influence directly or indirectly the content of the manuscript.
Data Availability StatementThe data underlying this article will be shared on reasonable request to the corresponding author.