


KRAS is the most common driver mutation in lung cancer. ctDNA-based assessment offers advantages over tumor as a minimally invasive method able to capture tumor heterogeneity. Monitoring KRAS mutational load in ctDNA may be useful in the management of the patients.
MethodsConsecutive patients diagnosed with KRAS mutant lung adenocarcinoma in the tumor biopsy were included in this study. Plasma samples were obtained at different time points during the course of the disease. KRAS mutations in plasma were quantified using digital PCR and correlated with mutations in tumor and with radiological response and progression.
ResultsTwo hundred and forty-five plasma samples from 56 patients were analyzed. The rate of detection of KRAS mutations in plasma in our previously characterized KRAS-mutant cases was 82% overall, reaching 96% in cases with more than 1 metastatic location. The dynamics of KRAS mutational load predicted response in 93% and progression in 63% of cases, 33 and 50 days respectively in advance of radiological evaluation. Progression-free survival for patients in whom ctDNA was not detectable in plasma after treatment initiation was significantly longer than for those in whom ctDNA remained detectable (7.7 versus 3.2 months; HR: 0.44, p=0.004).
ConclusionsThe detection of KRAS mutations in ctDNA showed a good correlation with that in tumor biopsy and, in most cases, predicted tumor response and progression to chemotherapy in advance of radiographic evaluation. The liquid biopsies for ctDNA-based molecular analyses are a reliable tool for KRAS testing in clinical practice.
La mutación en KRAS es la mutación iniciadora más común en el cáncer de pulmón. La valoración basada en el ctDNA ofrece ventajas frente a la tumoral, al ser un método mínimamente invasivo capaz de capturar la heterogeneidad del tumor. La monitorización de la carga de KRAS mutado en el ctDNA puede ser útil en el manejo de los pacientes.
MétodosEn este estudio se incluyó, mediante selección consecutiva, a pacientes diagnosticados con adenocarcinoma de pulmón con mutación en KRAS en la biopsia tumoral. Se obtuvieron muestras de plasma en diferentes momentos durante el curso de la enfermedad. Las mutaciones de KRAS en plasma se cuantificaron mediante PCR digital y se correlacionaron con las mutaciones en el tumor y con la respuesta radiológica y la progresión.
ResultadosSe analizaron 245 muestras de plasma de 56 pacientes. La tasa de detección de mutaciones KRAS en plasma en aquellos casos previamente definidos con dicha mutación fue del 82% globalmente, porcentaje que alcanzó el 96% en aquellos casos con más de una ubicación metastásica. La dinámica de la carga de KRAS mutado predijo la respuesta en el 93% de los casos y la progresión en el 63%, a los 33 y 50 días, respectivamente, anteriores a la evaluación radiológica. La supervivencia libre de progresión para pacientes en los que el ctDNA no era detectable en plasma después del inicio del tratamiento fue significativamente más larga que para aquellos en los que el ctDNA permaneció detectable (7,7 frente a 3,2 meses; HR: 0,44; p = 0,004).
ConclusionesLa detección de mutaciones KRAS en el ctDNA mostró una buena correlación con la de la biopsia tumoral y, en la mayoría de los casos, predijo la respuesta tumoral a la quimioterapia y la progresión antes de la evaluación radiológica. Las biopsias líquidas para análisis moleculares basados en ctDNA son una herramienta fiable para la valoración de KRAS en la práctica clínica.
Lung cancer is the leading cause of cancer mortality.1KRAS mutation, the most common driver mutation in NSCLC, is present in approximately 30% of NSCLC patients, mainly in lung adenocarcinoma (LA).2KRAS mutation has been historically believed to be a bad prognostic factor, but studies shows conflicting results.3–5 These may be explained by the heterogeneity within KRAS-driven NSCLC, with different response to chemotherapy depending on the involved codon,6 and by the impact of the presence of other mutations such as TP53 or STK11 concomitant with KRAS.7–9 Despite many efforts, no KRAS-directed targeted therapy has been approved to date.10,11 Recently has been reported results of a phase 1 trial showing great antitumor activity of the AMG 510 inhibitor in cases with the KRASG12C mutation.12 These encouraging results must be confirmed in ongoing clinical trials.
Liquid biopsy to obtain circulating tumor DNA (ctDNA) has been proposed as an alternative to tumor biopsy for molecular assessment. The advantages of ctDNA are several. As a minimally invasive method, it allows a greater frequency of sampling during follow-up and can be used when tumor samples are insufficient for molecular testing. Moreover, the use of ctDNA may better reflect the molecular heterogeneity of the tumor, since it will include ctDNA fragments from all tumor sites.13 We have previously reported the usefulness of ctDNA monitoring for the prediction of treatment outcome in patients with EGFR-mutant NSCLC.14
KRAS mutational load in plasma may be used as a surrogate marker of the global tumor burden in KRAS-mutated NSCLC, and thus monitoring KRAS mutational load in ctDNA may be useful in the management of these patients. The aim of this study was to determine the feasibility of using ctDNA for the detection of KRAS mutations both at the time of diagnosis and, specifically to evaluate the use of serial plasma genotyping for monitoring treatment response.
Materials and methodsStudy populationThis retrospective study included patients diagnosed with tissue characterized KRAS-mutant LA and with available plasma samples between November 2012 and February 2017 at our center. Staging of cases was done according to the American Joint Committee on Cancer Staging Manual, 8th edition.15 Plasma samples were collected before treatment and at different time points during the follow-up (in most cases, every 6 weeks during treatment and every 3 months during follow-up). Treatment response was evaluated with computed tomography (CT) according to RECISTv1.116 following local practice (every 8–9 weeks). The study was approved by the local ethics committee (CEIC 2012/4823/I). All participants gave written informed consent.
Study designThe primary objective of the study was the correlation between ctDNA- and tumor-based detection of mutations. Findings from plasma samples at the time of tumor biopsy were compared with those of the paired tumor biopsy. Agreement was considered positive when KRAS-mutant alleles were detected in plasma in at least 0.1% of frequency. Sensitivity, specificity, positive and negative predictive values were calculated considering tissue biopsy as a gold standard, and using as a negative control plasma samples from 11 cases characterized in tissue as KRAS wild type.
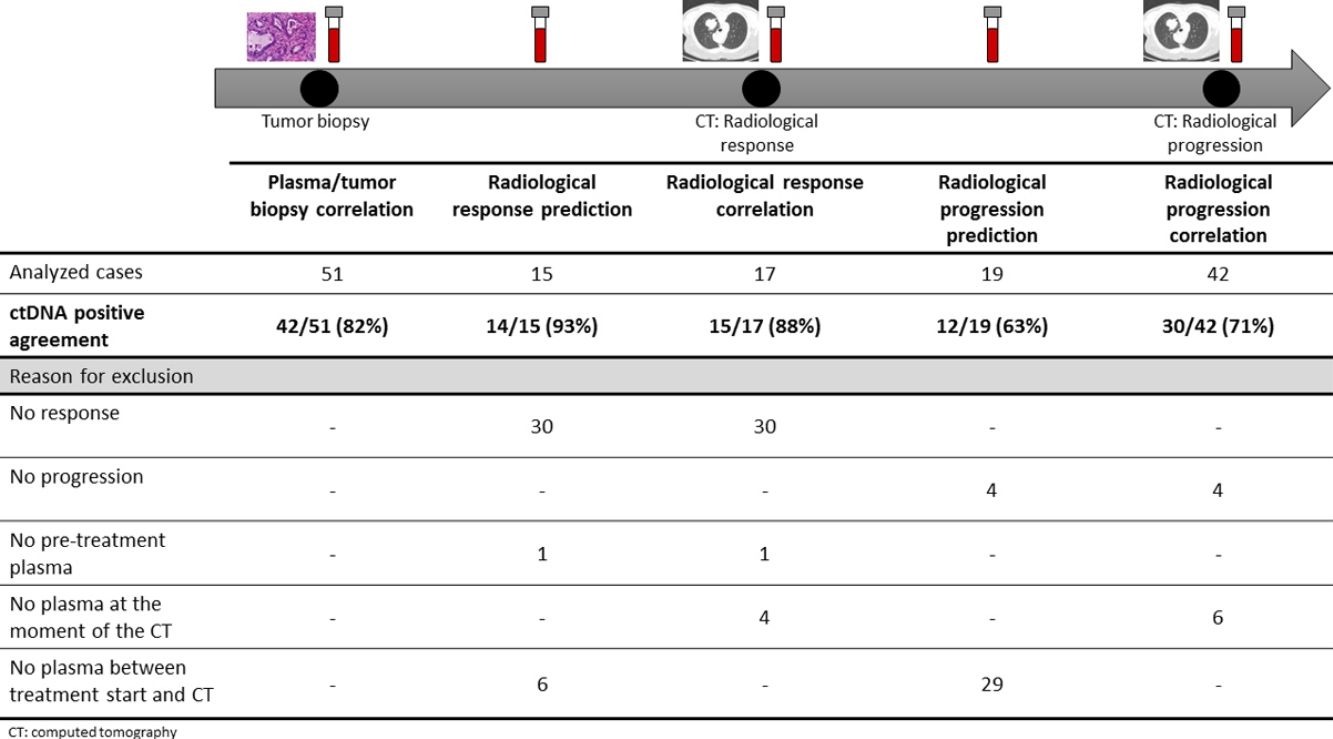
The association between the dynamics of the KRAS mutational load in plasma and radiological response and progression was analyzed for any treatment line received for each patient. The term “treatment line” refers to any administered treatment, including best supportive care. To analyze correlation with response and progression we used plasma samples obtained at the same time as a CT, whereas plasma samples obtained after the start of treatment and prior to the time of a CT were used for the analysis of prediction of response and progression. A positive correlation with/prediction of response was defined as the lack of detection or any level of decrease of KRAS mutational load in the plasma sample at the time (for correlation analysis) or prior to the time (for the prediction study) of the CT showed tumor response. A positive correlation with/prediction of progression was defined as the reappearance or any level of increase of KRAS mutational load in the plasma sample at the time (for correlation analysis) or prior to the time of (for the prediction study) the CT showed progression (Fig. 1).
Sample collection and KRAS mutation assessment
KRAS analysis in tumor tissue was performed in paraffin-embedded biopsies. DNA was extracted from macro-dissected sections of each tumor sample with the QIAamp DNA Mini kit (Qiagen). KRAS mutations (exon 2 and 3) were analyzed by Sanger sequencing using BigDyev3.1 (Applied Biosystems) on a 3500DX Genetic Analyzer (Applied Biosystems).
For ctDNA-based assessment of KRAS mutations, 10–15ml of blood were collected in K2EDTA tubes and processed within 4h of collection. The tubes were centrifuged twice at 1600×g for 15min; plasma was collected, aliquoted in 1ml fractions and frozen at −80°C. KRAS mutations were assessed by digital PCR (dPCR). DNA was extracted from 1ml of plasma using the MagMax (cfDNA) isolation kit (Applied Biosystems) with manual processing. Isolated DNA was quantified using the QubitdsDNA HS assay kit (Life Technologies). The KRAS-mutated allele frequency was quantified by dPCR with a QuantStudio3D dPCR system (Life Technologies) using wet-lab validated dPCR TaqMan Assays (Life Technologies). Used assays are listed in Supplementary Table 1. Mutation analysis was performed with the QuantStudio 3D AnalysisSuite™ Cloud Software (Life Technologies).
Circulating cell-free DNA (cfDNA) refers to the total circulating DNA and ctDNA only to the circulating tumoral DNA. KRAS mutational load was quantified with dPCR using the QuantStudio3D Analysis Suite™ software that expresses the allele frequency as the percentage of mutated copies referred to the total number of gene copies.
Statistical analysesConcordance between tissue and plasma KRAS mutation status was calculated as the number of positive plasma samples out of the total number of tissue samples. Bivariate analyses were performed using the chi-square test. The Kaplan–Meier method was used to estimate progression free survival (PFS). All statistical analyses were performed with IBMR SPSSv.22. Significance was set at p≤0.05.
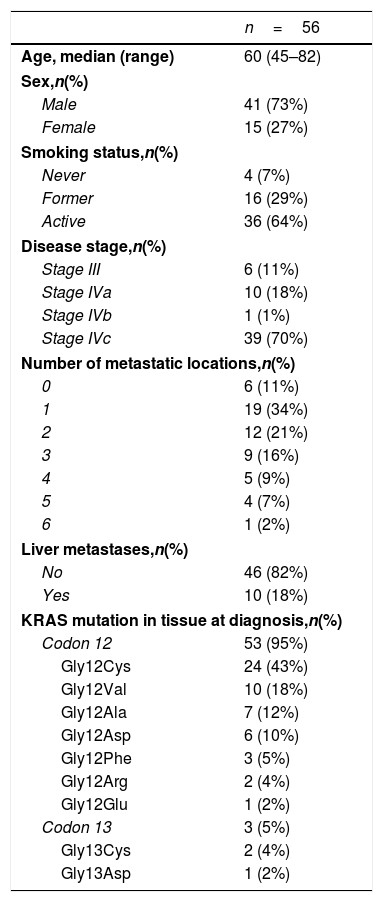
ResultsA total of 245 plasma samples from 56 patients were analyzed. The majority of patients were male (73%), current smokers (64%), had stage IVc disease (70%), and a KRAS mutation involving codon 12(96%) (Table 1).
Patients’ characteristics.
| n=56 | |
|---|---|
| Age, median (range) | 60 (45–82) |
| Sex,n(%) | |
| Male | 41 (73%) |
| Female | 15 (27%) |
| Smoking status,n(%) | |
| Never | 4 (7%) |
| Former | 16 (29%) |
| Active | 36 (64%) |
| Disease stage,n(%) | |
| Stage III | 6 (11%) |
| Stage IVa | 10 (18%) |
| Stage IVb | 1 (1%) |
| Stage IVc | 39 (70%) |
| Number of metastatic locations,n(%) | |
| 0 | 6 (11%) |
| 1 | 19 (34%) |
| 2 | 12 (21%) |
| 3 | 9 (16%) |
| 4 | 5 (9%) |
| 5 | 4 (7%) |
| 6 | 1 (2%) |
| Liver metastases,n(%) | |
| No | 46 (82%) |
| Yes | 10 (18%) |
| KRAS mutation in tissue at diagnosis,n(%) | |
| Codon 12 | 53 (95%) |
| Gly12Cys | 24 (43%) |
| Gly12Val | 10 (18%) |
| Gly12Ala | 7 (12%) |
| Gly12Asp | 6 (10%) |
| Gly12Phe | 3 (5%) |
| Gly12Arg | 2 (4%) |
| Gly12Glu | 1 (2%) |
| Codon 13 | 3 (5%) |
| Gly13Cys | 2 (4%) |
| Gly13Asp | 1 (2%) |
For this correlation study 51 paired tissue and plasma samples were available from 49 patients (Fig. 1). 49 patients were biopsied once and 2 patients twice (in these two cases, the second biopsy was performed at the time of progression). The median time from tumor biopsy to blood withdrawal was 19 days (range: −56 to 94) (Supplementary Table 2).
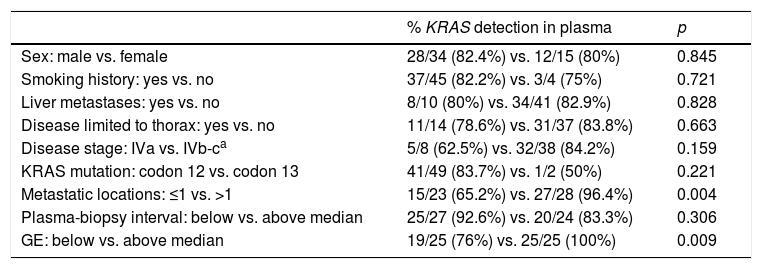
A positive correlation between plasma and tumor KRAS mutational status was observed in 42 cases (82.4%) (Fig. 1). The rate of detection of KRAS mutations in plasma was significantly higher in patients with more than one metastatic location (96.4% vs. 65.2%; p=0.004). The case with more than 1 metastatic location in which plasmatic KRAS was not detected, had only 2 metastatic locations (bone and liver). The median cfDNA obtained from the plasma samples was 3595.12 genomic equivalents (GE)/ml (range: 307.4–197,978.54). The rate of KRAS mutation detection was significantly lower in samples with a cfDNA burden below the median (76% vs. 100%; p=0.009). The presence of more than one metastatic location was significantly associated with a cfDNA burden above the median (p=0.028). The 6 cases with negative plasma-tissue correlation had the GE/ml below the median and only one metastatic location. Type of KRAS mutation (codon12 vs. codon13), presence of liver metastases, sex, smoking history, and time from tumor biopsy to blood withdrawal were not associated with the rate of detection of KRAS mutations in plasma (Table 2).
Bivariate analysis between KRAS detection ratio and clinical characteristics.
| % KRAS detection in plasma | p | |
|---|---|---|
| Sex: male vs. female | 28/34 (82.4%) vs. 12/15 (80%) | 0.845 |
| Smoking history: yes vs. no | 37/45 (82.2%) vs. 3/4 (75%) | 0.721 |
| Liver metastases: yes vs. no | 8/10 (80%) vs. 34/41 (82.9%) | 0.828 |
| Disease limited to thorax: yes vs. no | 11/14 (78.6%) vs. 31/37 (83.8%) | 0.663 |
| Disease stage: IVa vs. IVb-ca | 5/8 (62.5%) vs. 32/38 (84.2%) | 0.159 |
| KRAS mutation: codon 12 vs. codon 13 | 41/49 (83.7%) vs. 1/2 (50%) | 0.221 |
| Metastatic locations: ≤1 vs. >1 | 15/23 (65.2%) vs. 27/28 (96.4%) | 0.004 |
| Plasma-biopsy interval: below vs. above median | 25/27 (92.6%) vs. 20/24 (83.3%) | 0.306 |
| GE: below vs. above median | 19/25 (76%) vs. 25/25 (100%) | 0.009 |
GE: genomic equivalents.
Circulating KRAS mutations were not detected in any of the 11 negative control cases. Sensitivity for KRAS detection in plasma was 0.82 and specificity 1. The positive and negative predictive values were 1 and 0.55 respectively.
In order to avoid the heterogeneity, data were analyzed excluding on one hand the two biopsies performed at the time of progression, and on the other hand cases with stage III disease. In the 49 cases biopsied at the initial diagnosis, a positive correlation between plasma and tumor KRAS mutational status was observed in 40 (81.6%). As shown in the overall population, the rate of detection of KRAS mutations in plasma was significantly higher in cases with more than one metastatic location (96.2% vs. 55.6%; p=0.002). No significant differences in the detection rate were found when cases were analyzed according to the different clinical characteristics. When the 6 cases with stage III excluded from the analysis, the rate of KRAS detection in plasma in cases with a stage IV disease stage was 80.4%. This rate was higher in cases with more than one metastatic location (96.4% vs. 55.6%; p=0.001).
Dynamics of KRAS mutational load and disease monitoringIn the analysis of correlation and prediction of response and progression to treatment, plasma samples from 32 patients, who received a total of 52 treatment lines, were included. The median number of treatment lines analyzed per patient was 1 (range: 0–5). Most cases were treated with chemotherapy (72%). In the five patients who did not receive any treatment, plasma samples were collected both at diagnosis and disease progression. The radiological evaluation of 50% of the treatment lines was classified as progressive disease. Clinical characteristics of cases are summarized in Supplementary Table 3, and details on analyzed treatment lines of each case in Supplementary Table 4.
Overall, the mean percentage of circulating KRAS mutant alleles was lower at the time of radiological response (0.4%; standard deviation (SD): 0.87) than at pre-treatment (3.32%; SD: 5.46) and higher at radiological progression (4.63%; SD: 7.69) (Supplementary Figure 1).
Correlation of KRAS mutational load with radiological response and progression17 (33%) of the 52 treatment lines were included in the analysis of correlation with radiological response (Fig. 1). In 15 (88%) of the 17 cases, there was a positive correlation between the dynamics of the KRAS mutational load and radiological response (Fig. 1). The KRAS mutational load decreased in 6 cases and was not detectable in 9 at response evaluation. One of the 2 cases without a positive correlation had stage III disease and the other one had bone as the sole metastatic location.
42 (80%) of the 52 treatment lines were included in the analysis of correlation with radiological progression (Fig. 1). In 30 (71%) of cases, there was a positive correlation between the dynamics of KRAS mutational load and radiological progression. The KRAS mutational load increased in 21 cases and reappeared in 9. No significant differences in the agreement rate with response or progression were observed when cases were analyzed according to the different clinical characteristics.
The mean reduction of ctDNA at the time of radiological response compared to initial levels in the 16 cases with radiological response and available plasma was 64.7% (range: −100 to 140), whereas the mean increase of ctDNA at the time of radiological progression compared to ctDNA levels at the moment of radiological response (or before treatment initiation in case of non-responders) in the 42 progressing cases with available plasma was 3104% (range: −100 to 44,059) (Fig. 2).

In seven cases within this cohort, no plasma sample was available at the time of tumor biopsy and were thus not evaluable for the ctDNA- and tumor-based correlation study, and only second or subsequent treatment lines could be evaluated. When these 7 cases were excluded from the analysis, the rate of concordance between the dynamics of plasma and radiological response and progression were 93.3% and 68.6% respectively.
KRAS mutational load for prediction of radiological response and progression15 (29%) of the 52 treatment lines from 32 patients were included in the analysis of prediction of radiological response (Fig. 1). In 14 (93%) of the 15 cases, the dynamics of the KRAS mutational load were able to predict radiological response (Fig. 1). The KRAS mutational load decreased in 8 cases and was undetectable in 6 at response. The case where radiological response was not predicted had bone as the sole metastatic location. In cases where radiological response was predicted, the median time elapsed between obtaining the plasma for the analysis of prediction of response and the CT that stated the radiological response was 33 days (range: 14–67).
19 (36%) of the 52 treatment lines were included in the analysis of prediction of radiological progression (Fig. 1). In 12 (63%) of the 19 cases, the dynamics of KRAS mutational load were able to predict radiological progression (Fig. 1). The KRAS mutational load increased in 8 cases and reappeared in 4. In cases where radiological progression was predicted, time elapsed between obtaining the plasma for the analysis of prediction of progression and the CT that stated the disease progression was 50 days (range: 13–120). No significant differences in the rate of prediction of radiological response or progression were shown when cases were analyzed according to the different clinical characteristics (Supplementary Table 5).
The ratio of prediction of radiological response and progression when the 7 cases without available plasma sample at the time of tumor diagnostic was 92.3% and 61.1% respectively.
PFS was significantly longer for those patients with a ctDNA clearance after treatment initiation, compared to those with a ctDNA persistence during treatment (7.7 versus 3.2 months; HR: 0.44, p=0.004) (Fig. 3). No differences in PFS were shown depending on pre-treatment ctDNA levels. Graphic representation of cases in which plasmatic KRAS kinetics were predictive and not predictive of clinical outcome is shown in Fig. 4 and Supplementary Figure 2, respectively.

 and one non-responder patient (D).")
The rate of detection of KRAS mutations in plasma was 82% overall, reaching 96% in cases with more than 1 metastatic location. These results are similar to those previously reported by our group in EGFR-mutated NSCLC,14 and better than the 64% accuracy for plasmatic KRAS mutation detection reported by Sacher et al.17 This difference may be explained by the difference in the disease burden between the two populations. The percentage of cases with less than 4 metastatic locations in the study of Sacher et al. was more than 90% compared with 75% in our series. In both studies, the rate of mutation detection increased with the number of metastatic locations.
The correlation between ctDNA- and tumor-based detection on KRAS mutations was lower in plasma samples with a low cfDNA burden, which is a surrogate marker of the number of cells represented by the circulating DNA in the plasma sample. Low cfDNA indicates limited DNA shedding from the tumor and limits the sensitivity for detecting mutant tumoral DNA. These findings are in line of previously reported data with EGFR-mutated cases,14,18 and suggests that in cases where KRAS mutations are not detected in plasma samples with a low cfDNA burden, either additional sampling may be warranted to increase the amount of evaluable DNA or, alternatively, a tumor biopsy should be performed.
The most novel aspect of this study was the evaluation of the utility of serial plasma genotyping for monitoring treatment response and progression. Our findings confirm the feasibility of ctDNA-based analysis in monitoring treatment outcomes. The decrease of the circulating KRAS mutational load correlated with radiological response in 93% and with progression in 71% of cases in our study. Furthermore, the dynamics of KRAS mutational load were able to predict radiological response more than one month in advance of radiographic evaluation in almost 90% of cases, and radiological progression in 63% of cases. The lower prediction and correlation with progression may be due to the presence of resistance mechanisms not detectable by our assays. As previously reported in the EGFR setting,14,19–21 the circulating KRAS clearance during treatment was associated with longer PFS. The fact that the time between plasma sampling and CT was different among patients suggests that ctDNA clearance may not be detected in all cases and implies that these results must be interpreted with caution.
The utility of liquid biopsy to predict treatment outcomes has been previously reported, mainly in EGFR-mutated cases.21,22 Several studies have evaluated the relationship between plasmatic KRAS status and response to chemotherapy with conflicting results.23–26 Recently, the monitoring of circulating KRAS mutations has been proposed as a tool for discriminating pseudo-progression from true progression to immunotherapy in KRAS-mutated LA.27
As this study was performed in a real-life setting, it has some inherent limitations. Plasma samples were collected when patients attended the outpatient clinic, which depended on the clinical evolution and toxicities, as well as other logistic parameters. Then, plasma sampling times were not scheduled uniformly and were thus not homogeneous for all patients. In addition, the use of a single-gene PCR assay implies that we were not able to evaluate the impact of concurrent mutations other than KRAS especially at the time of progression disease. The use of next generation sequencing techniques with panels covering a wide spectrum of hotspot genes or even the sequencing of the whole exome or genome, is providing important information about the role of these concomitant mutations, that may have a role as predictive biomarkers for response to immunotherapy.8,9 The genotyping of plasmatic KRAS will be crucial if the long awaited KRAS targeted therapy reaches the clinics.
Serum markers like soluble fragment of cytokeratin 19 (CYFRA21-1), carcinoembryonic antigen (CEA), neuron-specific enolase (NSE), and cancer antigen (CA)-125, has been studied in lung cancer. Its prognostic significance is controversial, with conflicting results between studies.28–32 It seems that the elevation of more than one tumor markers at baseline have been related with poor prognosis more consistently that the elevation of one isolated marker.33–35 Regarding the use of circulating tumor markers for the prediction of response to chemotherapy, the decrease of CYFRA21-1 after treatment initiation has been related with response in some studies.31,36,37 The use of this circulating tumor markers is not currently recommended for the management of lung cancer.
In conclusion, ctDNA-based assessment of KRAS mutations showed a good correlation with tumor-based detection and, in most cases, predicted tumor response and progression well in advance of radiographic evaluation. Our findings indicate that liquid biopsies for ctDNA-based molecular analyses are a reliable tool for KRAS testing in clinical practice.
Author contributionsAT identified patients for the study, performed the statistical analyses and wrote the manuscript; PR, AH and EA identified patients for the study; LC, RL, SC, LH and CF processed the samples and performed the mutational analysis; JA, BB and EA supervised the study, wrote and revised the manuscript. All authors read and approved the final manuscript.
FundingThis work was supported by grants from Fundació La Marató de TV3 (666/C/2013); ISCiii/FEDER (CIBERONC CB16/12/00241, RD12/0036/0051, PIE15/00008, PI15/00146, PI16/00591, PI13/00140); Xarxa de Bancs de Tumors (XBTC); Agència de Gestió d’Ajuts Universitaris i de Recerca (AGAUR), Generalitat de Catalunya (2017SGR507) and Fundació Cellex.
None of the sponsors had any role in study design; in the collection, analysis and interpretation of data; in the writing of the report; or in the decision to submit the article for publication.
Conflict of interestAuthors declare no conflicts of interest related to the current work. AT reports personal fees and non-financial support from Roche and Boehringer-Ingelheim; non-financial support from Lilly and personal fees from BMS, MSD and Pfizer. EA reports personal fees and non-financial support from BMS, personal fees from Astra Zeneca, grants, personal fees and non-financial support from Roche, personal fees and non-financial support from MSD, personal fees from Lilly, grants and personal fees from Pfizer, personal fees from Boehriger-Ingelheim. BB has received honoraria for speaker, consultancy or advisory role from Astra-Zeneca, Biocartis, Merck-Serono, Novartis, Pfizer, Qiagen, La Roche and ThermoFisher.
The following are the supplementary data to this article:


