


Pulse transit time (PTT) is the time that a pulse wave takes to travel between two different arterial points, and may be useful in estimating blood pressure. This noninvasive technique, which does not add any cost to the procedure, offers the advantage of avoiding ‘arousals’ during sleep measurement as it occurs with ambulatory blood pressure monitoring (ABPM). We aim to confirm the usefulness of PTT for the detection of hypertension, and to study the correlation between both the measurements.
MethodsProspective observational study in a multidisciplinary sleep unit. We recruited 30 consecutive patients attending a sleep clinic and ran a baseline polysomnography followed by an ABPM the following day. Average systolic and diastolic blood pressure (SBP, DBP) by PTT were calculated and compared with ABMP results. In accordance with international guidelines, patients with mean nocturnal ABMP≥120/70mmHg were diagnosed as having arterial hypertension.
ResultsMean age was of 60years; 66% were male, of whom 80% suffered from sleep apnoea (OSAS). Taking the ABPM as the reference technique, we found that the diagnostic sensitivity of PTT is 85% with a specificity of 88% in the case of SBP, with a positive predictive value of 85% and negative predictive value of 88%. By studying the relationship between mean SBP measured by ABPM and PTT, we found a linear correlation coefficient (R) of 0.88, showing a distribution of all subjects with a difference of ±15mmHg between the tests. There is also a positive correlation between mean DBP measured for the two tests and with a weaker linear correlation.
ConclusionsPulse transit time shows a strong correlation with blood pressure (measured by ABPM). PTT provides continuous, non-invasive, cuffless blood pressure monitoring free of additional cost and could be an alternative for screening hypertension.
La relación causal entre el síndrome de apneas e hipopneas de sueño (SAHS) y la hipertensión arterial (HTA) es un hecho establecido en la literatura. El tiempo de tránsito de pulso (PTT) representa el tiempo que tarda el pulso en viajar entre 2 puntos arteriales diferentes, y puede ser útil en la estimación de la presión arterial (PA). Con este estudio se pretende valorar la utilidad del PTT en la estimación de la PA, ya que además de ser una técnica no invasiva y exenta de coste adicional, ofrece la ventaja de evitar arousals, como sucede con la monitorización ambulatoria de la PA (MAPA).
MétodosEstudio prospectivo y observacional realizado en una unidad multidisciplinar de sueño con la colaboración del servicio de Nefrología. Se reclutaron 30 pacientes consecutivos que acuden a consulta de sueño por sospecha de SAHS a los que se les realiza una polisomnografía (PSG) basal seguida de MAPA al día siguiente. Se calcula la PA sistólica (PAS) y la diastólica (PAD) media por PTT en la PSG y se compara con los resultados de la MAPA. Se diagnosticaron como pacientes con hipertensión arterial aquellos con cifras medias de MAPA durante la noche iguales o superiores a 120/70mmHg, siguiendo normativas internacionales.
ResultadosEdad media de 60años (66% varones). El 80% eran SAHS (36% SAHS grave). La validez diagnóstica de HTA del PTT con respecto a la MAPA considerada como técnica de referencia fue: sensibilidad, 85%; especificidad, 88%; valor predictivo positivo, 85%, y valor predictivo negativo, 88%. El coeficiente de correlación lineal (R) entre la PAS media medida por MAPA durante la noche (desde las 24:00h del día siguiente hasta las 6:00h) y por PTT fue de 0,88, con un coeficiente de correlación intraclase de 0,88 (intervalo de confianza: 0,76–0,94), observándose una distribución de todos los sujetos entre ±15mmHg de diferencia entre las pruebas.
ConclusionesExiste una correlación positiva entre el PTT y la MAPA en la HTA sistólica. El PTT podría ser una alternativa capaz de ofrecer una medición continua y no invasiva de cribado de HTA no conocida o mal controlada.
The association between obstructive sleep apnea-hypopnea syndrome (OSAHS) and hypertension (HT) has been widely studied since the 1980s, and is now fully accepted in the literature. It is estimated that 30% of the patients with systemic HT have moderate or severe OSAHS,1,2 while between 45% and 68% of OSAHS patients have HT.3,4
A direct relationship has been observed between the severity of OSAHS and the probability of suffering hypertension, to the extent that OSAHS is considered as the most common cause of secondary systolic hypertension.5–10 Furthermore, despite medical treatment, over 50% of the hypertensive population does not achieve target blood pressure (BP) goals. A total of 10% have persistently inadequate BP control, despite therapeutic compliance with more than three drugs (one of which is generally a diuretic) at optimal doses. This phenomenon is known as resistant HT11 and is associated with a greater incidence of cardiovascular episodes and complications.12 Several studies show a high rate of OSAHS (greater than 70%) in patients with resistant HT.10,13
The aim of early detection of hypertension and appropriate control with medication is to prevent cardiovascular complications and reduce high healthcare costs.14 Continuous positive airway pressure (CPAP) in OSAHS patients with poorly controlled systolic HT provides better systolic control and even leads to recovery of the nocturnal dipper pattern, resulting in an improved prognosis.15
Given the variability of HT, various strategies for determining this parameter have been designed, each providing complementary information: BP measurement at a specific time point, self-measured BP (SBPM) and 24-h ambulatory BP monitoring (ABPM).
ABPM has become the reference technique for the diagnosis of HT. An average daytime or active value of <130/85mmHg, an average nocturnal or resting value of <120/70mmHg, and <125/80mmHg for the 24-h period have been accepted as the normal limits. This technique consists of a Holter or automatic monitoring of BP every 15min during the day and every 30min at night, according to the recommendations of the European Society of Hypertension and the European Cardiology Society in their 2007 guidelines on the management of HT.14
However, although it is indicated in the guidelines as the reference non-invasive method, this technique has various limitations. Firstly, continuous recording is impossible and variations occurring over short periods throughout the night may be missed. Moreover, inflation of the cuff may affect not only the quality of sleep, by causing small arousals, but can also produce changes in the measurement of nocturnal BP.16 Finally, the discomfort of wearing the cuff for 24-h periods makes it difficult to recruit participants for research studies, or to persuade patients to agree to repeat these measurements over time, with the consequent loss of data.
At the other extreme, arterial catheterization, considered the gold standard, is too invasive to be considered a practical method for the diagnosis of HT.
An electrocardiogram and a pulse oximetry are standard techniques applied during a sleep study, and these procedures also permit the detection of the pulse wave or curve. From these two recordings, that do not involve any additional cost, the pulse transit time (PTT) can be estimated, thus providing continuous BP measurement.17,18
The aim of our study was to evaluate the correlation between the BP measurement obtained by ABPM (during the night) and by PTT using polysomnography (PSG) and also to evaluate the usefulness of PTT in the diagnosis of unknown or poorly controlled HT in patients monitored in a sleep unit.
Materials and MethodsProspective, observational study performed in a Multidisciplinary Sleep Unit, in association with the Department of Nephrology of the same hospital.
Inclusion of PatientsA total of 35 consecutive patients attending the sleep-disordered breathing clinic for the first time due to a clinical suspicion of OSAHS who required a baseline nocturnal PSG (Somnoscreen plus, SOMNOmedics, analyzed with DOMINO software, version 2.5.0) were selected. Inclusion criteria were age over 18 years, no known sleep-disordered breathing and agreement to undergo ABPM the following day.
Exclusion of PatientsPSG with a recorded sleep time of less than 3h was considered invalid. A total of 5 patients were excluded from the analysis for this reason.
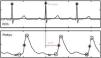
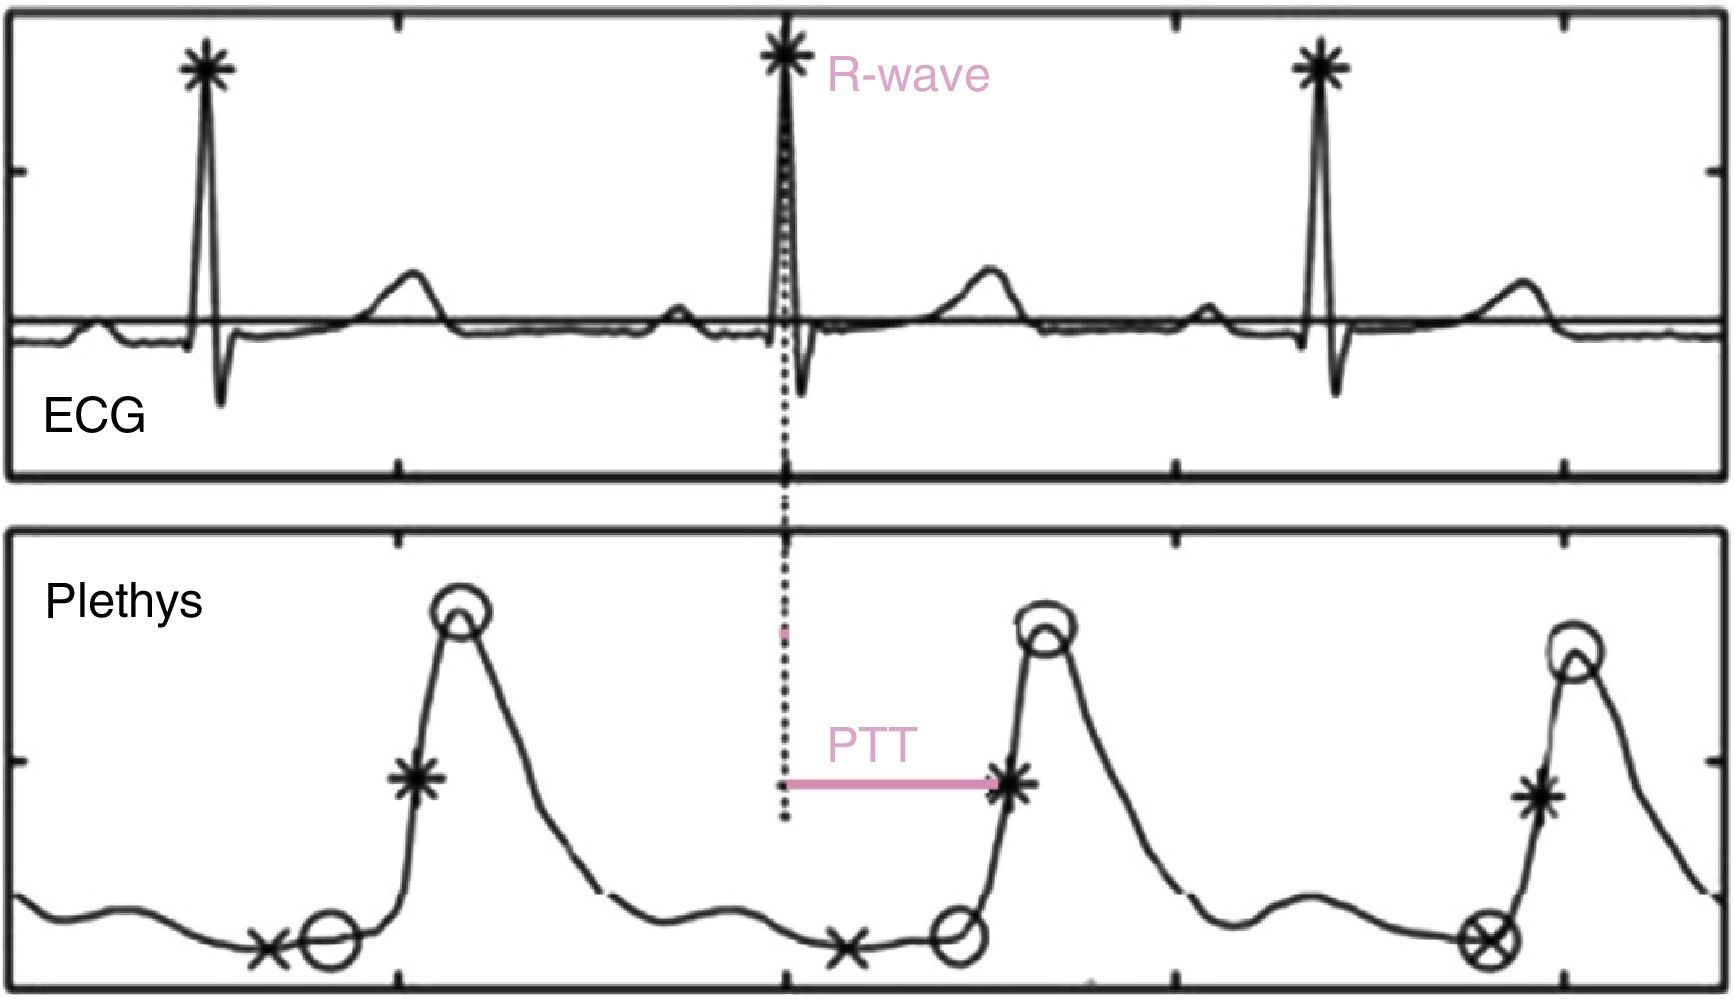
Measurement of Pulse Transit TimeTo determine PTT, the time between the R-wave on the electrocardiogram (representing ventricular contraction and start of ejection) and the arrival of the pulse wave in the plethysmography sensor (pulse oximeter) clipped on the subject's finger is calculated (Fig. 1). Variations in BP can be recorded by monitoring changes in PTT.19
The speed at which the BP wave is transmitted is directly and almost linearly proportional to BP. A sudden increase in BP involves an increase in vascular tone that increases the rigidity of the arterial wall and shortens the PTT. Contrariwise, a reduction in BP involves a reduction in vascular tone that translates to an increase in PTT.20
Since the speed of the pulse wave is related with arterial elasticity (which, in turn, is associated with age, vascular disease, etc.), it is important to adjust the pulse wave speed to the BP of each subject and calibrate the measurement.
For this purpose, after the PSG was arranged and set up, the patient was instructed to lie down (with a resting time of 5min in a sitting position), and BP was measured with a sphygmomanometer on three separate occasions with an interval of at least 5min between measurements. Measurements were taken on the arm contralateral to the one carrying the pulse oximeter (to avoid any modification in the pulse wave speed). Since the PSG recording was already in progress, when each BP measurement was obtained with the patient awake, a mark was simultaneously made on the sleep study recording so that the BP value obtained with the sphygmomanometer at that specific time could be inserted later and correlated with the PTT at the same time. This personalized calibration method optimized measurements by monitoring the influence of the patient's arterial rigidity. Making three measurements provides an additional quality control by avoiding artifact areas in the calibration.
From this ratio, systolic and diastolic blood pressure (SBP and DBP, respectively) can be calculated automatically throughout the whole sleep recording for each patient using the DOMINO software, version 2.5.0.
The next morning, a report of the SBPs and DBPs observed during the night was issued along with the PSG report, and the patient was classified as hypertensive or non-hypertensive, using the cut-off point suggested by the guidelines for nocturnal ABPM (120/70mmHg).
24-h Ambulatory Blood Pressure MonitoringThe morning after the sleep study, the patient was assessed by the Department of Nephrology and a control ABPM study (SPACE LABS model 90217) was carried out over the next 24h, using a validated device. By way of precaution, the cuff size was confirmed to be appropriate for the size of the patient's arm and he/she was instructed to carry out his/her normal activities while abstaining from strenuous exercise, and to keep his/her arm outstretched and motionless during cuff inflation.
BP was measured automatically every 15min during the day (06:00–24:00h) and every 30min during the night (24:00–06:00h). The BP thresholds for defining HT with various types of determinations are 130–135mmHg for SBP and 85mmHg for DBP for the daytime and 120mmHg for SBP and 70mmHg for DBP at night.
After the patient returned the ABPM device, the results were read and interpreted using these cutoff points by a nephrologist in the clinic who was unaware of the values obtained from the sleep study, and the patient was re-classified as hypertensive or not according to the nocturnal recording (from 24:00h to 06:00h). Thus, the final diagnosis was established on the basis of the information provided by the ABPM (reference technique) and the patients were classified into 4 categories: non-hypertensives (those with no previous personal history of HT and ABPM within normal values), well-controlled hypertensives (those with previous personal history of hypertension and so receiving treatment and ABPM within normal values), poorly controlled hypertensives (those with previous personal history of hypertension and nocturnal HT on ABPM despite treatment), and not previously identified hypertensives (those with no previous history of hypertension and ABPM reflecting nocturnal HT).
Statistical AnalysisThe variables analyzed showed an approximately normal distribution, and therefore were described using means and standard deviation. Since the aim was to evaluate the concordance between the two methods of measuring BP, the intra-class correlation coefficients and their corresponding 95% confidence intervals (CI) were calculated from a two-way analysis of variance (ANOVA) model. The two sources of variability considered were the patient and the technique used to measure BP.
The linear correlation coefficient was also calculated and Bland–Altman plots were obtained to determine possible patterns or systematic errors in the measurements.
To calculate the diagnostic value, sensitivity, specificity, positive predictive value (PPV) and negative predictive value (NPV) were obtained for mean SBP and DBP. Finally, to evaluate the diagnostic capacity of the mean SBP values measured by PSG, the ROC curve was calculated.
ResultsA total of 30 of the 35 selected patients met the validity criteria of the polysomnographic recording (total sleep time>3h) and were included in the study. The majority of patients were male (66%), obese (mean body mass index, 31), with a mean age of 60 years. A total of 24 patients (80%) of those included in the sample had OSAHS (mean apnea-hypopnea index, 27), of which 11 (36%) were severe. Eighteen (60%) had a previous diagnosis of HT and were receiving medical treatment, and 11 of these were poorly controlled. Patient characteristics are listed in Table 1.
Clinical Characteristics of Patients.
| Age (years) | 59.77±12.77 |
| Sex (male) | 20 (66.7%) |
| BMI (kg/m2) | 30.68±6.63 |
| OSAHS | 24 (80%) |
| Severe OSAHS | 11 (36%) |
| API | 26.86±24.77 |
| History of HT | 18 (60%) |
| Resistant HT (3 or more drugs) | 8 (26.6%) |
| Well-controlled HT | 7 (23%) |
| Poorly controlled HT | 11 (33%) |
| Unidentified HT | 2 (6%) |
| No HT | 10 (30%) |
HT: hypertension; AHI: apnea-hypopnea index; BMC: body mass index; OSAHS: obstructive sleep apnea-hypopnea syndrome.
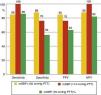
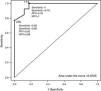
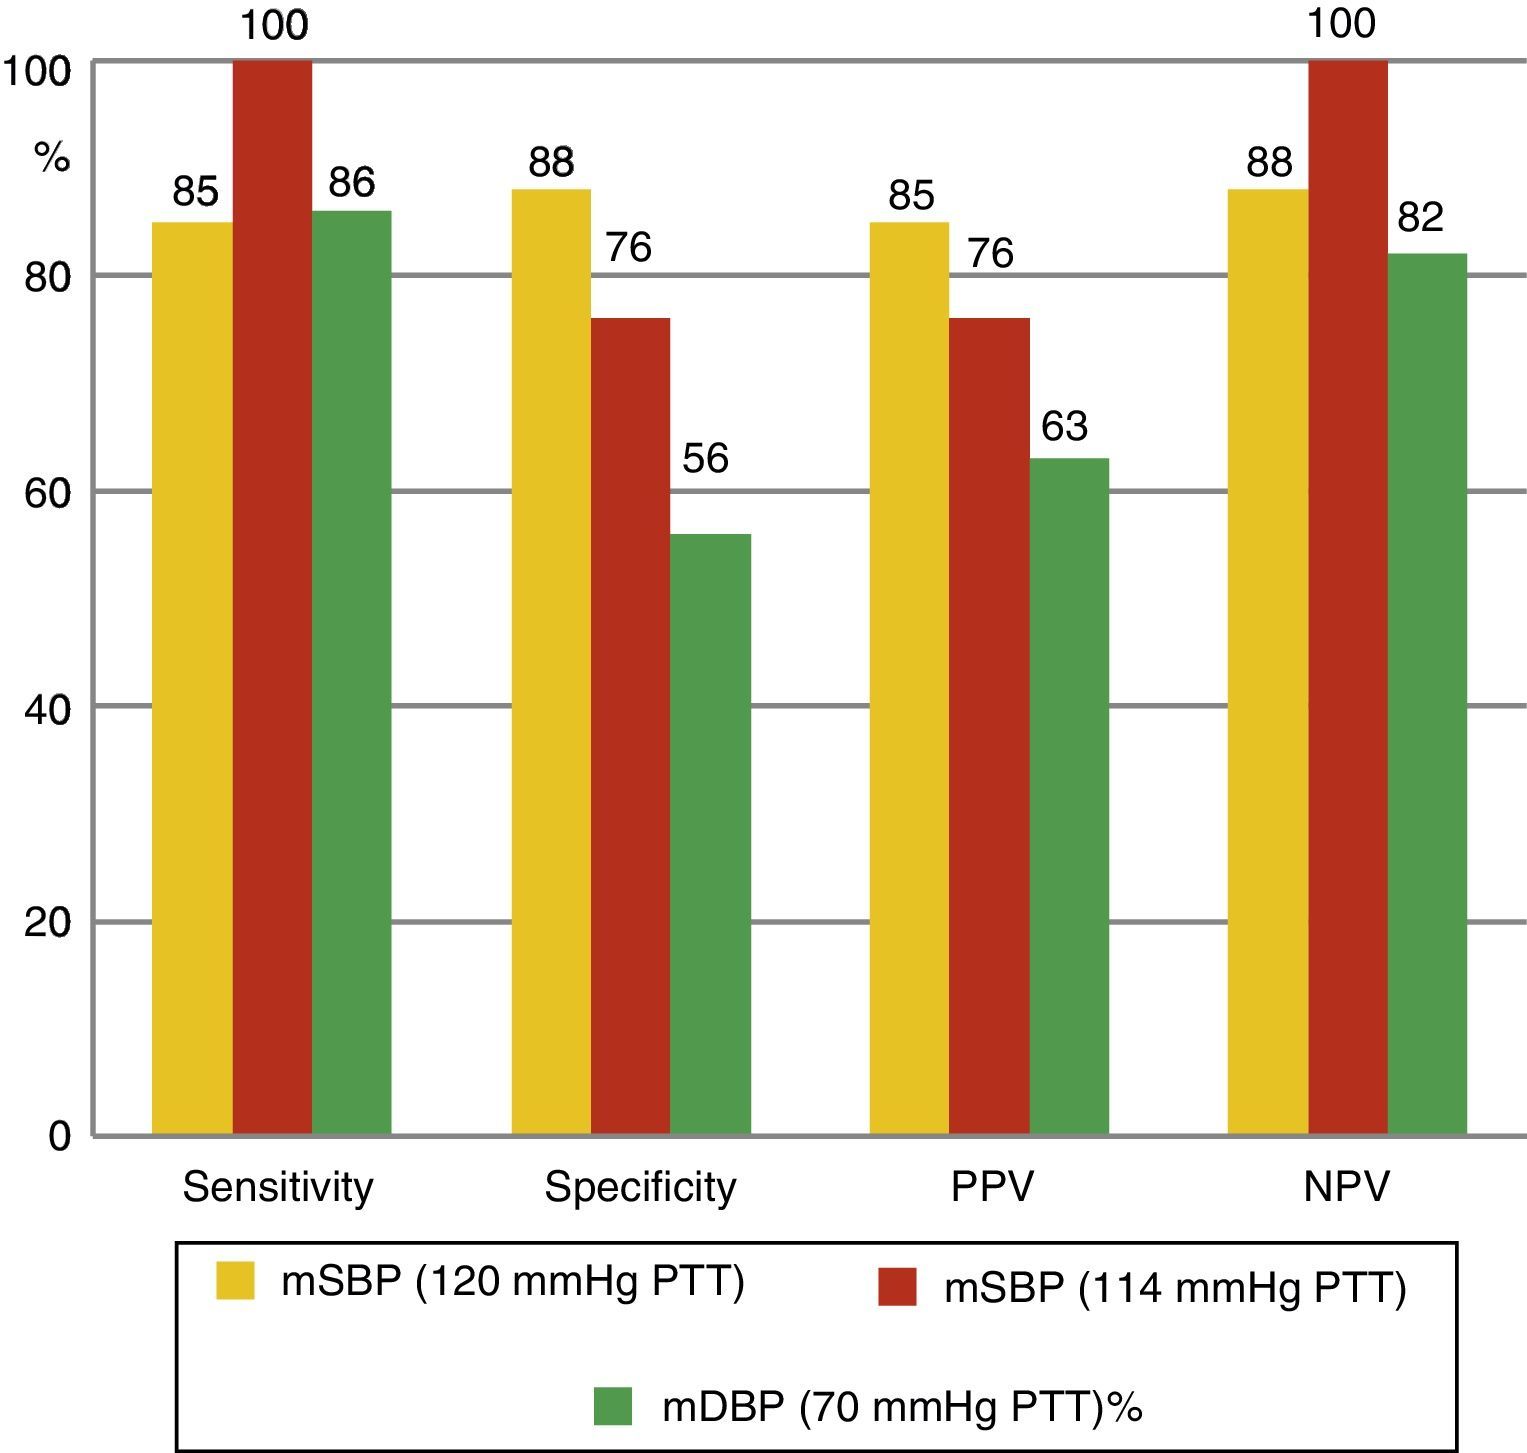
The mean values of the different BP measurements can be seen in Table 2. Taking ABPM as the reference technique for non-invasive BP measurement, the diagnostic sensitivity of PTT was studied, comparing the nocturnal values of both recordings and using for both techniques a cutoff point of 120mmHg. Diagnostic sensitivity of PTT for mean SBP is 85%, with a specificity of 88%, a PPV of 85% and a NPV of 88%. For mean DBP, of the 14 patients diagnosed with nocturnal HT using ABPM, 12 (86%) were identified using PTT. Moreover, nocturnal hypertension was ruled out by ABPM in 16 cases; in 9 cases (56%), this was also ruled out by PTT. PPV and NPV were 63% and 82%, respectively (Fig. 2). Fig. 3 shows the ROC curve demonstrating the diagnostic capacity of PSG for systolic HT. Taking figures higher than 120mmHg on ABPM as indicative of systolic HT, the ROC curve shows the diagnostic capacity of PTT. The cutoff point that simultaneously maximizes sensitivity and specificity is 114. In addition, if the cutoff point for PTT is initially set at 120, and values greater than 120mmHg on ABPM are considered as HT, sensitivity would be lower but specificity would be greater.
Blood Pressure Measured by ABPM and PTT (Mean±Standard Deviation).
| Min SBP (mmHg) | Mean SBP (mmHg) | Max SBP (mmHg) | Min DBP (mmHg) | Mean DBP (mmHg) | Max DBP (mmHg) | |
| ABPM | 101.86±17.82 | 117.53±17.05 | 135.03±18.27 | 56.26±12 | 69.90±11.99 | 83.90±14.56 |
| PTT | 103.06±15.79 | 117.80±14.94 | 148.76±20.93 | 59.96±13.43 | 71.90±11.23 | 81.30±10.61 |
| P | .4990 | .8552 | .0004 | .1301 | .3078 | .2740 |
ABPM: ambulatory blood pressure monitoring: SBP: systolic blood pressure; DBP: diastolic blood pressure; Max: maximum; Min: minimum; PTT: pulse transit time.
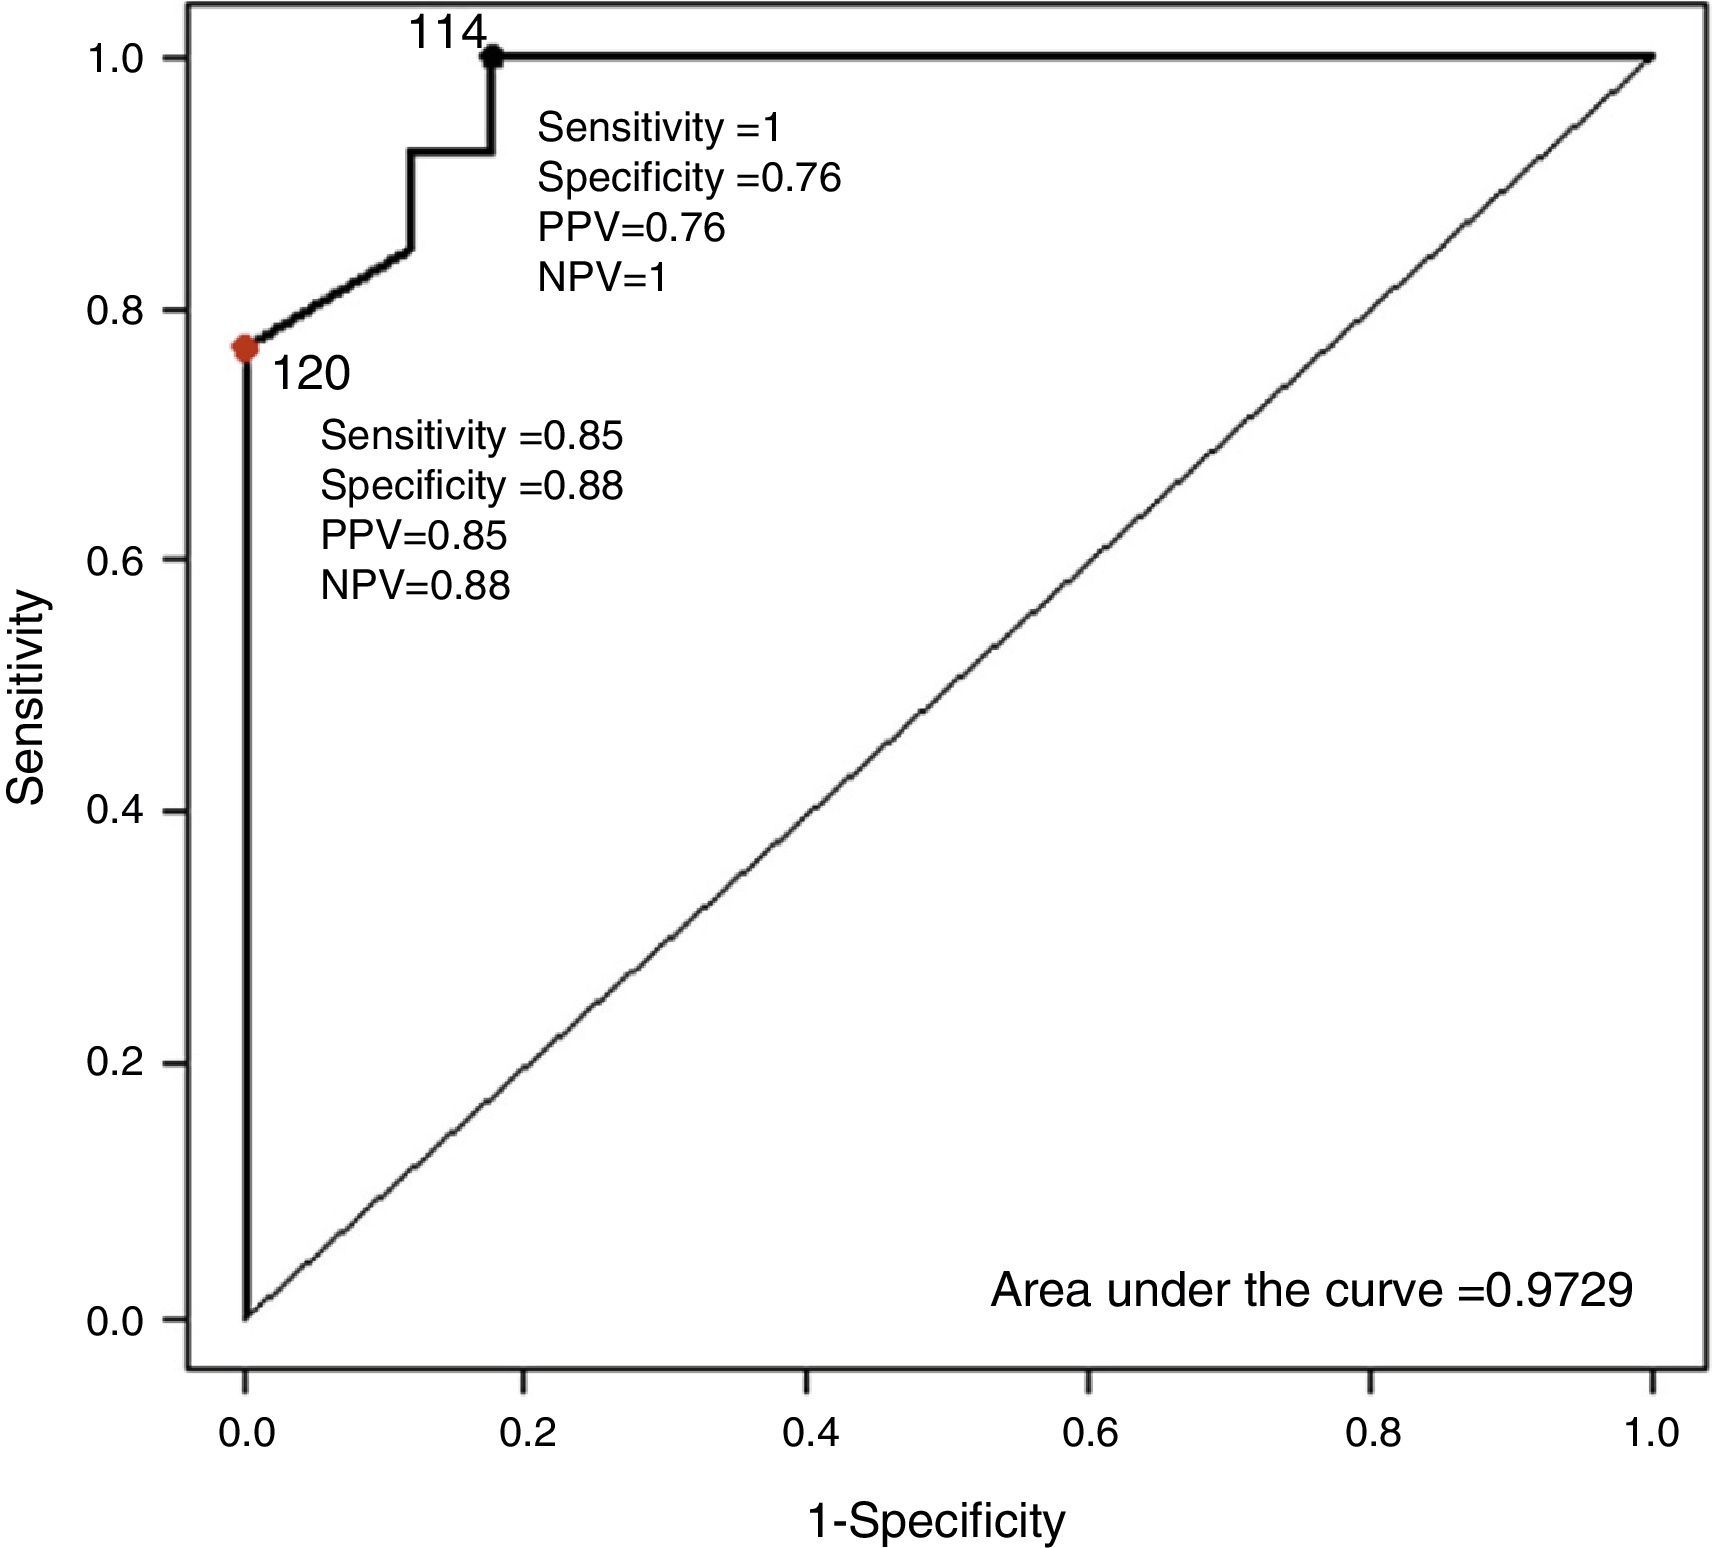
ROC curve for the diagnosis of systolic blood pressure. Taking patients with mean systolic pressure by ABPM >120mmHg as hypertensive, the ROC curve shows the diagnostic sensitivity of the mean systolic pressure values measured by polysomnography. The value of 114mmHg in the PTT simultaneously maximizes sensitivity and specificity. Taking the value of 120mmHg in the PTT, greater specificity is obtained but lower sensitivity. ABPM: ambulatory blood pressure monitoring; PPV: positive predictive value; NPV: negative predictive value; PTT: pulse transit time.
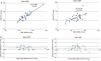
When the relationship between mean SBP measured by ABPM and by PTT is studied, a linear correlation coefficient (R) of 0.88 is found (Fig. 4A), showing a distribution of all subjects with a difference of ±15mmHg between tests (Fig. 4B). There is also a positive correlation between mean DBP measured by the two tests, but here the linear correlation is a little weaker (R=0.58), with a distribution of most subjects within the ±25-mmHg range (Fig. 4A and B).
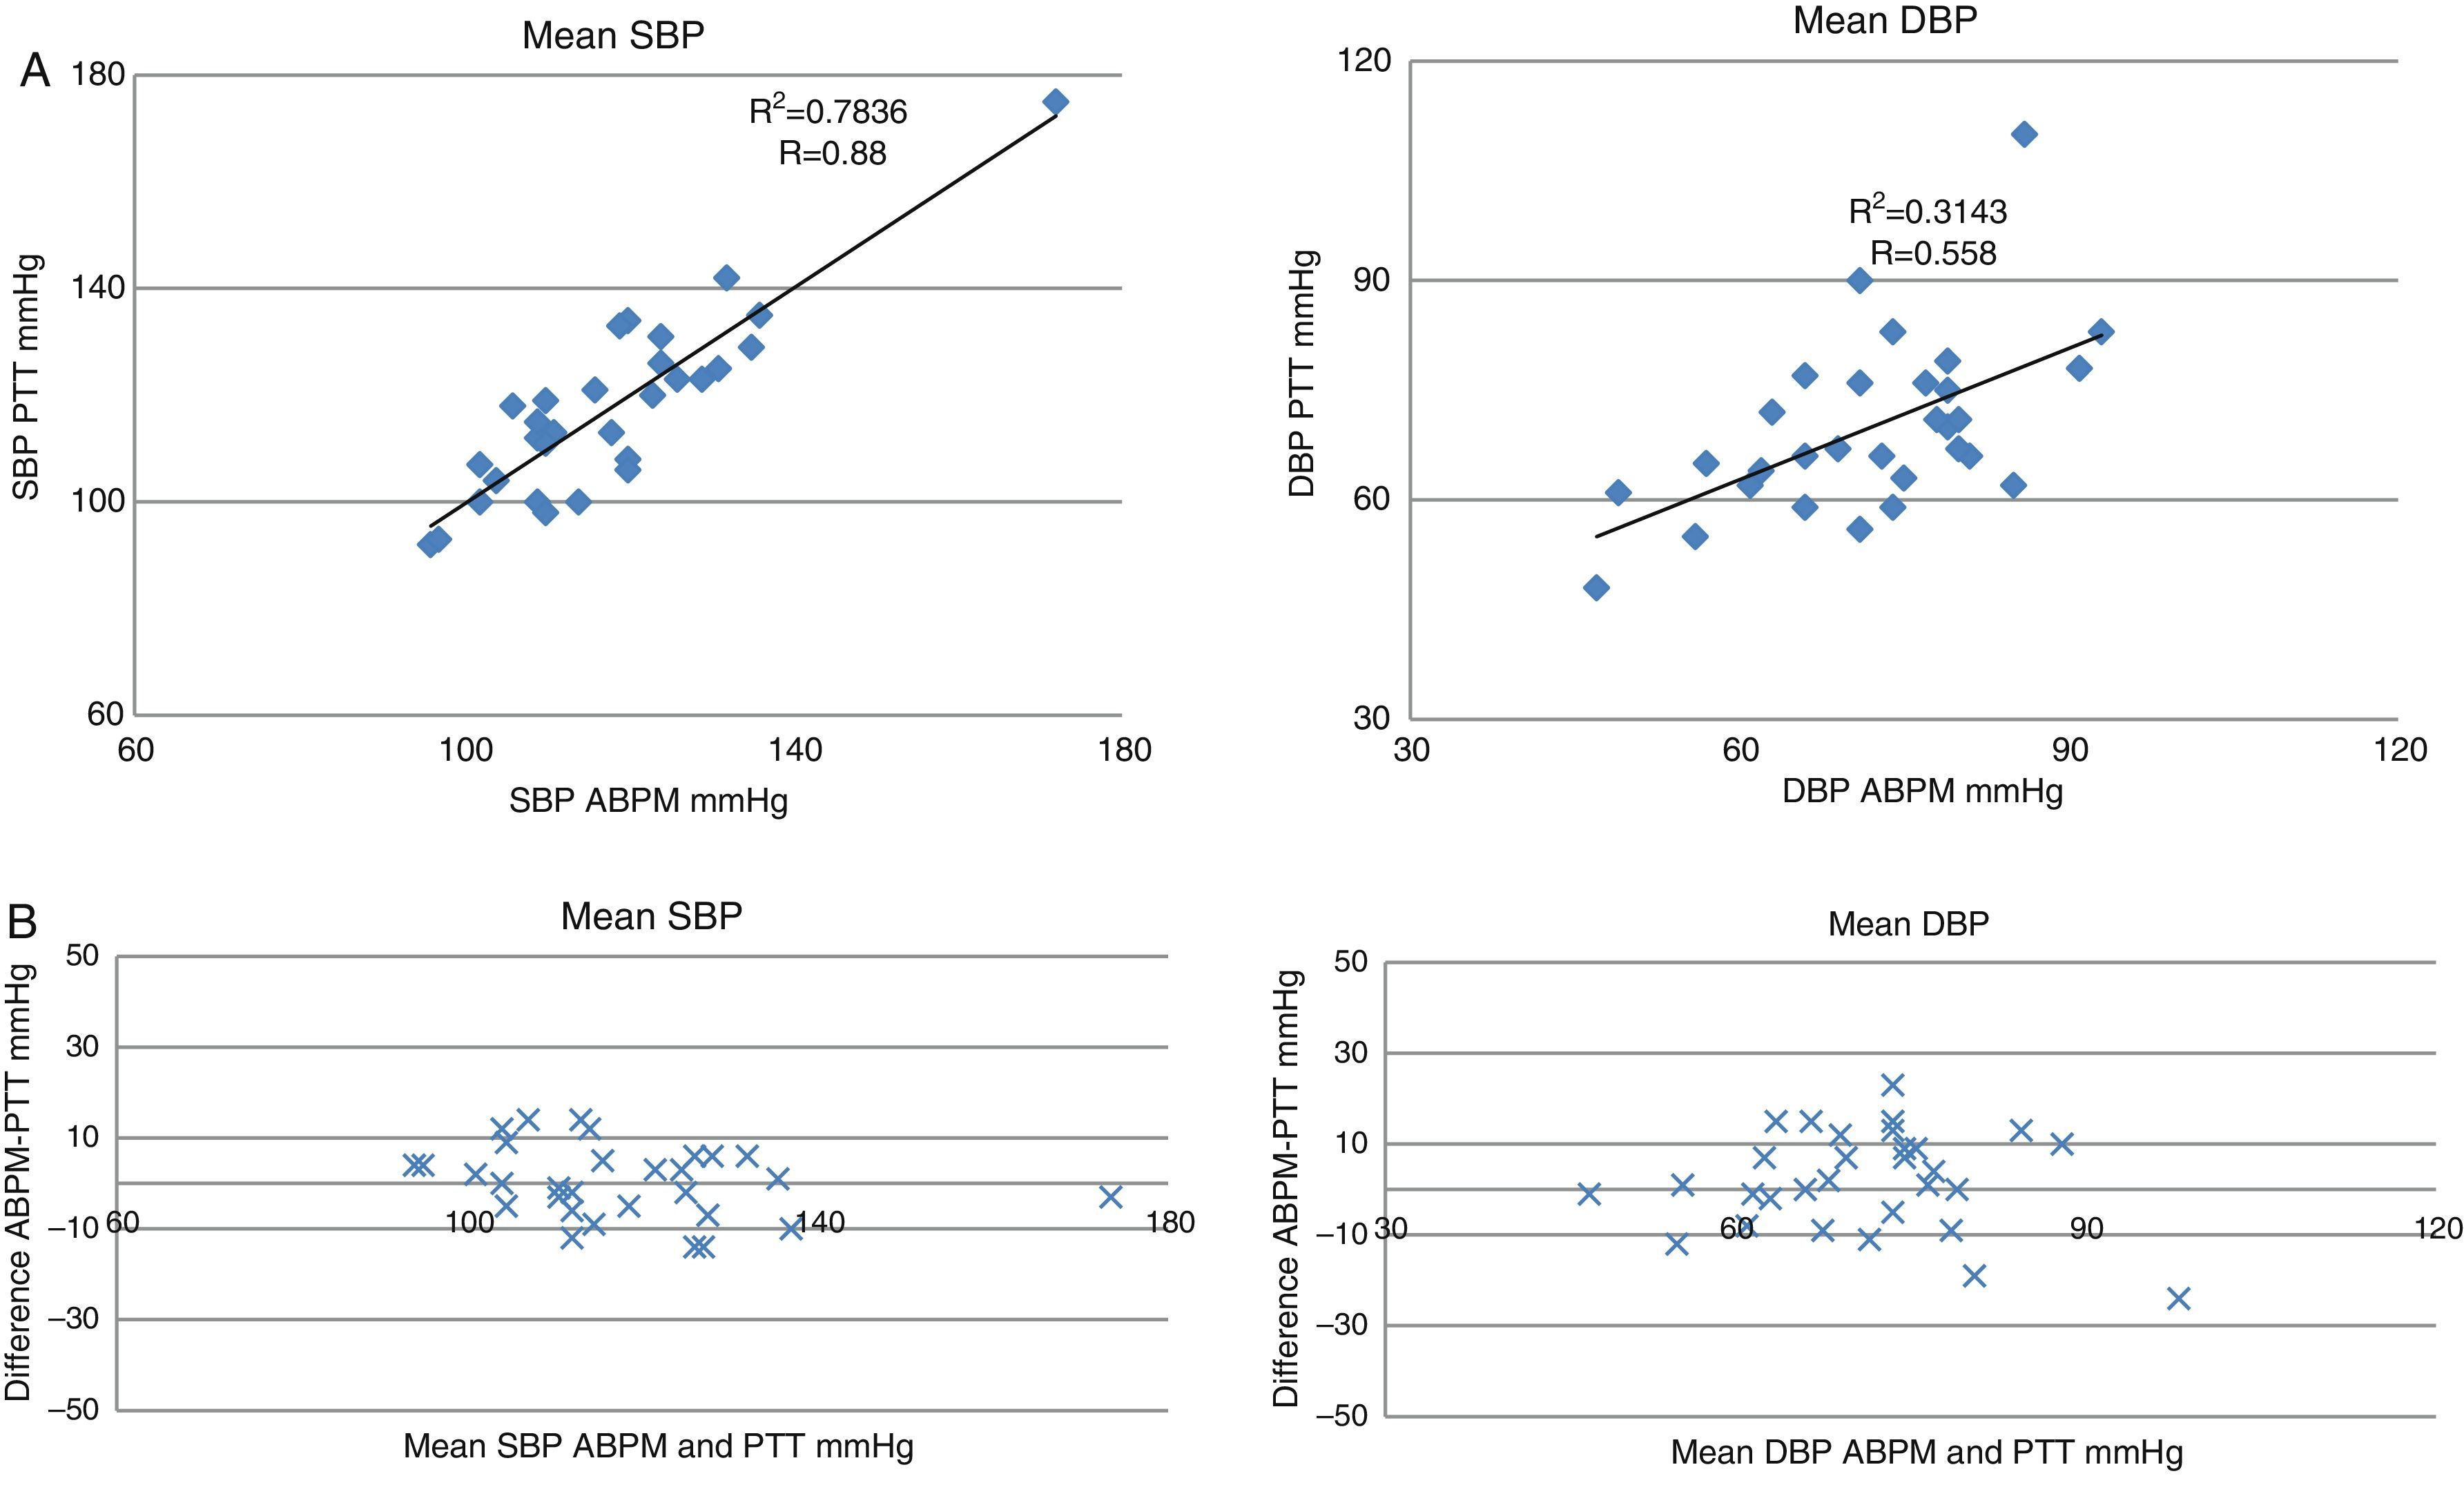
Linear correlation and concordance of PTT and ABPM. ABPM: ambulatory blood pressure monitoring; SBP: systolic blood pressure; DBP: diastolic blood pressure; PTT: pulse transit time. (A) Linear correlation between blood pressure measurements performed by PTT and by ABPM. The X-axis represents measurements by ABPM and the Y-axis represents measurement by PTT. (B) Bland–Altman concordance plot. The X-axis represents the mean blood pressure measured by both techniques. The Y-axis represents the difference in the blood pressure figures between both techniques.
Table 3 shows the intra-class correlation coefficient for mean SBP and DBP values. For the minimum and mean SBP measurements, the correlation coefficient is very high (around 0.9), while for maximum SBP, the coefficient is lower (0.439; 95% CI: 0.04–0.703).
Intra-class Correlation Coefficients for SBP and DBP Measured by PTT and ABPM.
| Variable | Correlation coefficient | 95% CI | P |
| Min SBP | 0.839 | 0.691–0.920 | <.0001 |
| Mean SBP | 0.881 | 0.764–0.941 | <.0001 |
| Max SBP | 0.439 | 0.045–0.703 | .0145 |
| Min DBP | 0.466 | 0.145–0.702 | .0030 |
| Mean DBP | 0.558 | 0.258–0.761 | .0005 |
| Max DBP | 0.520 | 0.208–0.737 | .0011 |
ABPM: ambulatory blood pressure monitoring: DBP: diastolic blood pressure; Max: maximum; Min: minimum; SBP: systolic blood pressure; PTT: pulse transit time.
The analysis of these data suggest that PTT may be another useful tool for the detection of unidentified or poorly controlled HT, as it correlates well with the most commonly used non-invasive method for this purpose (ABPM). Our series includes a high proportion of patients with poorly controlled HT despite the administration of medical treatment. Measuring PTT therefore provides useful additional data in a population in whom resistant hypertension is very prevalent, avoiding further testing or extra costs in addition to the conventional sleep study. The detection and follow-up of these cases is particularly important, since an improvement of 5–10mmHg in BP figures has a significant impact on the incidence of new vascular events.21,22 In this respect, in addition to adjusting medical treatment, it is important to point out that initiating CPAP in patients with OSAHS would improve SBP control.15
In the analysis of the SBP figures, PTT was seen to offer high PPV and NPV. When the SBP measurements from the ABPM and PTT methods were compared, high linear correlation (R=0.88) within a range of ±15mmHg and high intra-class correlation (around 0.9) were found. On the other hand, the DBP study did not achieve such high PPV or NPV values and the linear (R=0.58) and intra-class (0.466–0.558) coefficient correlation between ABPM and PTT for this measurement do not allow the integration of the two techniques. Previous studies have compared BP values obtained by PTT and by sphygmomanometer, finding correlation coefficients for SBP of 0.83, within a range of approximately ±20mmHg.23 These results are very similar to the results reported here, but the series are similarly small. However, for some time now there has been a call for and interest in continuous determination of BP variations in a minimally invasive manner. Thus, many of the available publications originate from this field of medicine. There are studies comparing the correlation of PTT with the gold standard invasive method, showing that there is high correlation in the measurement of SBP, but less correlation for mean BP or DBP.19 Recently, Schmalgemeier et al.24 analyzed the validity of the technique during a PSG study for CPAP titration and confirmed good correlation between the conventional sphygmomanometric method at baseline or during the application of low CPAP pressures.
In general terms, less consistent and contradictory data on the correlation of DBP measured by PTT can be found in the literature. As in this study, the series published by Payne et al.25 shows a weak correlation between PTT and DBP, which improves when pPTT (pulse transit time corrected for the estimated pre-ejection time) is used. On the other hand, the above-mentioned study from Schmalgemeier et al.24 reports a good correlation for both DBP and SBP measured by PTT. Thus, it remains to be clarified if the DBP correlation would be improved by increasing the sample size.
In this study, the authors believe that the small differences in the data from both techniques can be explained in various ways. Firstly, both tests were performed on different days and under different conditions (ABPM was performed in the patients’ home and PTT in the multidisciplinary unit), which may have particularly affected maximum BP that is more variable than the mean. However, this design, with testing being carried out on two different days, is unavoidable, since the periodic and intermittent inflation of the cuff during ABPM causes microarousals that can produce variations in SBP of up to 30mmHg. For this reason, ABPM in itself may cause problems with regard to the reliability of the pressure figures obtained at night. In order to reduce the impact of sleep fragmentation on the study due to the laboratory effect, patients with an invalid PSG study due to low sleep efficiency (sleep recording time of less than 3h) were excluded from the analysis.
One of the limitations of the technique that must be taken into account is that the measurement of PTT is sensitive to the correct measurement of the QRS complex and the correct pulse wave signal. This can be critical in Holter-type equipment, in which the signals are not monitored. However, this limitation is almost negligible in a sleep unit where good electrocardiographic and pulse signaling is essential.
With regard to calibration, the problem is similar to that found with transcutaneous measurement of CO2. The equipment is reliable for measuring trends and changes but it is not accurate, since interindividual differences are observed in the relationship between PTT and BP. For this reason, an individualized calibration must be performed at the beginning of the test. Since this calibration is performed at the beginning of the sleep study, when the patient is awake and moving, there is a risk of calibration coinciding with an artifact. Thus, three calibrations are made for quality control. If the first sample contains any artifact in any part of the PSG, the next calibration is selected, guaranteeing in this way good in vivo correlation. This point is crucial; indeed, in their paper, Payne et al.25 could not show good correlation and suggested that PTT is only useful for showing variability and changes in BP, although their methodology does not include any description of in vivo calibration.
In this respect, a recent study by Gesche et al.23 in healthy patients monitored during exercise, found that after performing an individual calibration at the beginning of the study (introducing the reference value of BP measured by sphygmomanometer), good correlation with SBP was achieved, with differences of less than 20mmHg between both methods of measurement according to the Bland–Altman plot. This latter study also identified a good correlation between BP measured by PTT and by intra-arterial catheterization (reference methods), similar to the above-mentioned studies.
In conclusion, then, sensitivity in the detection of both unidentified and poorly controlled systolic HT may make this method a good alternative for HT screening in a sleep unit, that, furthermore, can be offered at no additional cost.
As the small number of patients included in this study may be a limitation with regard to statistical power, larger studies should be proposed to confirm our results.
Conflict of InterestsNone of the authors has any conflict of interests.
We thank the technicians of the Multidisciplinary Sleep Clinic and the Department of Nephrology.
Please cite this article as: Gómez García MT, Troncoso Acevedo MF, Rodriguez Guzmán M, Alegre de Montaner R, Fernández Fernández B, del Río Camacho G, et al. ¿Puede ser el tiempo de tránsito de pulso útil para detectar hipertensión arterial en pacientes remitidos a la unidad de sueño? Arch Bronconeumol. 2014;50:278–284.