


To diagnose and assess chronic respiratory failure in stable chronic obstructive pulmonary disease (COPD) the measurement of arterial blood gases (ABG) is required. It has been suggested that ABG could be determined for this purpose when FEV1 ranges between 50% and 30% predicted, but these thresholds are not evidence-based.
ObjectiveTo identify the post-bronchodilator (BD) FEV1 and arterial oxygen saturation (SaO2) values that provide the best sensitivity, specificity, and likelihood ratio (LR) for the diagnosis of hypoxaemic and/or hypercapnic chronic respiratory failures in stable COPD.
MethodsA total of 150patients were included (39 with PaO2<60mmHg [8kPa], 14 of them with a PaCO2≥50mmHg [6.7kPa]). The best post-BD FEV1 and SaO2 cut-off points to predict chronic respiratory failure were selected using the PC and the Receiver Operating Characteristics (ROC) curves.
ResultsA post-BD FEV1 equal to 36% and an SaO2 of 90% were the best predictive values for hypoxaemic respiratory failure and a post-BD FEV1 equal to 33% for the hypercapnic variant. An FEV1≥45% ruled out hypoxaemic respiratory failure.
ConclusionA post-BD FEV1 of 36% is the best cut-off point to adequately predict both hypoxaemic and hypercapnic respiratory failure in the patient with stable COPD. For its part, an SaO2 of 90% is the best value for isolated hypoxaemic failure. These values could be considered for future clinical recommendations/guidelines for COPD.
La gasometría arterial es la medición de elección para el diagnóstico de insuficiencia respiratoria crónica en la enfermedad pulmonar obstructiva crónica (EPOC). Se ha sugerido que el FEV1 se sitúe entre el 30 y el 50% del valor teórico para su indicación, pero estas cifras nunca han sido validadas.
ObjetivoIdentificar los valores de FEV1 post-broncodilatador (BD) y saturación arterial de oxígeno (SaO2) que proporcionen la mejor sensibilidad, especificidad y coeficientes de probabilidad (CP) para el diagnóstico de insuficiencia respiratoria crónica hipoxémica y/o hipercápnica en la EPOC estable.
MétodosSe incluyeron 150pacientes (39 con PaO2<60mmHg [8kPa] y 14 de ellos con una PaCO2≥50mmHg [6.7kPa]). Se seleccionaron los mejores puntos de corte de FEV1 post-BD y SaO2 para predecir la insuficiencia respiratoria crónica empleando los CP y las curvas Receiver Operating Characteristic.
ResultadosUn FEV1 post-BD igual al 36% y una SaO2 del 90% fueron los mejores valores predictivos de insuficiencia respiratoria hipoxémica y un FEV1 post-BD igual al 33% para la variante hipercápnica. Un FEV1 ≥ 45% descartó la insuficiencia respiratoria hipoxémica.
ConclusiónUn FEV1 post-BD igual al 36% se erige en el mejor punto de corte para predecir adecuadamente tanto la insuficiencia respiratoria hipoxémica como la hipercápnica en el paciente con EPOC estable. Por su parte, una SaO2 del 90% ofrece el mejor valor para la insuficiencia hipoxémica aislada. Estos valores podrían ser considerados para futuras recomendaciones/guías clínicas de la EPOC.
Arterial blood gas (ABG) test is the usual clinical procedure for the diagnosis and treatment of chronic respiratory failure in chronic obstructive pulmonary disease (COPD).1,2 ABG by means of either radial artery puncture or puncture of another peripheral artery is the most recommended practice. Puncture of the ear lobe only reflects the arterial pressure of carbon dioxide (PaCO2)3,4 and pulse-oximetry, which is the best non-harmful alternative, and is only useful for evaluating the evolution of respiratory insufficiency and/or adjusting oxygen therapy needs.5
Chronic respiratory failure is defined as a state or situation in which the values of PaO2 are less than 60mmHg (8kPa), with or without associated hypercapnia (PaCO2≥50mmHg [6.7kPa]), breathing room air (in standard conditions).6 However, not all the patients with COPD, especially those with advanced stage, present hypoxemic or hypercapnic respiratory failure.7,8 As ABG is a harmful diagnostic method and not always indicated in clinical practice, it would be useful if other functional variables that are much less harmful, such as FEV1 and SaO2, could indicate ABG with the best possible precision for the diagnosis of said respiratory failure.
The first report of the Global Initiative for Chronic Obstructive Lung Disease (GOLD) recommended carrying out ABG under standard conditions in stable COPD patients when post-bronchodilator FEV1 (BD) was less than 40% of the predicted value as the best cut-point.9 However, its most recent update recommended a value less than 50%, consistent with a severe spirometric classification (stage 3) of the disease.10 It should be mentioned that the National Institute for Clinical Excellence (NICE) guideline proposes carrying out ABG when the pre-BD FEV1 is less than 30% predicted and also recommends it in less severe patients when pre-BD FEV1 is between 30% and 49% predicted or SaO2 is equal or less than 92%.5 However, none of these cut-points has been validated to date.
It should be mentioned that there has been one retrospective study that has proposed a threshold of less than 40% the predicted value as the best FEV1 cut-point for ABG.11 It is obvious that if the cut-point is very high, all the patients with hypoxemic or hypercapnic respiratory insufficiency will be diagnosed, although many others, whose levels do not reach said level, could unnecessarily undergo ABG, with its risks and usual costs.12 However, if the FEV1 cut-point is lower, some patients with respiratory failure will go undiagnosed, which can entail the appearance of complications of the underlying respiratory failure.
The hypothesis that we contemplated was that adequate post-BD FEV1 and SaO2 values should be identified to rule out the presence of chronic respiratory failure, which would help to better direct the indication of ABG in patients with advanced stable COPD. The objective of our study was, therefore, to research the most adequate cut-points for post-BD FEV1 and SaO2, evaluating the interrelations between FEV1 (expressed as percentage of the predicted value) and SaO2 (as percentage) on one hand, and the PaO2 and PaCO2 (en mmHg) values on the other, in 150 patients with stable COPD representing the complete spectrum of the disease.
MethodsStudy Population and MeasurementsThe patients included (n=150) corresponded with all those patients who were undergoing studies of the distributions of the ventilation–perfusion relationship in our center by means of the multiple inert gas elimination technique.13 The origin of the patients was as follows: 21 had been hospitalized due to previous COPD exacerbation; 59 patients had undergone extirpation of a lung nodule (n=29), lung volume reduction surgery (n=11) or lung transplantation (n= 19); and the 70 remaining patients were recruited for several studies, of whom only 10 had mild COPD (GOLD stage 1). These measurements were done in specific experimental conditions throughout the period between 1987 and 2008, using three different blood gas analyzers (IZASA model ILBG 3, IZASA model IL1302 and Bayer 800) in 14 different studies whose results have been extensively published.14 The measurements of ABG were taken under stable conditions, at least three months after the last exacerbation, in duplicate, breathing room air, in a sitting position and at sea level. The SaO2 values were obtained from these blood gas samples.14 We excluded patients with concomitant processes or comorbidities (heart failure, diabetes mellitus or other chronic respiratory diseases, such as sleep apnea syndrome).14 All the patients were active smokers (n=30) or ex-smokers (n=120) and the majority were male (n=142). The distribution by stages according to the GOLD report was: 15 patients (10%), stage 1; 40 (27%), stage 2; 32 (21%), stage 3; and 63 (42%), stage 4. All the patients accepted to participate and signed the respective informed consents after a detailed description of each study and they were approved by the ethics committee of the Hospital Clínic, Universitat de Barcelona.
Statistical AnalysisThe results are expressed as mean±standard deviation for the variables with normal distribution or as median and percentiles 5 and 95 (P5–P95) for the abnormal distribution. Using as target variables the universal values of PaO2 and PaCO2 defining respiratory failure,6Receiver Operating Characteristic (ROC) curves were calculated, dividing said variables dichotomically in isolated chronic respiratory failure (PaO2<60mmHg [8kPa] versus PaO2≥60mmHg) and/or hypercapnic (PaO2<60mmHg and PaCO2≥50mmHg [6.7kPa] versus PaCO2<50mmHg) and constructing said curves to determine the best value of FEV1 (expressed as percentage of predicted) and SaO2 (in percentage) to predict both types of respiratory failure (hypoxemic and hypercapnic). Likewise, the area under the curve (AUC) was calculated for each ROC curve non-parametrically.15,16
The predictive values were also calculated, both positive (PPV) and negative (NPV), to evaluate the best positive and negative results of the procedure.17 Afterwards, we explored the diagnostic capacity for prediction of post-BD FEV1 in the interval of 30% and 50% of the predicted value, and SaO2, between 90% and 94%, and respective cut-points were selected that included the best sensitivity and specificity. We also evaluated the means and 95% confidence intervals (95% CI) for the sensitivity, specificity, PPV and NPV.15 The estimations of the sensitivity are necessary for the calculation of the likelihood ratios (LR), which are defined as the probability of a certain value in a patient affected by clinical symptoms in comparison with the probability in another patient that does not have said clinical condition. A positive LR (+), calculated by the sensitivity/(1-specificity) ratio, above 10 is necessary for the diagnostic test to be considered as having powerful confirmatory evidence of the clinical symptoms, while a negative LR (−), calculated with the ratio (1-sensitivity)/specificity lower than 0.10, is considered sufficient to rule out the condition. The LR are not modified by the prevalence of the underlying clinical profile, therefore they are robust tool for evaluating disease biomarkers. In this sense, the LR were used to evaluate the best post-BD FEV1 (as percentage of predicted) and SaO2 (in percentage) predictive values using PaO2<60mmHg as a primary objective,18 with or without associated hypercapnia (PaCO2≥50mmHg). The calculations were done with SPSS/PC (version 15.0, SPSS Inc., Chicago, IL, USA) and MedCalc (version 9.3.9.0; MedCalc, Mariakerke, Belgium).
ResultsTable 1 shows the main characteristics of our study population. A total of 39 patients with COPD (26%) presented chronic respiratory failure: 25 had isolated severe arterial hypoxemia (PaO2<60mmHg) and 14 had associated hypercapnia (PaCO2≥50mmHg). Both the obese patients (body mass index, 32±2kg/m2; n=18; 12%) as well as the non-obese ones (24±3kg/m2; n=132; 88%) showed similar PaCO2 values (42±6 and 41±6mmHg) and pH (7.39±0.90 and 7.40±0.10), respectively. The PaO2 in patients with hypoxemic respiratory failure (54±5mmHg) and in those with hypercapnic respiratory insufficiency (52±5mmHg) was not different (P=.11); in contrast, PaCO2 was significantly higher in the group of hypercapnic respiratory failure (55±5mmHg) compared with those that only had the hypoxemic variety (44±4mmHg) (P<.05).
Clinical and functional characteristics of the patients.
| Variables | Participants (n=150) |
| Gender, M:F | 142:8 |
| Age, years | 61±7 |
| BMI, kg/m2 | 25 (19–33) |
| Pre-BD FEV1/FVC | 0.40 (0.23–0.67) |
| pre-BD FEV1, % predicted | 35 (16–81) |
| Post-BD FEV1/FVC | 0.41 (0.24–0.56) |
| Post-BD FEV1, % predicted | 40 (17–86) |
| TLC, % predicted | 114±22 |
| FRC, % predicted | 158±46 |
| IC, % predicted | 65±24 |
| DLCO, % predicted | 56±23 |
| pH | 7.40±0.4 |
| PaO2, mmHg | 69±13 |
| SaO2, % | 92±5 |
| PaCO2, mmHg | 40 (32–51) |
| AaPO2, mmHg | 32±9 |
The values are expressed as mean±SD or medians (P5–P95).
AaPO2: alveolar-arterial oxygen gradient; DLCO: carbon monoxide diffusing capacity; FRC: functional residual capacity; IC: inspiratory capacity; BMI: body mass index; PaCO2: carbon dioxide arterial pressure; PaO2: oxygen arterial pressure; SaO2: arterial oxygen saturation.
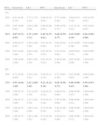
Fig. 1 includes the two ROC curves with the best post-BD FEV1 cut-points for the evaluation of hypoxemic (Fig. 1a) and hypercapnic respiratory failure (Fig. 1b), including the respective AUC, all of which were significant (interval 0.81–0.82; P<.01 in each).
 with respective 95% CI (dashed line) for different post-BD FEV1 values (expressed as percentage of predicted) and cut-points to consider for the diagnosis of hypoxemic (a) and hypercapnic (b) chronic respiratory failure. The values in bold indicate the FEV1 values that present greater diagnostic value for indicating ABG. AUC: area under the curve.")
ROC curves (continuous line) with respective 95% CI (dashed line) for different post-BD FEV1 values (expressed as percentage of predicted) and cut-points to consider for the diagnosis of hypoxemic (a) and hypercapnic (b) chronic respiratory failure. The values in bold indicate the FEV1 values that present greater diagnostic value for indicating ABG. AUC: area under the curve.
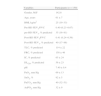
Table 2 demonstrates the values for sensitivity, LR+, PPV, specificity, LR− and NPV for predicting the diagnosis of isolated hypoxemic (PaO2<60mmHg) or hypercapnic respiratory failure (PaO2<60mmHg with PaCO2≥50mmHg). Table 2A indicates that a post-BD FEV1 equal to 36% is the threshold with greater capacity for predicting hypoxemic respiratory failure (sensitivity: 0.87; LR+: 2.79; PPV: 0.49; specificity: 0.68; LR−: 0.19; NPV: 0.94). With the use of this cut-point, a lower number of false positives were found (n=35; 23%) compared with a post-BD FEV1<50%10 (n=56; 37%). The latter included a lower number of false negative cases (n=0) than the selected cut-point (n=5; 3%). The analysis of the ROC curve for obese patients with COPD demonstrated that the best post-BD FEV1 for predicting hypoxemic respiratory failure is very close (34%) to that of the population studied in our paper.
Validity of the variables (means and 95% CI) for various post-BD FEV1 cut-points for predicting hypoxemic (A) and hypercapnic (B) chronic respiratory failure.
| FEV1 | Sensitivity | LR+ | PPV | Specificity | LR− | NPV |
| (A) | ||||||
| 30% | 0.61 (0.45–0.76) | 2.73 (1.79–4.18) | 0.49 (0.35–0.63) | 0.77 (0.68–0.85) | 0.50 (0.33–0.70) | 0.85 (0.76–0.91) |
| 35% | 0.85 (0.69–0.93) | 2.68 (1.98–3.64) | 0.48 (0.36–0.61) | 0.68 (0.59–0.77) | 0.22 (0.10–0.43) | 0.93 (0.84–0.97) |
| 36% | 0.87 (0.72–0.95) | 2.76 (2.05–3.73) | 0.49 (0.37–0.61) | 0.68 (0.59–0.77) | 0.19 (0.09–0.39) | 0.94 (0.85–0.98) |
| 40% | 0.90 (0.75–0.97) | 2.50 (1.90–3.26) | 0.47 (0.35–0.58) | 0.64 (0.54–0.73) | 0.15 (0.06–0.36) | 0.95 (0.86–0.98) |
| 45% | 0.97 (0.84–1.00) | 2.08 (1.69–2.55) | 0.42 (0.32–0.53) | 0.53 (0.43–0.63) | 0.09 (0.02–0.32) | 0.98 (0.90–1.00) |
| 50% | 1.00 (0.89–1.00) | 2.00 (1.65–2.38) | 0.41 (0.31–0.52) | 0.49 (0.40–0.59) | 0.05 (0.00–0.26) | 1.00 (0.92–1.00) |
| (B) | ||||||
| 30% | 0.71 (0.42–0.90) | 2.50 (1.63–3.81) | 0.20 (0.11–0.35) | 0.71 (0.63–0.78) | 0.23 (0.06–0.63) | 0.96 (0.89–1.00) |
| 33% | 0.93 (0.64–1.00) | 2.63 (2.00–3.45) | 0.21 (0.12–0.34) | 0.65 (0.56–0.72) | 0.00 (0.00–0.43) | 0.99 (0.93–1.00) |
| 35% | 1.00 (0.73–1.00) | 2.52 (2.05–3.10) | 0.20 (0.12–0.32) | 0.60 (0.51–0.68) | 0.00 (0.00–0.47) | 1.00 (0.94–1.00) |
| 40% | 1.00 (0.73–1.00) | 2.23 (1.85–2.70) | 0.19 (0.11–0.30) | 0.55 (0.46–0.64) | 0.00 (0.00–0.51) | 1.00 (0.94–1.00) |
| 45% | 1.00 (0.73–1.00) | 1.80 (1.54–2.08) | 0.15 (0.10–0.25) | 0.44 (0.36–0.53) | 0.00 (0.00–0.65) | 1.00 (0.92–1.00) |
| 50% | 1.00 (0.73–1.00) | 1.68 (1.46–1.93) | 0.15 (0.10–0.24) | 0.40 (0.32–0.49) | 0.00 (0.00–0.71) | 1.00 (0.92–1.00) |
The values in bold indicate the selected cut-points.
LR+: positive likelihood ratio; LR−: negative likelihood ratio; NPV=negative predictive value; PPV: positive predictive value.
Table 2B emphasizes a post-BD FEV1 equal to 33% as the cut-point with greater discriminating capacity for hypercapnic respiratory failure, including the best levels of sensitivity (0.93), LR+ (2.65), PPV (0.21), specificity (0.65), LR− (0.10) and NPV (0.99). We observed 30 false-positive cases (22%) compared with the 56 (37%) when a post-BD FEV1<50% was used,10 although there were no false negative cases with the latter value. It should be highlighted that a post-BD FEV1 equal to 35% was an adequate value for ruling out hypercapnic respiratory failure (LR−: 0).
Last of all, Fig. 2 includes the ROC curve that identifies 90% as the best SaO2 value for suspecting the diagnosis of hypoxemic respiratory failure (sensitivity: 0.73; LR+: 24.33; PPV: 0.91; specificity: 0.97; LR−: 0.27; NPV: 0.91). Likewise, an SaO2≤91% (LR+: 15.20) was sufficient for suspecting the diagnosis of hypoxemic respiratory failure.
Discussion with respective 95% CI (dashed line) for different SaO2 values (expressed as percentage) and the cut-points for the diagnosis for hypoxemic chronic respiratory failure. The cut-point in bold has diagnostic value. AUC: area under the curve.")
Our study suggests, as an evidence-based novelty that 36% post-BD FEV1 is the best cut-point for the diagnosis and evaluation of chronic respiratory failure in stable COPD, a level which is considerably lower than that currently recommended by the GOLD report.10 In addition, FEV1≥45% rules out chronic respiratory failure. Furthermore, for hypercapnic chronic respiratory failure, the best cut-point is even lower (33%) than the currently recommended values.5,10 As for SaO2, the values situated between 90% and 91% give the greatest capacity for predicting chronic hypoxemic respiratory failure.
There are no previous studies identifying the best FEV1 to indicate ABG for the diagnosis and the evaluation of chronic respiratory failure in stable COPD patients. In a retrospective study with the objective of researching the utility of FEV1 for determining the presence of severe arterial hypoxemia and developing the best strategy of continuous home oxygen therapy, Lim et al.19 concluded that FEV1 was adequate for screening chronic hypoxemic respiratory failure, but without estimating the best FEV1 to warrant ABG. Along a similar line to that of our study, Franciosi et al.20 investigated which could be the best clinical and functional markers of severity in the clinical practice in 145,000 patients affected by COPD. They concluded that PaO2 was one of the most relevant markers for differentiating the different spirometric stages of the disease; nevertheless, the most adequate FEV1 value for performing ABG in a patient with stable COPD was not determined. Using an analysis of the main components for evaluating the potential of multidimensional staging of stable COPD patients, Celli et al.11 observed that the best threshold for detecting chronic respiratory failure could be FEV1<40% predicted, a percentage that was not based on direct evidence.
Although PaCO2≥44mmHg has been identified with a higher number of hospitalizations due to COPD exacerbations,21 hypercapnia has never been referred to as a reliable marker of the progression of COPD.20 Our findings confirm that a post-BD FEV1 of 33% is a good cut-point to indicate whether to carry out ABG for the diagnosis of chronic hypercapnic respiratory failure in COPD.
The present study carries a series of limitations, among which is the heterogeneity of the population, its gender bias, cross-sectional design and retrospective nature. It should also be mentioned that the SaO2 values included were derived from the measurements made with the ABG samples, which contrasts with the daily clinical practice in which physicians use pulse-oximetry for its measurement. In addition, the levels of carboxyhemoglobin, which also modulate SaO2,22 were not measured. However, these limitations were offset by two important strengths. First, the patients included represent the entire spirometric spectrum of COPD; second, all our studies were done by the same laboratory and, which is even more important, using a common systematic methodology for the analysis of ABG.14
Since 2001, when the first GOLD report was published,9 until more recent contributions,5,10,23,24 an FEV1 equal to 50% is the ideal percentage for carrying out ABG with the aim of diagnosing and managing chronic respiratory failure in stable COPD, even though this percentage has never been validated. In accordance with our results, a post-BD FEV1 value of 36% has been suggested as the most adequate cut-point for the diagnosis, evaluation and management of hypoxemic and hypercapnic chronic respiratory failure in patients with stable COPD. Likewise and complementarily, SaO2 equal to 90% could also be considered for the diagnosis of hypoxemic chronic respiratory failure. It must be stated, however, that our data are not far off the mark of the recommendations proposed in the first GOLD report9 or the NICE guidelines,5 which only includes pre-BD FEV1 values. In any event, our results should be replicated with a prospective study including a larger patient population.
In short, future clinical guidelines or recommendations for COPD could consider the cut-points for FEV1 and SaO2 suggested by our study. This would avoid the practice of unnecessary arterial punctures, which may always result in side effects and patient discomfort as well as excessive costs for health-care systems.
FundingThis study has been funded in part by: Generalitat de Catalunya (2005SGR-00822), Marató TV3 (# 040430) and Esteve Laboratories and Almirall Laboratories. D.A. Rodríguez received a 2006 ERS-SEPAR Long-Term Research Fellowship (#191).
Conflicts of InterestsRoberto Rodríguez-Roisin presides on the GOLD Executive Committee. The remaining authors have no conflict of interests.
The authors would like to thank Conchi Gistau and Felip Burgos for their colaboración during the study.
Please cite this article as: Rodríguez DA, et al. ¿Cuál es el mejor FEV1 para detectar insuficiencia respiratoria crónica en la EPOC estable? Arch Bronconeumol. 2011;47:325–9.


