


The prevalence of chronic obstructive pulmonary disease (COPD) has not been studied in Argentina.
ObjectivesTo determine the prevalence and relevant clinical characteristics of COPD in a representative sample.
Material and methodsWe performed a cross-sectional study in a population of adults aged ≥40 years randomly selected by cluster sampling in 6 urban locations. Subjects answered a structured survey and performed pre- and post-bronchodilator spirometry (PBD). COPD was defined as FEV1/FVC ratio <0.7 predicted value. The total prevalence was estimated for each cluster with its 95% confidence interval (CI).
ResultsOf 4599 surveys and 3999 spirometries, 3469 were considered of adequate quality (86.8%) for our study. The prevalence of COPD was 14.5% (CI: 13.4–15.7). The distribution of COPD cases according to FEV1 (GOLD 2017) was stage 1: 38% (CI: 34–43); stage 2: 52% (CI: 47–56); stage 3: 10% (CI: 7–13); and stage 4: 1% (CI: 0–2), and according to the refined ABCD (GOLD 2017) assessment: A: 52% (CI: 47–56); B: 43% (CI: 39–48); C: 1% (CI: 0–2); D: 4% (CI: 2–6). The rate of underdiagnosis was 77.4% (CI: 73.7%–81.1%) and diagnostic error 60.7% (CI: 55.1%–66.3%). A significant association was found between COPD and age (OR 3.77 in individuals 50–59 years of age and 19.23 in those >80 years), male gender (OR 1.62; CI: 1.31–2), smoking (OR 1.95; CI: 1.49–2.54), low socioeconomic status (OR 1.33; CI: 1.02–1.73), and previous tuberculosis (OR 3.3; CI: 1.43–7.62).
ConclusionsWe estimate that more than 2.3 million Argentineans have COPD, with high rates of underdiagnosis and diagnostic error.
La prevalencia de la enfermedad pulmonar obstructiva crónica (EPOC) en Argentina no había sido estudiada.
ObjetivosDeterminar la prevalencia de EPOC y rasgos clínicos relevantes en una muestra representativa.
Material y métodosEstudio de corte transversal en población ≥40 años en 6 aglomerados urbanos seleccionada aleatoriamente mediante muestreo por conglomerados. Se aplicó una encuesta estructurada y espirometrías pre y postbroncodilatador (PBD). Se definió EPOC en quienes presentaban un cociente FEV1/FVC PBD <0,7. Se estimó la prevalencia total y para cada aglomerado con intervalo de confianza del 95% (IC).
ResultadosSe realizaron 4.599 encuestas y 3.999 espirometrías, de las cuales 3.469 fueron útiles (86,8%). La prevalencia de EPOC fue de 14,5% (IC: 13,4-15,7). La distribución de los casos compatibles con EPOC según FEV1 (GOLD-2017) fue: 1: 38% (IC: 34-43); 2: 52% (IC: 47-56); 3: 10% (IC: 7-13); y 4: 1% (IC: 0,-2) y de acuerdo al modelo combinado ABCD (GOLD 2017): A: 52% (IC: 47-56); B: 43% (IC: 39-48); C: 1% (IC: 0-2) y D: 4% (IC: 2-6). El subdiagnóstico fue del 77,4% (IC 73,7-81,1%) y el error diagnóstico de 60,7% (IC 55,1-66,3%). Encontramos asociación significativa de presencia de EPOC con edad (OR 3,77 en 50-59 años a 19,23 en >80 años), sexo masculino (OR: 1,62; IC: 1,31-2), tabaquismo (OR: 1,95; IC: 1,49-2,54), nivel socieconómico bajo (OR: 1,33; IC: 1,02-1,73) y antecedentes de tuberculosis (OR: 3,3; IC: 1,43-7,62).
ConclusionesSe estima que más de 2,3 millones de argentinos padecen EPOC con elevada tasa de subdiagnóstico y error diagnóstico.
Chronic obstructive pulmonary disease is a major cause of disability, morbidity and mortality that affects many individuals during their economically productive years, and places a heavy burden on healthcare and monetary resources.1 Data from the World Health Organization suggest that in 2015 more than 3 million individuals worldwide died of COPD; 90% of these deaths occurred in low and middle-income countries. The data also predict an increase in morbidity and mortality in the next 15 years, due to accumulated exposure to smoking and aging of the population.2–4
This situation is compounded by widespread failure to properly evaluate COPD, with either overdiagnosis in patients with symptoms caused by other entities, or underdiagnosis in patients who do have the disease.5–8 There is a lack of awareness of COPD that prevents patients from taking steps to improve their quality of life and life expectancy by, for example, giving up smoking and incorporating physical activity and better eating habits into their daily routine.
Population-based epidemiological studies conducted in several Latin American cities showed a COPD prevalence ranging from 6% to 19.7%.9–11
In Argentina, a middle-income country with approximately 44 million inhabitants, 90% of whom live in urban locations, mainly in Buenos Aires and surrounding areas, the COPD mortality rate in 2015 was 24.3 per 100000 inhabitants between 40 and 74 years of age, adjusted for age and sex, 1.2 times the rate registered in 2014. In total, 38% of these deaths occurred in people under the age of 65 years: the mortality rate among men had reduced, but it increased among women and economically productive adults.12
To date, no population studies with standardized questionnaires and home spirometry have been conducted to determine the prevalence of COPD in Argentina. The EPOC.AR study was designed by the Argentine Association of Respiratory Medicine and the National Institute of Respiratory Diseases of the Ministry of Health to estimate the prevalence of COPD in Argentina, to obtain data for the design of population health promotion initiatives, and to improve regional epidemiological references.
MethodsStudy designThis was a multicenter population-based cross-sectional study. Participants were randomly selected from 6 urban areas in Argentina, using cluster sampling, in order to establish the prevalence of COPD and evaluate the clinical and sociodemographic characteristics of patients, treatment, and risk factors.
The study was conducted between August 2014 and May 2016. The following urban clusters were selected: La Plata, Rosario, Autonomous City of Buenos Aires, Northern Region of Gran Buenos Aires, Córdoba and Mendoza. The sample size was calculated on the basis of an 8% prevalence, as determined by the PLATINO study,9 with a 95% confidence interval, a design effect of 1.5, and a total accuracy (6 urban areas) of ±1.15%, for which 3207 patients with completed questionnaires and postbronchodilator spirometries needed to be recruited. Taking into account an estimated response rate of 75%, the number of households to be contacted was 4276.
Study populationMen and women ≥40 years of age were included from the 6 selected urban clusters. The sample was selected by multistage probability cluster sampling based on cartographic area units, described in greater detail in the supplementary material. All selected individuals (1 single subject per household) were invited to participate in the study, and if they agreed, they were asked to sign an informed consent form. The following exclusion criteria were defined and applied: mental disorders or inability to make decisions, history of thoracic or abdominal surgery in the last 3 months, residence in institutions, current COPD exacerbation, and others described elsewhere9 (see supplementary material). Contraindications for performing spirometry were also taken into account.13,14
Definition of chronic obstructive pulmonary diseaseData collected included an evaluation of bronchial obstruction by pre- and postbronchodilator spirometry as a primary study objective. COPD was defined as a postbronchodilator FEV1/FVC ratio<0.7, and the GOLD 2017 classification was used to define the degree of obstruction and multidimensional ABCD assessment.15 The analysis was also performed using the lower limit of normal (LLN) method.16 All subjects were asked about any previous medical diagnosis of emphysema, chronic bronchitis or COPD.
Procedures and quality control spirometryA study team consisting of an interviewer and a spirometry technician performed the procedures in the home of each subject. The structured interview, CAT questionnaire,17 and mMRC18 were first completed by all subjects (see supplementary material). Blood pressure and anthropometric measurements were obtained using a previously validated portable ultrasonic measuring board and digital weighing scale (SECA 804, Hamburg, Germany) (see supplementary material).
Spirometry was then performed before and after inhalation of 400mcg salbutamol (Ventolin® HFA, GSK), using a measured dose device with spacer. As in similar studies,9 spirometers equipped with an ultrasonic sensor (EasyOne NDD; Zurich, Switzerland) were used according to the standard technique.14 Devices were calibrated every day with a 3 L syringe. Studies were analyzed according to the 3 criteria previously described in other publications.14,19,20 The acceptability of the spirometries was determined according to Enright's A, B, and C criteria,19 with the NHANES III reference equation.21 During the field work period, spirometries were sent electronically to the Central Spirometry Committee once a week, where they were reviewed by 2 blinded evaluators who analyzed each spirometry and determined the number of acceptable maneuvers obtained according to ATS/ERS criteria.14
The performance of the technicians was evaluated every week according to the acceptability criteria of the spirometries they had conducted, and retraining was offered, if necessary (see supplementary material).
Ethical aspectsThe study and written informed consent form were initially reviewed and approved by the Provincial Bioethics Committee (#344/14), Rosario City, Argentina. The ethical, regulatory, teaching and research aspects of the study were then reviewed and approved by regional and local authorities (ethics committees from each urban area).
Statistical analysisThe estimated prevalence of each variable was presented with the absolute value, percentage and respective 95% confidence interval (CI) for the overall study population and for each subgroup of interest.
A bivariate analysis was performed to establish the possible factors associated with COPD. Odds ratio (OR) with CI was used as a measure of association. A multivariate analysis was then performed using logistic regression, and variables that were considered relevant were included in the adjustment of the model. The logistic regression analysis model was performed using the stepwise method, and the adjusted ORs obtained with the complete model were analyzed. The ORs of the adjusted model were also calculated with their CI, and for these, the level of significance of the differences between odds was analyzed using the Chi-square method, with a level of significance set at 5%.
ResultsIn total, 4599 homes were visited in the 6 selected urban clusters, and preliminary clinical and spirometric data were collected from 3999 subjects (86.9%) (Figs. 1 and 2). The Central Spirometry Committee monitored the quality of the spirometries and rejected 530 tests (13.2%), so the final study population with eligible clinical and spirometric data comprised 3469 subjects (75.4% of the total visits), of which 2008 were women (57.9%) (Fig. 2).
![Geographic location of the urban clusters selected for the study. La Plata (9.8 meters above sea level [masl]), Rosario (22.5 masl), Autonomous City of Buenos Aires-CABA (16 masl), Greater Buenos Aires (North Region, 16 masl), Cordoba (106 masl) and Mendoza (746 masl).](https://static.elsevier.es/multimedia/15792129/0000005400000005/v1_201804290447/S157921291830082X/v1_201804290447/en/main.assets/gr1.jpeg?xkr=ue/ImdikoIMrsJoerZ+w9zfHQrK7O1GixshFj/RYvvhfIeFLIshOrwnoGDwJytw3sGm8bijV+TbKpnl+SctEd1HqDEq+VILOv9ybcnHvp3J94sEexaPjO5AxMRLZ52SmyDJrT8WyVdGALHXqjFygUknaRLrnPcCM38KnfYU/mBaR2ChnjI1YfDmPalsrHyJeY+UmsTV/ImeYjEH5JyIn1OtuzVJJ5gU+rgIgP14FOiI7BvGu/rTVQ0EGCs1m38vd9hcppv2JMXhtzXVxi7zLTO1Hamhe4IYw/4/WZxfFaNY= "Geographic location of the urban clusters selected for the study. La Plata (9.8 meters above sea level [masl]), Rosario (22.5 masl), Autonomous City of Buenos Aires-CABA (16 masl), Greater Buenos Aires (North Region, 16 masl), Cordoba (106 masl) and Mendoza (746 masl).")

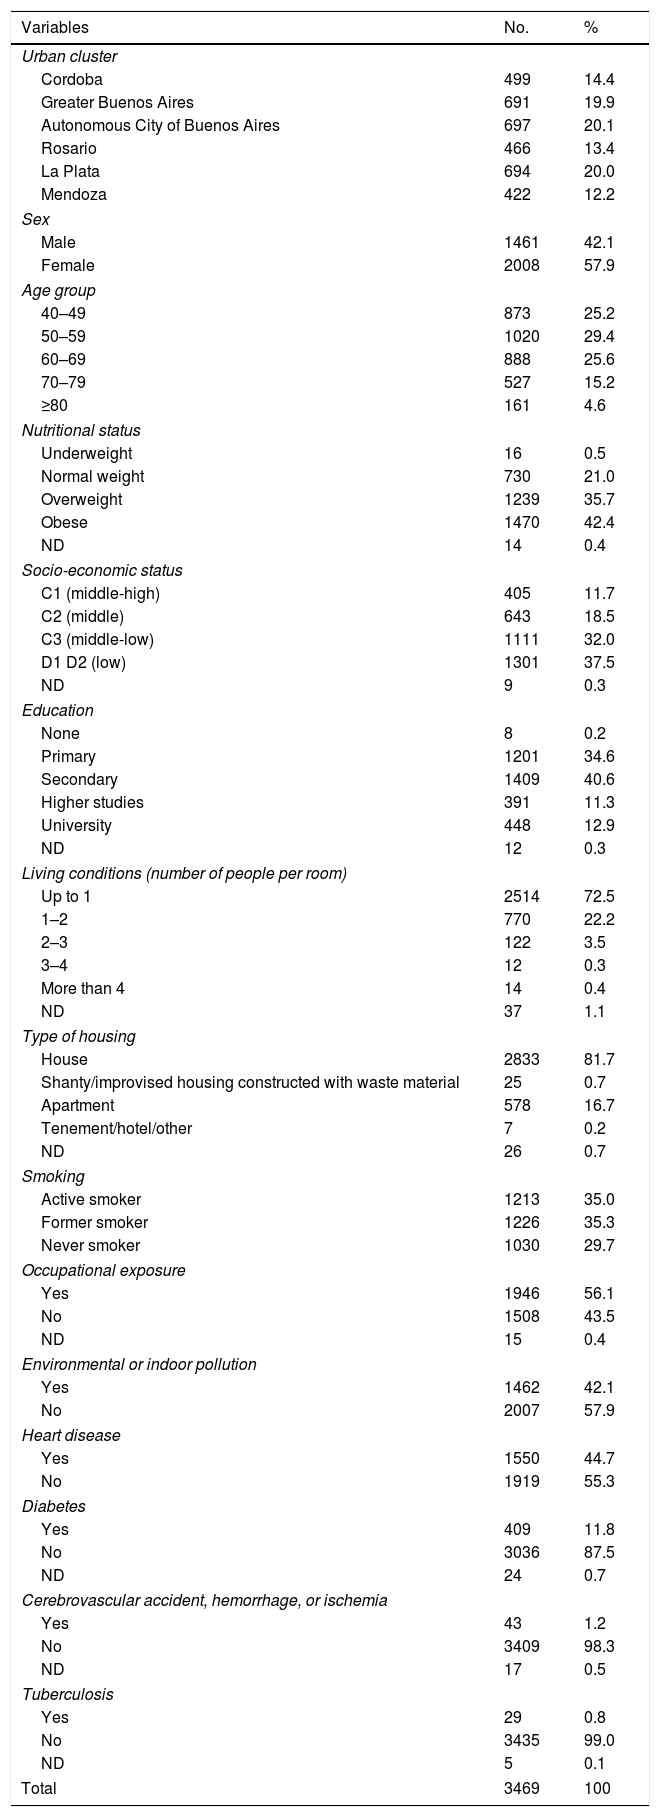
Sociodemographic and clinical characteristics of the participants are shown in Tables 1 and 2 and Appendix B, Tables A1 and A2 of the supplementary material.
Participant characteristics.
| Variables | No. | % |
|---|---|---|
| Urban cluster | ||
| Cordoba | 499 | 14.4 |
| Greater Buenos Aires | 691 | 19.9 |
| Autonomous City of Buenos Aires | 697 | 20.1 |
| Rosario | 466 | 13.4 |
| La Plata | 694 | 20.0 |
| Mendoza | 422 | 12.2 |
| Sex | ||
| Male | 1461 | 42.1 |
| Female | 2008 | 57.9 |
| Age group | ||
| 40–49 | 873 | 25.2 |
| 50–59 | 1020 | 29.4 |
| 60–69 | 888 | 25.6 |
| 70–79 | 527 | 15.2 |
| ≥80 | 161 | 4.6 |
| Nutritional status | ||
| Underweight | 16 | 0.5 |
| Normal weight | 730 | 21.0 |
| Overweight | 1239 | 35.7 |
| Obese | 1470 | 42.4 |
| ND | 14 | 0.4 |
| Socio-economic status | ||
| C1 (middle-high) | 405 | 11.7 |
| C2 (middle) | 643 | 18.5 |
| C3 (middle-low) | 1111 | 32.0 |
| D1 D2 (low) | 1301 | 37.5 |
| ND | 9 | 0.3 |
| Education | ||
| None | 8 | 0.2 |
| Primary | 1201 | 34.6 |
| Secondary | 1409 | 40.6 |
| Higher studies | 391 | 11.3 |
| University | 448 | 12.9 |
| ND | 12 | 0.3 |
| Living conditions (number of people per room) | ||
| Up to 1 | 2514 | 72.5 |
| 1–2 | 770 | 22.2 |
| 2–3 | 122 | 3.5 |
| 3–4 | 12 | 0.3 |
| More than 4 | 14 | 0.4 |
| ND | 37 | 1.1 |
| Type of housing | ||
| House | 2833 | 81.7 |
| Shanty/improvised housing constructed with waste material | 25 | 0.7 |
| Apartment | 578 | 16.7 |
| Tenement/hotel/other | 7 | 0.2 |
| ND | 26 | 0.7 |
| Smoking | ||
| Active smoker | 1213 | 35.0 |
| Former smoker | 1226 | 35.3 |
| Never smoker | 1030 | 29.7 |
| Occupational exposure | ||
| Yes | 1946 | 56.1 |
| No | 1508 | 43.5 |
| ND | 15 | 0.4 |
| Environmental or indoor pollution | ||
| Yes | 1462 | 42.1 |
| No | 2007 | 57.9 |
| Heart disease | ||
| Yes | 1550 | 44.7 |
| No | 1919 | 55.3 |
| Diabetes | ||
| Yes | 409 | 11.8 |
| No | 3036 | 87.5 |
| ND | 24 | 0.7 |
| Cerebrovascular accident, hemorrhage, or ischemia | ||
| Yes | 43 | 1.2 |
| No | 3409 | 98.3 |
| ND | 17 | 0.5 |
| Tuberculosis | ||
| Yes | 29 | 0.8 |
| No | 3435 | 99.0 |
| ND | 5 | 0.1 |
| Total | 3469 | 100 |
ND: no data.
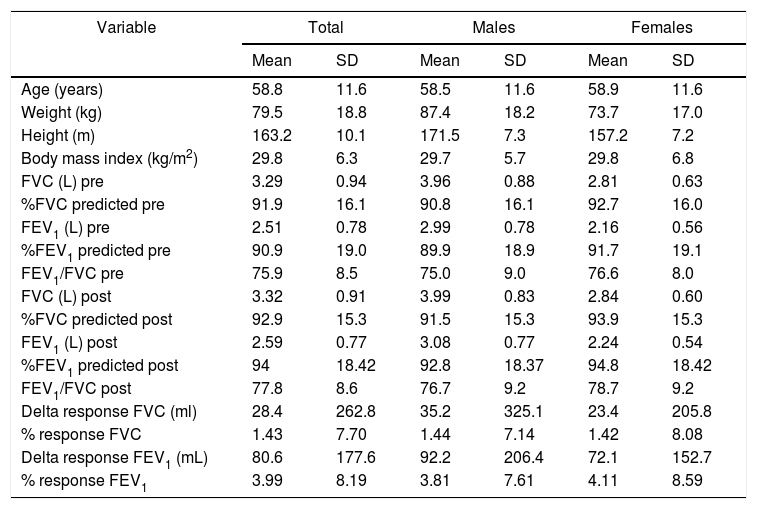
Spirometric characteristics of participants (n: 3469).
| Variable | Total | Males | Females | |||
|---|---|---|---|---|---|---|
| Mean | SD | Mean | SD | Mean | SD | |
| Age (years) | 58.8 | 11.6 | 58.5 | 11.6 | 58.9 | 11.6 |
| Weight (kg) | 79.5 | 18.8 | 87.4 | 18.2 | 73.7 | 17.0 |
| Height (m) | 163.2 | 10.1 | 171.5 | 7.3 | 157.2 | 7.2 |
| Body mass index (kg/m2) | 29.8 | 6.3 | 29.7 | 5.7 | 29.8 | 6.8 |
| FVC (L) pre | 3.29 | 0.94 | 3.96 | 0.88 | 2.81 | 0.63 |
| %FVC predicted pre | 91.9 | 16.1 | 90.8 | 16.1 | 92.7 | 16.0 |
| FEV1 (L) pre | 2.51 | 0.78 | 2.99 | 0.78 | 2.16 | 0.56 |
| %FEV1 predicted pre | 90.9 | 19.0 | 89.9 | 18.9 | 91.7 | 19.1 |
| FEV1/FVC pre | 75.9 | 8.5 | 75.0 | 9.0 | 76.6 | 8.0 |
| FVC (L) post | 3.32 | 0.91 | 3.99 | 0.83 | 2.84 | 0.60 |
| %FVC predicted post | 92.9 | 15.3 | 91.5 | 15.3 | 93.9 | 15.3 |
| FEV1 (L) post | 2.59 | 0.77 | 3.08 | 0.77 | 2.24 | 0.54 |
| %FEV1 predicted post | 94 | 18.42 | 92.8 | 18.37 | 94.8 | 18.42 |
| FEV1/FVC post | 77.8 | 8.6 | 76.7 | 9.2 | 78.7 | 9.2 |
| Delta response FVC (ml) | 28.4 | 262.8 | 35.2 | 325.1 | 23.4 | 205.8 |
| % response FVC | 1.43 | 7.70 | 1.44 | 7.14 | 1.42 | 8.08 |
| Delta response FEV1 (mL) | 80.6 | 177.6 | 92.2 | 206.4 | 72.1 | 152.7 |
| % response FEV1 | 3.99 | 8.19 | 3.81 | 7.61 | 4.11 | 8.59 |
Total FVC and FEV1 reversibility, defined as a significant postbronchodilator change of at least 12% and 200ml in FVC and/or FEV1, was 11.4% in the total population, with no differences between men and women (see Table A2 of the supplementary material).
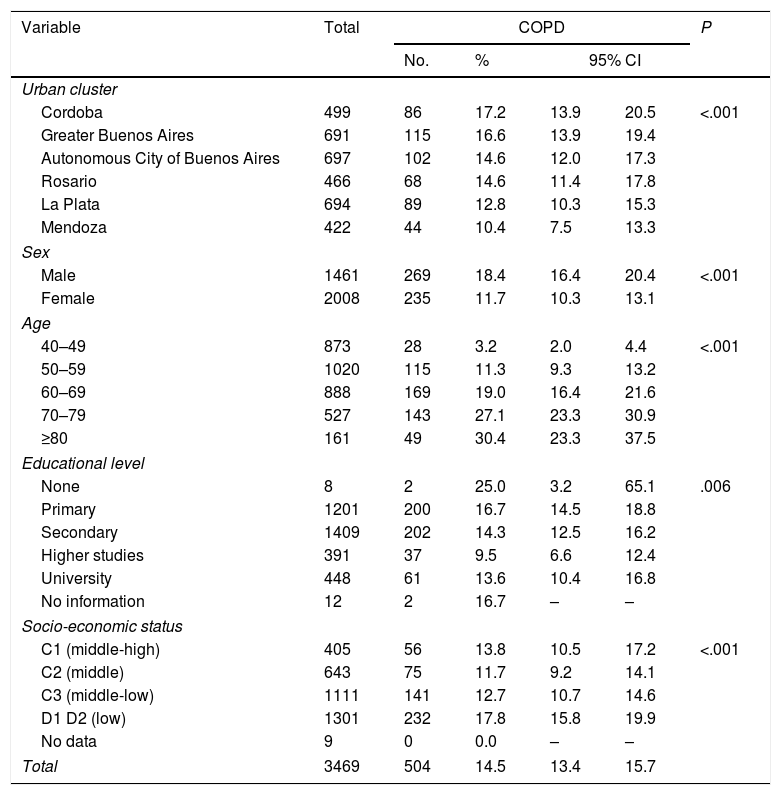
COPD prevalence was 14.5% (CI: 13.4–15.7), 18.4% (CI: 16.4–20.4) in men and 11.7% in women (CI: 10.3–13.1), and increased in each decade of life analyzed, from 3.2% (CI: 2.0–4.4) in subjects younger than 50 years of age to 30.4% (CI: 23.3–37.5) in patients 80 years of age or older (Table 3 and Fig. 3). Prevalence was higher in subjects with lower educational levels: 16.7% in subjects with primary education only (CI: 14.5%–18.8%); and lower socio-economic status: 17.8% in the lowest category (CI: 15.8%–19.9%). Overall COPD prevalence and differences among the urban clusters did not vary significantly after direct adjustment for sex, age, and education (Appendix B, Fig. A2 of the supplementary material).
COPD prevalence. Distribution by cluster, sex, age, education, and socioeconomic status.
| Variable | Total | COPD | P | |||
|---|---|---|---|---|---|---|
| No. | % | 95% CI | ||||
| Urban cluster | ||||||
| Cordoba | 499 | 86 | 17.2 | 13.9 | 20.5 | <.001 |
| Greater Buenos Aires | 691 | 115 | 16.6 | 13.9 | 19.4 | |
| Autonomous City of Buenos Aires | 697 | 102 | 14.6 | 12.0 | 17.3 | |
| Rosario | 466 | 68 | 14.6 | 11.4 | 17.8 | |
| La Plata | 694 | 89 | 12.8 | 10.3 | 15.3 | |
| Mendoza | 422 | 44 | 10.4 | 7.5 | 13.3 | |
| Sex | ||||||
| Male | 1461 | 269 | 18.4 | 16.4 | 20.4 | <.001 |
| Female | 2008 | 235 | 11.7 | 10.3 | 13.1 | |
| Age | ||||||
| 40–49 | 873 | 28 | 3.2 | 2.0 | 4.4 | <.001 |
| 50–59 | 1020 | 115 | 11.3 | 9.3 | 13.2 | |
| 60–69 | 888 | 169 | 19.0 | 16.4 | 21.6 | |
| 70–79 | 527 | 143 | 27.1 | 23.3 | 30.9 | |
| ≥80 | 161 | 49 | 30.4 | 23.3 | 37.5 | |
| Educational level | ||||||
| None | 8 | 2 | 25.0 | 3.2 | 65.1 | .006 |
| Primary | 1201 | 200 | 16.7 | 14.5 | 18.8 | |
| Secondary | 1409 | 202 | 14.3 | 12.5 | 16.2 | |
| Higher studies | 391 | 37 | 9.5 | 6.6 | 12.4 | |
| University | 448 | 61 | 13.6 | 10.4 | 16.8 | |
| No information | 12 | 2 | 16.7 | – | – | |
| Socio-economic status | ||||||
| C1 (middle-high) | 405 | 56 | 13.8 | 10.5 | 17.2 | <.001 |
| C2 (middle) | 643 | 75 | 11.7 | 9.2 | 14.1 | |
| C3 (middle-low) | 1111 | 141 | 12.7 | 10.7 | 14.6 | |
| D1 D2 (low) | 1301 | 232 | 17.8 | 15.8 | 19.9 | |
| No data | 9 | 0 | 0.0 | – | – | |
| Total | 3469 | 504 | 14.5 | 13.4 | 15.7 | |

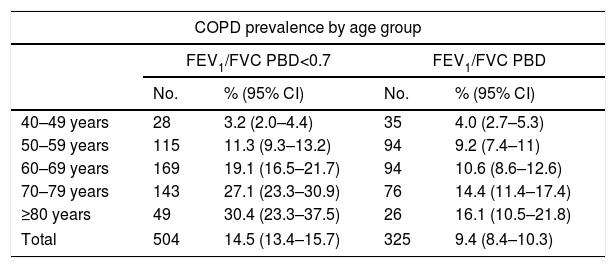
When the LLN criterion was applied, prevalence was 9.4%, n: 325 (CI: 8.4%–10.3%) (Table 4 and Appendix B, Tables A3 and A4 of the supplementary material), and a good correlation for spirometric diagnosis of obstruction was observed between both methods (k=0.735; CI: 0.700–0.770; P<.05). However, 187 cases (37.1%) classified as obstructive according to the GOLD criteria were considered normal according to the LLN method (Appendix B, Table A4 of the supplementary material), and when both spirometric criteria were compared, the prevalence of COPD in the older subgroups was lower with the LLN method (Table 4).
COPD prevalence by age group, obstruction, exposure, symptoms, and spirometric criteria.
| COPD prevalence by age group | ||||
|---|---|---|---|---|
| FEV1/FVC PBD<0.7 | FEV1/FVC PBD | |||
| No. | % (95% CI) | No. | % (95% CI) | |
| 40–49 years | 28 | 3.2 (2.0–4.4) | 35 | 4.0 (2.7–5.3) |
| 50–59 years | 115 | 11.3 (9.3–13.2) | 94 | 9.2 (7.4–11) |
| 60–69 years | 169 | 19.1 (16.5–21.7) | 94 | 10.6 (8.6–12.6) |
| 70–79 years | 143 | 27.1 (23.3–30.9) | 76 | 14.4 (11.4–17.4) |
| ≥80 years | 49 | 30.4 (23.3–37.5) | 26 | 16.1 (10.5–21.8) |
| Total | 504 | 14.5 (13.4–15.7) | 325 | 9.4 (8.4–10.3) |
| COPD prevalence by obstruction, exposure, and symptoms | ||||
|---|---|---|---|---|
| FEV1/FVC PBD<0.7 | FEV1/FVC PBD | |||
| No. | % (95% CI) | No. | % (95% CI) | |
| Obstruction only | 504 | 14.5 (13.4–15.7) | 325 | 9.4 (8.4–10.3) |
| Obstruction and exposure | 483 | 13.9 (12.8–15.1) | 310 | 9.0 (8.0–9.9) |
| Obstruction, exposure and symptomsa | 218 | 7.2 (6.3–8.1) | 159 | 5.2 (4.5–6.0) |
Severity of COPD according to spirometric obstruction (GOLD 2017) was: (1) mild 38% (CI: 34–43); (2) moderate 52% (CI: 47–56), (3) severe 10% (CI: 7–13); and (4) very severe 1% (CI: 0–2). The GOLD 2017 ABCD multidimensional assessment15,22 distribution was as follows: (A) 52% (CI: 47–56), (B) 43% (CI: 39–48), (C) 1% (CI: 0–2), and (D) 4% (CI: 2–6) (Fig. 4).
. Patients in subgroup A (grade 1: 24%; grade 2: 25%; grade 3: 2%; grade 4: 0%); B (grade 1: 14%; grade 2: 24%; grade 3: 6%; grade 4: 0%); C (Total 1%*: grade 1: 0%; grade 2: 1%; grade 3: 0%; grade 4: 0%) and D (total 4%*: grade 1: 0%; grade 2: 2%; grade 3: 1%; grade 4: 0%).")
Distribution of COPD cases according to GOLD 2017 multi-dimensional assessment. Prevalence of each ABCD subgroup with grades 1, 2, 3, and 4 for all COPD patients (n: 471). Patients in subgroup A (grade 1: 24%; grade 2: 25%; grade 3: 2%; grade 4: 0%); B (grade 1: 14%; grade 2: 24%; grade 3: 6%; grade 4: 0%); C (Total 1%*: grade 1: 0%; grade 2: 1%; grade 3: 0%; grade 4: 0%) and D (total 4%*: grade 1: 0%; grade 2: 2%; grade 3: 1%; grade 4: 0%).
Only 22.6% (114/504) of the subjects with obstructive spirometry results had a previous diagnosis of COPD, chronic bronchitis or emphysema made by a doctor. This is equivalent to an underdiagnosis rate of 77.4% (CI: 73.7–81.1), with no differences between men (77%) and women (78%). Of the 504 patients with a spirometric diagnosis of COPD, only 190 (38.1%) had performed at least 1 previous spirometry.
In contrast, 176 of the 290 subjects who reported that a doctor had given them a diagnosis of pulmonary emphysema, chronic bronchitis, or COPD, did not show an obstructive spirometric pattern. This is equivalent to a diagnostic error rate of 60.7% (CI: 55.1–66.3), lower in men (49%) than in women (69%), P<.001.
Only 27.6% (505/1828) of the subjects who reported symptoms of COPD (dyspnea, cough, expectoration, and wheezing) had performed at least 1 previous spirometry.
Analysis of prevalence of chronic obstructive pulmonary disease according to obstruction, exposure and symptomsCOPD prevalence varied when only the definition based on spirometric obstruction was taken into consideration (14.5%; CI: 13.4–15.7). Prevalence reduced progressively (7.2%; CI: 6.3–8.1), as exposure (smoking, occupational exposure, and indoor pollution) and symptoms (mMRC≥2 or CAT≥10) were added to the model (Table 4).
SmokingSmoking was found to be highly prevalent; 35% of all respondents were active smokers (33.5% women; 37% men), while 35.3% were former smokers (30% women; 42.6% men) and 29.7% were never-smokers (36.5% women; 20.4% men).
COPD prevalence in the study population was 16.9% among the 2439 active or former smokers, and 8.9% among the 1030 never smokers.
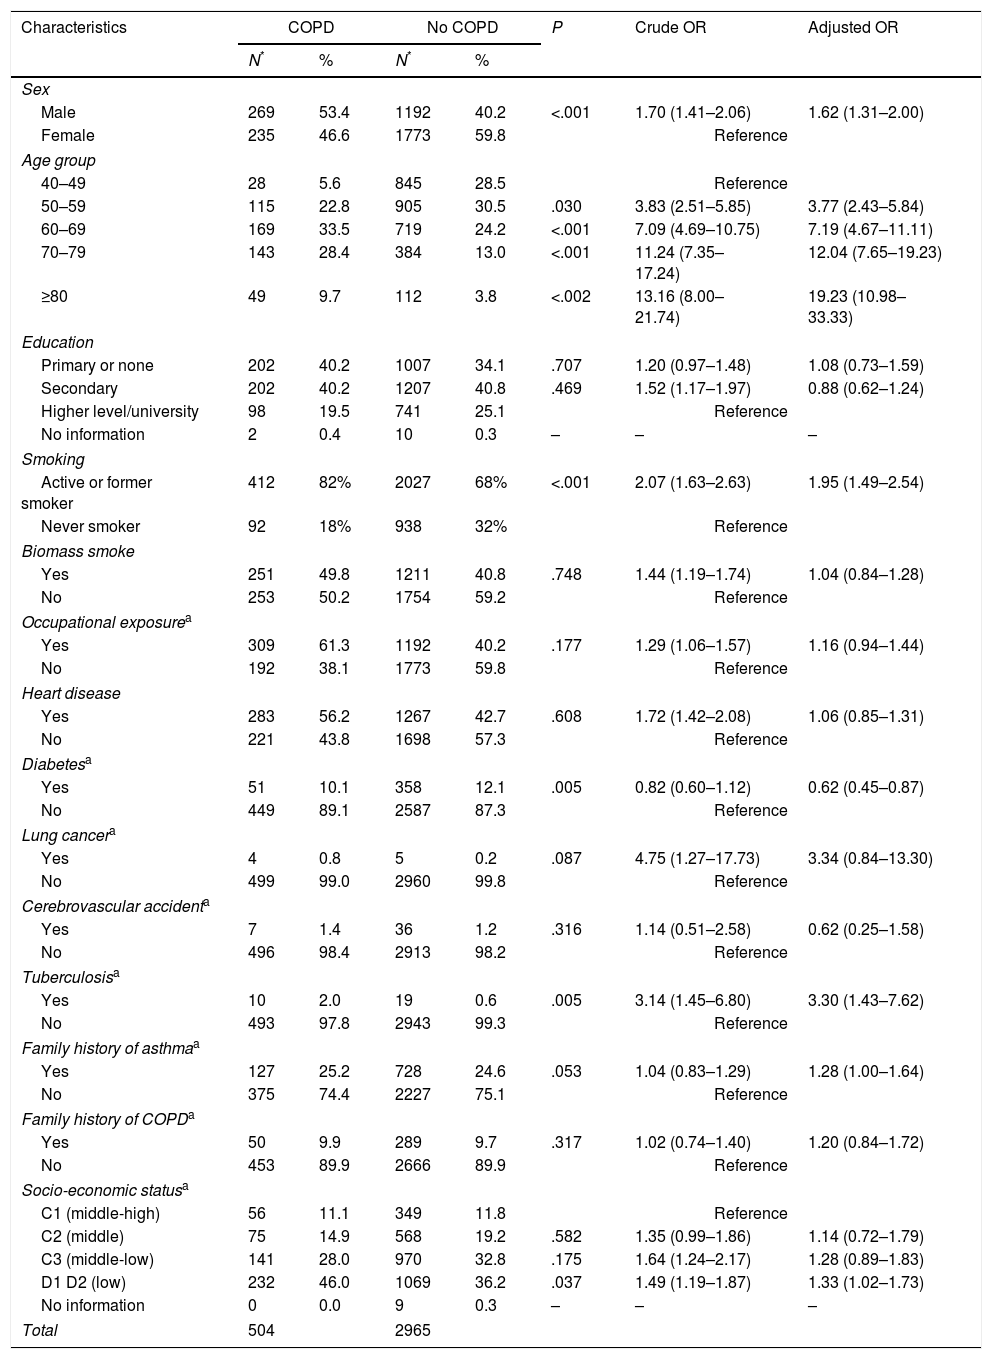
Among the 504 subjects who met spirometry criteria for COPD, 412 (82%) were active or former smokers and 92 (18%) had no history of an active or former smoking habit (Table 5).
COPD prevalence according to selected criteria: Number and percentages by category, crude OR, and OR adjusted by logistic regression for each category.
| Characteristics | COPD | No COPD | P | Crude OR | Adjusted OR | ||
|---|---|---|---|---|---|---|---|
| N* | % | N* | % | ||||
| Sex | |||||||
| Male | 269 | 53.4 | 1192 | 40.2 | <.001 | 1.70 (1.41–2.06) | 1.62 (1.31–2.00) |
| Female | 235 | 46.6 | 1773 | 59.8 | Reference | ||
| Age group | |||||||
| 40–49 | 28 | 5.6 | 845 | 28.5 | Reference | ||
| 50–59 | 115 | 22.8 | 905 | 30.5 | .030 | 3.83 (2.51–5.85) | 3.77 (2.43–5.84) |
| 60–69 | 169 | 33.5 | 719 | 24.2 | <.001 | 7.09 (4.69–10.75) | 7.19 (4.67–11.11) |
| 70–79 | 143 | 28.4 | 384 | 13.0 | <.001 | 11.24 (7.35–17.24) | 12.04 (7.65–19.23) |
| ≥80 | 49 | 9.7 | 112 | 3.8 | <.002 | 13.16 (8.00–21.74) | 19.23 (10.98–33.33) |
| Education | |||||||
| Primary or none | 202 | 40.2 | 1007 | 34.1 | .707 | 1.20 (0.97–1.48) | 1.08 (0.73–1.59) |
| Secondary | 202 | 40.2 | 1207 | 40.8 | .469 | 1.52 (1.17–1.97) | 0.88 (0.62–1.24) |
| Higher level/university | 98 | 19.5 | 741 | 25.1 | Reference | ||
| No information | 2 | 0.4 | 10 | 0.3 | – | – | – |
| Smoking | |||||||
| Active or former smoker | 412 | 82% | 2027 | 68% | <.001 | 2.07 (1.63–2.63) | 1.95 (1.49–2.54) |
| Never smoker | 92 | 18% | 938 | 32% | Reference | ||
| Biomass smoke | |||||||
| Yes | 251 | 49.8 | 1211 | 40.8 | .748 | 1.44 (1.19–1.74) | 1.04 (0.84–1.28) |
| No | 253 | 50.2 | 1754 | 59.2 | Reference | ||
| Occupational exposurea | |||||||
| Yes | 309 | 61.3 | 1192 | 40.2 | .177 | 1.29 (1.06–1.57) | 1.16 (0.94–1.44) |
| No | 192 | 38.1 | 1773 | 59.8 | Reference | ||
| Heart disease | |||||||
| Yes | 283 | 56.2 | 1267 | 42.7 | .608 | 1.72 (1.42–2.08) | 1.06 (0.85–1.31) |
| No | 221 | 43.8 | 1698 | 57.3 | Reference | ||
| Diabetesa | |||||||
| Yes | 51 | 10.1 | 358 | 12.1 | .005 | 0.82 (0.60–1.12) | 0.62 (0.45–0.87) |
| No | 449 | 89.1 | 2587 | 87.3 | Reference | ||
| Lung cancera | |||||||
| Yes | 4 | 0.8 | 5 | 0.2 | .087 | 4.75 (1.27–17.73) | 3.34 (0.84–13.30) |
| No | 499 | 99.0 | 2960 | 99.8 | Reference | ||
| Cerebrovascular accidenta | |||||||
| Yes | 7 | 1.4 | 36 | 1.2 | .316 | 1.14 (0.51–2.58) | 0.62 (0.25–1.58) |
| No | 496 | 98.4 | 2913 | 98.2 | Reference | ||
| Tuberculosisa | |||||||
| Yes | 10 | 2.0 | 19 | 0.6 | .005 | 3.14 (1.45–6.80) | 3.30 (1.43–7.62) |
| No | 493 | 97.8 | 2943 | 99.3 | Reference | ||
| Family history of asthmaa | |||||||
| Yes | 127 | 25.2 | 728 | 24.6 | .053 | 1.04 (0.83–1.29) | 1.28 (1.00–1.64) |
| No | 375 | 74.4 | 2227 | 75.1 | Reference | ||
| Family history of COPDa | |||||||
| Yes | 50 | 9.9 | 289 | 9.7 | .317 | 1.02 (0.74–1.40) | 1.20 (0.84–1.72) |
| No | 453 | 89.9 | 2666 | 89.9 | Reference | ||
| Socio-economic statusa | |||||||
| C1 (middle-high) | 56 | 11.1 | 349 | 11.8 | Reference | ||
| C2 (middle) | 75 | 14.9 | 568 | 19.2 | .582 | 1.35 (0.99–1.86) | 1.14 (0.72–1.79) |
| C3 (middle-low) | 141 | 28.0 | 970 | 32.8 | .175 | 1.64 (1.24–2.17) | 1.28 (0.89–1.83) |
| D1 D2 (low) | 232 | 46.0 | 1069 | 36.2 | .037 | 1.49 (1.19–1.87) | 1.33 (1.02–1.73) |
| No information | 0 | 0.0 | 9 | 0.3 | – | – | – |
| Total | 504 | 2965 | |||||
The association between smoking and COPD was significant (OR: 1.95; CI: 1.49–2.54), both in the crude analysis and after adjustment using logistic regression (Table 5). This association was maintained when smokers and former smokers were compared by sex, with a closer association observed for men. In total, 248 men (21.3%) and 164 women (12.9%) with COPD and a history of smoking were identified (Fig. 5). The corresponding OR for the association between smoking and COPD was 3.95 for men, and 1.42 for women.
 or no history of smoking (never-smoker). Distribution by sex.")
Exposure to tobacco was similar in the 6 urban clusters (Appendix B, Table A5 of the supplementary material).
Adjusted analysis of risk factors and other variables related with chronic obstructive pulmonary diseaseTable 5 shows the association between numbers of COPD cases with selected characteristics and spirometry-confirmed COPD, along with the OR for the crude association and the association adjusted by binary logistic regression. Sex, age, smoking (current or previous), socioeconomic status, history of tuberculosis, and a family history of asthma showed a statistically significant association with the presence of COPD. The associations with COPD persisted after adjustment by logistic regression, taking into account the concomitant presence of all the other variables. Diabetes and obesity showed an inverse association: fewer COPD patients presented concomitant diabetes and obesity (Appendix B, Tables 5 and A6 of the supplementary material).
DiscussionThe EPOC.AR study is the first to contribute data on COPD prevalence in the general population in Argentina aged 40 years and over, and to our knowledge, the fourth population study conducted in Latin America.9–11
Unlike other COPD prevalence studies,23–25 subjects were studied in their own homes, whereas the study design, methodology,9–11,26 and spirometers used have been validated by other authors.9,25,27–29 These factors, along with strict quality supervision by the Central Spirometry Committee (90% of spirometries met Enright criteria A, B or C, and no significant differences were observed in quality among the 6 centers) guarantee the validity of our results.
The NHANES III equations were selected for comparison, since they are the most widely used references equations in Argentina.30,31 GLI 2012 theoretical equations were not used as they were not available at the time of the study.32
The overall prevalence of COPD in the 6 urban areas of the study was 14.5%, ranging from 10.4% in Mendoza to 17.2% in Cordoba. These results are average compared to other data from the region, in which prevalence ranges from the low levels observed in 4 cities in Peru (6%) and Mexico City (7.8%) to the higher levels found in Santiago de Chile (Chile) and Montevideo (Uruguay), 16.9% and 19.7%, respectively. This suggests that prevalence varies widely between different countries, and among the various cities of each country, as has been previously described.9–11,33,34
Figures emerging from Argentina and South America support the notion of a greater prevalence of the disease in the areas referred to by the World Health Organization as “the Americas”,34 and point to an increase in the worldwide caseload from an estimated 149.1 million cases (CI: 137.4–160.7) in 2005 to 174.5 million (CI: 160.2–190) in 2015; in other words, a 17% (CI: 15.1%–19%) increase in overall prevalence.3 These same reports indicate that the disease burden is greater in urban populations than in rural areas, an important consideration in Argentina and in the region in general.
The recent publication of the GOLD 2017 strategy has enabled us to assess COPD patients on the basis of 16 different domains.15,22 It is interesting to note that in our study, patients classified as A and B had less obstruction (9% grade 3 or 4) compared to those in categories C and D (39% grade 3 or 4), suggesting a closer than expected association between obstruction, symptoms, and exacerbations.
The significant percentage of patients with mild-to-moderate obstruction and few symptoms might explain the significant rate of underdiagnosis found in our study (77.4%). This phenomenon has already been described in the region (88.7% and 87.4% in the PLATINO and PREPOCOL studies9,10), as well as in other parts of the world, such as Spain, where underdiagnosis rates of 73% have been reported (EPI-SCAN26).
Similarly, we observed significant underuse of spirometry and high rates of diagnostic error or overdiagnosis (60.7%) in subjects with symptoms consistent with COPD.
When exposure and symptoms were added to the definition of COPD, disease prevalence fell, as might be expected, to 7.2% (GOLD 2017). The magnitude of this reduction was much greater after symptoms were taken into consideration, possibly because a high percentage of individuals presented few symptoms. In our study, the factor most strongly associated with COPD prevalence was age, also reported by other authors.9,26 Although the prevalence of COPD measured by LLN was foreseeably lower than that obtained from the fixed ratio, the progressive increase of both spirometric criteria by age suggests the effect of a longer period of exposure. Differences in the distribution of age groups may have contributed to the differences in COPD prevalence observed among the different cities of Latin America.
The second most significant factor, in line with other studies, was smoking.9–11,26 The reported proportion of active smokers was high (35%), and significantly more so in men. These values are higher than those described in previous surveys conducted in Argentina, in which 25.1% of respondents over 18 years of age were active smokers,35 but similar to prevalences reported in Santiago de Chile9 and Spain.36 This discrepancy may be due to the different methodology employed and to differences in the study populations of the previous survey and ours. The COPD prevalence in never-smokers (8.9%) falls midway between numbers reported in Latin America (5.2%–15.9%)9,10 and is similar to that of other regions.26,37 Various factors, such as age, passive smoking, exposure to biomass smoke, and respiratory disease in infancy have been associated with COPD in never-smokers.26,37
Male sex (with a greater prevalence of smoking), low socio-economic status, and a history of tuberculosis were associated independently with COPD, in line with previous publications.4,9–11,26 Interestingly, we found an inverse correlation between diabetes and COPD. A positive correlation between these 2 diseases has been described,38 but in our series, this finding may be due to the greater proportion of obese individuals among the non-COPD population.
Our study has limitations that should be pointed out. The study population, like other population studies,9–11,26 was predominantly female. This could be due to the greater likelihood of women being at home at the time of the interview, particularly during the morning, and a greater willingness among women to perform the study procedures. The total amount of data lost due to refusal to participate and poor quality spirometries was similar to that previously reported.9,10 The main causes for failure to conduct the evaluations were refusal to participate because of lack of time or absence of the subject from home at the time of the appointment. Although we cannot rule out the influence of a potential selection bias, the analysis of another publication that evaluated non-responders seems to conclude that this factor is not significant.9
ConclusionsOn the basis of our results, we estimate that over 2.3 million people in Argentina may have COPD. The high prevalence of smoking underlines the need to place emphasis on anti-smoking campaigns. The high rate of underdiagnosis, the underuse of spirometry and the high rate of diagnostic error or overdiagnosis show that health strategies are needed to raise awareness of the disease among the population and among healthcare professionals. The data collected from the study will be useful for identifying other characteristics of the disease in Argentina (comorbidities, therapeutic modalities, and access to treatment) and for incorporating and assessing the new domains established by the recently published GOLD strategy.
FundingThis study was funded by an educational grant from GSK (7SCO117383). The sponsor did not participate in the study design, data collection, data analysis and interpretation, or in the drafting of this article.
Conflict of interestsThe authors state that they have no conflict of interests.
We thank in particular Raúl Bozzo from IC Projects and his secretary Alicia Parera for their constant assistance during the conduct of this study.
AAMR Scientific Committee: María Cristina Borrajo (Pcia. de Buenos Aires, Sección Tabaquismo AAMR 2013), Juan Arturo Precerutti (CABA, Sección Neumonología Clínica AAMR 2013), Eduardo Armando Schiavi (CABA), Guillermo Menga (CABA), Santiago Enrique Rossi (CABA, Sección Imágenes AAMR 2013), Ana María López (Córdoba), Miguel Alberto Penizzotto (Corrientes), Pablo Saez Scherbovsky (Mendoza, Sección de Inmunología y Enfermedades Obstructivas AAMR 2013), Gustavo Enrique Zabert (Neuquén), Carlos Sebastián Wustten (Paraná), Hector Daniel Schönfeld (Puerto Madryn, Presidente AAMR 2013–2014), Juan Carlos Figueroa Casas (Rosario), Marcelino de Vega (Salta), Ramón Ángel Rojas (Tucumán).
Spirometry technicians, nurses, and doctors
La Plata: Valeria González; Mónica Zarate; Patricia Madeo Gómez; Rocío Berardi; María del Carmen Sánchez. Rosario: Malvina Piana; Nadia Soledad Neumayer; María Celeste Pellicciotti; Valeria Soledad Milano; Rodolfo Navarrete; Maria Florencia Nannini. Greater Buenos Aires: María Agustina D’Agostino; María de los Ángeles Basavilbaso; María Virginia Sandlien; María Sol Badano; Carolina Erhardt; Aldana Andrea Colombo Rey; Angélica Marcela Schaffer; Bárbara Elizabeth Schaffer; Carla Ronco; Maria Golè. Autonomous City of Buenos Aires: Susana Quevedo; Elizabeth M. Sangiovanni; María Cristina Burgos; Cecilia Fernández; Lucas Sheridan; Andrea Dardowski; Tania Rodríguez; Alberto Levi. Cordoba: Marcos Elías; Noelia Arrillaga; Claudia Fernández; Manuel Ferreyra; Ana Carolina Markiewicz; María Victoria Batistella; Gabriel Eduardo Luna; Julio Andrés Moyano Casco; Vanesa Perrone; Andrea Guzman; Juan Ponce; Erica Ivana Cuestas. Mendoza: Diana Salvioli; Gustavo A. Torres; Alfredo R. Moran; Andrea S. Mancinelli; Nicolás Cangiani; Héctor Varas; Gerardo Malberti; Daniel A. Sánchez; Pablo Guarnieri; Adrian Armoa; Leandro E. Diaz; Gianina Coletto; Natalia Valletto; Maria Laura Ríos; Pablo Moyano; Nuri Nahir Plata. Central Spirometry Committee: Santiago C. Arce; Ricardo del Olmo; Adrian Ceccatto; Mariano H. Fielli; Juan M. Lucchelli; Evelin N. Sureda.
Principal investigators and co-investigators: La Plata: Mario Macuso (Hospital San Juan de Dios de la Plata) and Eduardo Maniago (Hospital San Roque de Gonnet). Rosario: Walter Gardeñez (Hospital Provincial del Centenario) and Marcelo Figueroa Casas (Instituto Cardiovascular de Rosario). Vicente López and Gran Buenos Aires: Patricia Malamud (Hospital del Tórax Dr. Antonio Cetrángolo) and Álvaro Alonso (Sanatorio Las Lomas). CABA: Santiago Auteri and Martín Fernández (Hospital María Ferrer). Mendoza: Ramón Alchapar and Diana Salvioli (Hospital J.N. Lencinas) and Carlos Elías (INSARES). Córdoba: Susana Lühning (Hospital Nacional de Clínicas) and Juan Pablo Casas (Sanatorio Allende Cerro).
Please cite this article as: Echazarreta AL, Arias SJ, del Olmo R, Giugno ER, Colodenco FD, Arce SC, et al. Prevalencia de enfermedad pulmonar obstructiva crónica en 6 aglomerados urbanos de Argentina: el estudio EPOC.AR. Arch Bronconeumol. 2018;54:260–269.


www.publicationethics.org.


Archivos de Bronconeumología follows the Recommendations for the Conduct, Reporting, Editing and Publication of Scholarly Work in Medical Journals