Hypocapnia and respiratory alkalosis are common arterial blood gas (ABG) abnormalities in patients with acute pulmonary embolism (PE) [1]. While the exact mechanisms leading to hypocapnia in this context are not fully understood, a response to hypoxia and complex chemosensitive neural reflexes triggered by thrombi are thought to induce hyperventilation [2]. Additionally, the arterial partial pressure of CO2 (PaCO2) serves as a surrogate marker for dead space ventilation and may help estimate the degree of pulmonary artery obstruction [2]. Indeed, a PaCO2 value of ≤30mmHg has been associated with obstruction of more than 50% of the pulmonary arterial bed [3].
Although the clinical significance of hypocapnia at diagnosis is well-established [1], less attention has been given to its prognostic value over time in acute PE [4]. Our aim was to evaluate the association between initial PaCO2 levels and all-cause mortality at 7, 30, and 90 days in patients with acute PE. Additionally, we explored whether this relationship varied by PE risk stratification. Data were obtained from the Registro Informatizado de la Enfermedad TromboEmbólica (RIETE) registry.
ABG analysis was performed within the first six hours of PE diagnosis at the discretion of the treating physician; the timing of anticoagulation in relation to ABG collection was not consistently recorded in the registry. After excluding 176 patients with implausible PaCO2 values (<20 or >140mmHg), 28,883 patients diagnosed from March 2001 to April 2023 were included.
PE severity was classified according to the European Society of Cardiology (ESC) guidelines. Low-risk PE was defined as a simplified Pulmonary Embolism Severity Index (sPESI) of zero with no right ventricular (RV) dysfunction and no elevated troponin. High-risk PE was defined by systolic blood pressure<90mmHg; all others were considered intermediate risk.
We performed multivariable logistic regression to assess the association between PaCO2 values and all-cause mortality at 7, 30, and 90 days. The models were adjusted for the following covariates: age (>80 vs. ≤80 years), sex, RV dysfunction, troponin levels (elevated vs. normal), active cancer, chronic respiratory disease, chronic heart failure, heart rate (≥110 vs. <110 per minute), systolic blood pressure (≥100 vs. <100mmHg), renal dysfunction (creatinine clearance <60 vs. ≥60mL/min), oxygen saturation (<90% vs. ≥90%), and PaCO2 category. PaCO2 was stratified into three clinically relevant categories: <30mmHg, 30–39mmHg, and ≥40mmHg.
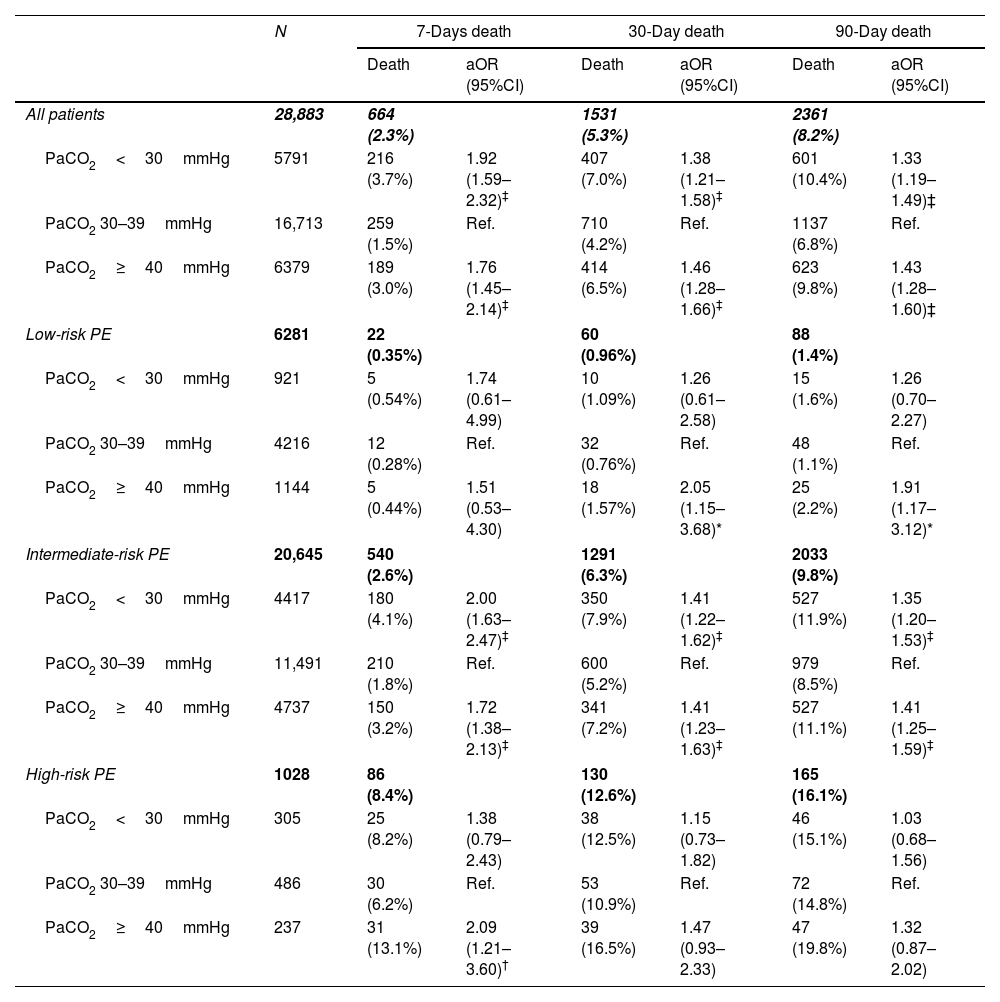
In univariable analysis, patients with PaCO2<30mmHg had significantly higher mortality at 7 days (odds ratio [OR]: 2.46; 95%CI: 2.05–2.96), 30 days (OR: 1.70; 95%CI: 1.50–1.93), and 90 days (OR: 1.59; 95%CI: 1.43–1.76), compared with those with PaCO2 30–39mmHg. Patients with PaCO2 ≥40mmHg also showed increased mortality at 7 days (OR: 1.94; 95%CI: 1.60–2.35), 30 days (OR: 1.56; 95%CI: 1.38–1.77), and 90 days (OR: 1.48; 95%CI: 1.34–1.64). In multivariable analysis, both low and high PaCO2 values remained significantly associated with higher mortality compared to the reference group (30–39mmHg). Specifically, PaCO2<30mmHg was associated with increased mortality at 7 days (adjusted OR [aOR]: 1.92; 95%CI: 1.59–2.32), 30 days (aOR: 1.38; 95%CI: 1.21–1.58), and 90 days (aOR: 1.33; 95%CI: 1.19–1.49). Similarly, PaCO2≥40mmHg was associated with higher mortality at 7 days (aOR: 1.76; 95%CI: 1.45–2.14), 30 days (aOR: 1.46; 95%CI: 1.28–1.66), and 90 days (aOR: 1.43; 95%CI: 1.28–1.60).
Other variables independently associated with increased 7-day mortality included: age>80 years (aOR: 1.69; 95%CI: 1.41–2.02), male sex (aOR: 1.30; 95%CI: 1.10–1.53), elevated troponin (aOR: 1.23; 95%CI: 1.03–1.47), active cancer (aOR: 2.54; 95%CI: 2.13–3.03), heart rate ≥110 per minute (aOR: 1.57; 95%CI: 1.33–1.87), systolic blood pressure<100mmHg (aOR: 2.33; 95%CI: 1.91–2.84), creatinine clearance<60mL/min (aOR: 2.47; 95%CI: 2.04–2.99), and oxygen saturation<90% (aOR: 1.85; 95%CI: 1.57–2.17).
Our results show that both low (<30mmHg) and high (≥40mmHg) PaCO2 levels were independently associated with increased mortality at all time points compared with the reference group (30–39mmHg). This pattern was observed in the overall population and within most PE risk groups, particularly among intermediate-risk patients. Adjusted odds ratios (with 95% confidence intervals) and event rates are presented in Table 1.
All-cause mortality at 7, 30, and 90 days according to baseline PaCO2 categories.
N | 7-Days death | 30-Day death | 90-Day death | ||||
---|---|---|---|---|---|---|---|
Death | aOR (95%CI) | Death | aOR (95%CI) | Death | aOR (95%CI) | ||
All patients | 28,883 | 664 (2.3%) | 1531 (5.3%) | 2361 (8.2%) | |||
PaCO2<30mmHg | 5791 | 216 (3.7%) | 1.92 (1.59–2.32)‡ | 407 (7.0%) | 1.38 (1.21–1.58)‡ | 601 (10.4%) | 1.33 (1.19–1.49)‡ |
PaCO2 30–39mmHg | 16,713 | 259 (1.5%) | Ref. | 710 (4.2%) | Ref. | 1137 (6.8%) | Ref. |
PaCO2≥40mmHg | 6379 | 189 (3.0%) | 1.76 (1.45–2.14)‡ | 414 (6.5%) | 1.46 (1.28–1.66)‡ | 623 (9.8%) | 1.43 (1.28–1.60)‡ |
Low-risk PE | 6281 | 22 (0.35%) | 60 (0.96%) | 88 (1.4%) | |||
PaCO2<30mmHg | 921 | 5 (0.54%) | 1.74 (0.61–4.99) | 10 (1.09%) | 1.26 (0.61–2.58) | 15 (1.6%) | 1.26 (0.70–2.27) |
PaCO2 30–39mmHg | 4216 | 12 (0.28%) | Ref. | 32 (0.76%) | Ref. | 48 (1.1%) | Ref. |
PaCO2≥40mmHg | 1144 | 5 (0.44%) | 1.51 (0.53–4.30) | 18 (1.57%) | 2.05 (1.15–3.68)* | 25 (2.2%) | 1.91 (1.17–3.12)* |
Intermediate-risk PE | 20,645 | 540 (2.6%) | 1291 (6.3%) | 2033 (9.8%) | |||
PaCO2<30mmHg | 4417 | 180 (4.1%) | 2.00 (1.63–2.47)‡ | 350 (7.9%) | 1.41 (1.22–1.62)‡ | 527 (11.9%) | 1.35 (1.20–1.53)‡ |
PaCO2 30–39mmHg | 11,491 | 210 (1.8%) | Ref. | 600 (5.2%) | Ref. | 979 (8.5%) | Ref. |
PaCO2≥40mmHg | 4737 | 150 (3.2%) | 1.72 (1.38–2.13)‡ | 341 (7.2%) | 1.41 (1.23–1.63)‡ | 527 (11.1%) | 1.41 (1.25–1.59)‡ |
High-risk PE | 1028 | 86 (8.4%) | 130 (12.6%) | 165 (16.1%) | |||
PaCO2<30mmHg | 305 | 25 (8.2%) | 1.38 (0.79–2.43) | 38 (12.5%) | 1.15 (0.73–1.82) | 46 (15.1%) | 1.03 (0.68–1.56) |
PaCO2 30–39mmHg | 486 | 30 (6.2%) | Ref. | 53 (10.9%) | Ref. | 72 (14.8%) | Ref. |
PaCO2≥40mmHg | 237 | 31 (13.1%) | 2.09 (1.21–3.60)† | 39 (16.5%) | 1.47 (0.93–2.33) | 47 (19.8%) | 1.32 (0.87–2.02) |
To further illustrate the time-dependent relationship between PaCO2 and outcomes, we constructed a Kaplan–Meier curve for cumulative all-cause mortality, stratified by PaCO2 category. As shown in the Fig. 1, mortality increased progressively over 90 days in all groups but was consistently higher in patients with PaCO2<30mmHg or ≥40mmHg. At 30 days, cumulative mortality reached 7.1% in the <30mmHg group and 6.6% in the ≥40mmHg group, compared with 4.3% in the reference category. The difference across groups was statistically significant (log-rank p<0.001).
To our knowledge, this is the largest study to date evaluating PaCO2 as a prognostic biomarker in acute PE. Our findings reveal a non-linear (U-shaped) relationship between PaCO2 and mortality, with both hypocapnia and hypercapnia independently associated with adverse outcomes. Interestingly, initial PaCO2 levels were not aligned with ESC risk stratification, and their prognostic value appeared to be independent. For instance, among patients, classified as low-risk according to ESC guidelines, those with PaCO2≥40mmHg still had a significantly higher 30-day mortality (adjusted OR: 2.05; 95%CI: 1.15–3.68). This suggests that elevated PaCO2 may help identify additional risk not captured by standard ESC classification.
Previous studies examining the prognostic value of PaCO2 in acute PE have yielded inconsistent results [4,5]. In some cases, transcutaneous CO2 monitoring has been used as a non-invasive surrogate for arterial PaCO2. However, this method may be less reliable in hypocapnic states, where it tends to underestimate true PaCO2 levels due to technical and physiological limitations [6]. Additionally, long-term outcomes such as chronic thromboembolic pulmonary can influence mortality and may confound the interpretation of short-term prognostic markers like baseline PaCO2[7,8].
Although PaCO2 was independently associated with mortality after adjusting for established risk factors, we did not formally assess whether its inclusion improved overall model performance. Further work is needed to evaluate whether PaCO2 adds incremental predictive value beyond current ESC-based risk stratification tools.
This study has limitations. We relied on a single baseline PaCO2 value. Prior research suggests that temporal trends in PaCO2 may be more informative [5]. Additionally, the registry did not systematically record FiO2 or supplemental oxygen use at the time of ABG. Finally, we could not assess the arterial-venous CO2 gap, which has been shown to correlate with hemodynamic severity in PE.
In conclusion, our findings demonstrate that initial PaCO2 values outside the 30–39mmHg range are independently associated with increased short- and mid-term mortality in patients with acute PE. PaCO2 may serve as a valuable early marker of adverse outcomes and should be considered in future prognostic assessments of PE.
Author contributionDRC Wrote and revised the manuscript. Conceived and designed the study and supervised, contributed to interpreting the results.
JGG Contributed to interpreting the results, read and agreed to the published version of the manuscript.
KK contributed to interpreting the results, read and agreed to the published version of the manuscript.
BB read and agreed to the published version of the manuscript.
JFR read and agreed to the published version of the manuscript.
JC read and agreed to the published version of the manuscript.
AS read and agreed to the published version of the manuscript.
ALR read and agreed to the published version of the manuscript.
HMB read and agreed to the published version of the manuscript.
MM Wrote and revised the manuscript. Conceived and designed the study and supervised. Contributed to interpreting the results, read and agreed to the published version of the manuscript.
Artificial intelligence involvementNo AI was involvement in this work.
FundingSANOFI and ROVI supporting this Registry with an unrestricted educational grant.
Conflict of interestThere are no conflicts of interest to report.
We express our gratitude to SANOFI and ROVI for supporting this Registry with an unrestricted educational grant. We also thank the RIETE Registry Coordinating Center, S&H Medical Science Service, for their quality control data, logistic and administrative support and Prof. Salvador Ortiz, Universidad Autónoma de Madrid, Statistical Advisor in S&H Medical Science Service for the statistical analysis of the data presented in this paper.
SPAIN: Abad-Fernández A, Adarraga MD, Agudo P, Aibar J, Alberich-Conesa A, Alfonso J, Amado C, Angelina-García M, Arcelus JI, Ballaz A, Barba R, Barbagelata C, Barrón M, Barrón-Andrés B, Beddar-Chaib F, Blanco-Molina Á, Bonavila CS, Cantarella RF, Chasco L, Claver G, Crecente P, Creu-Paris J, Criado J, De Juana-Izquierdo C, Del Toro J, Demelo-Rodríguez P, Díaz-Pedroche MC, Díaz-Peromingo JA, Dubois-Silva Á, Durán D, Escribano JC, Fernández-Bermejo LA, Fernández-Capitán C, Fernández-Reyes JL, Fidalgo MÁ, Formica A, Francisco I, Gabara C, Galeano-Valle F, García-Bragado F, García-Ortega A, Gavín-Sebastián O, Gil-Díaz A, Girona E, Gómez-Cuervo C, González-García JG, González-Munera A, Gorostidi-Pérez J, Guirado L, Gutiérrez-Guisado J, Hernández-Blasco L, Hernández-Vidal MJ, Huélamo-López P, Jiménez D, Jou I, Joya MD, Lalueza A, Lecumberri R, Llamas P, López-Jiménez L, López-Miguel P, López-Núñez JJ, López-Ruiz A, López-Sáez JB, Lorenzo A, Maestre A, Marchena PJ, Marcos M, Marín-Baselga R, Martín-del Pozo M, Melero M, Mercado MI, Moisés-Lafuente J, Monreal M, Monzón L, Moreno-Casas S, Moreno-Fernández A, Navas MS, Nieto JA, Núñez-Fernández MJ, Olid M, Olivares MC, Ordieres-Ortega L, Ortiz M, Osorio J, Otálora S, Pagán J, Parra-Caballero P, Payró-Bisart B, Pedrajas JM, Pérez-Ductor C, Pérez-Pinar M, Peris ML, Pesce ML, Porras JA, Prieto-Gañán LM, Puche G, Rivas A, Rivera-Cívico F, Rivera-Gallego A, Roca M, Rodríguez-Chiaradía DA, Rodríguez-Cobo A, Ruiz-Artacho P, Ruiz-Giménez N, Salgueiro G, Sancho T, Sendín V, Sidawi T, Sierra-Palomares G, Solé A, Soler S, Suárez-Fernández S, Tirado R, Toda MR, Tolosa C, Trujillo-Santos J, Tung-Chen Y, Uresandi F, Valle R, Varona JF, Vázquez E, Vega-Romero E, Vicente-Navarro D, Vidal G, Villares P, You JS, AUSTRIA: Ay C, Nopp S, Pabinger I, BELGIUM: Van Thillo Q, Verhamme P, Verstraete A, BRAZIL: Yoo HHB, COLOMBIA: Jiménez-Echandía CA, Montenegro AC, Roa J, CZECH REPUBLIC: Grenar P, Hirmerova J, Malý R, FRANCE: Accassat S, Bertoletti L, Bura-Riviere A, Catella J, Chopard R, Couturaud F, Espitia O, Le Mao R, Mahé I, Morange P, Moustafa F, Plaisance L, Poenou G, Quéré I, Sarlon-Bartoli G, Suchon P, Versini E, GERMANY: Schellong S, IRAN: Jenab Y, Khodayari A, Sadeghipour P, Yadangi S, ISRAEL: Brenner B, Dally N, Kenet G, Tzoran I, ITALY: Basaglia M, Bilora F, Bissacco D, Bortoluzzi C, Bortoluzzi M, Brandolin B, Casana R, Ciammaichella MM, Di Micco P, Imbalzano E, Lambertenghi-Deliliers D, Mastroiacovo D, Pesavento R, Pizzuti V, Prandoni P, Scarinzi P, Siniscalchi C, Visonà A, Vo Hong N, Zalunardo B, LATVIA: Kigitoviča D, Paluga R, Skride A, MEXICO: Domínguez-Cruz CP, Mendoza Romo-Ramírez MÁ, Parra-García CL, MOROCCO: Tazi-Mezalek Z, PORTUGAL: Fonseca S, Fontes C, Meireles J, Soeiro B, REPUBLIC OF NORTH MACEDONIA: Bosevski M, SWITZERLAND: Barco S, Mazzolai L, USA: Angiolillo DJ, Caprini JA, Ortega-Paz L, Tafur AJ, VIETNAM: Bui HM, Nguyen ST, Pham KQ, Tran GB.
Coordinator of the RIETE Registry: Manuel Monreal.
RIETE Steering Committee Members: Paolo Prandoni, Benjamin Brenner and Dominique Farge-Bancel.
RIETE National Coordinators: Raquel Barba (Spain), Peter Verhamme (Belgium), Hugo Hyung Bok Yoo (Brazil), Radovan Malý (Czech Republic), Laurent Bertoletti (France), Sebastian Schellong (Germany), Inna Tzoran (Israel), Pierpaolo Di Micco (Italy), Abilio Reis (Portugal), Marijan Bosevski (R. North Macedonia), Lucia Mazzolai (Switzerland), Joseph A. Caprini (USA), Hanh My Bui (Vietnam).
RIETE Registry Coordinating Center: S & H Medical Science Service.