
Chronic bronchial infection (CBI) involves persistent inflammation and impaired mucociliary clearance, increasing exacerbations and symptom burden across structural lung diseases.1 These events reduced quality of life and increase mortality.2,3 Long-term inhaled antibiotics (IA) can reduce bacterial load, eradicate pathogens, decrease exacerbations, and improve symptoms and quality of life.4–6 However, most evidence comes from cystic fibrosis (CF), with limited data in non-CF bronchiectasis or other structural lung diseases.7–9 Heterogeneity in underlying conditions contributes to inconsistent bronchiectasis trial results, limiting patient selection and statistical power.10 This highlights the need to understand differential IA responses in CBI to optimize future trials.10,11 Phenotyping approaches have been used in chronic obstructive pulmonary disease (COPD), bronchiectasis, and asthma to identify clinical clusters with distinct prognoses and therapeutic responses.10 However, such analyses have not yet been applied to CBI populations treated with IA.
The INBREATHING study is a retrospective, multicentre cohort study conducted across 10 Spanish hospitals, including 402 adult patients with CBI treated with IA and followed in outpatient clinics between January 2018 and June 2024. CBI was diagnosed according to national guideline criteria.1,12 Baseline clinical, functional, and microbiological data were collected at IA initiation. One-year follow-up assessed changes in exacerbations, symptoms, and treatment tolerance. Pre-treatment clinical data were used to identify phenotypes within the cohort, including demographic variables, comorbidities, underlying respiratory diseases, lung function, and chronic therapies. To identify phenotypes and evaluate its reproducibility, the cohort was randomly split into training and test subgroups (1:1). Phenotypes were derived in the training set using k-prototypes clustering with multiple imputation13 and reproducibility was assessed in the test set. Then, each dataset was clustered by the k-prototypes algorithm. Finally, hierarchical cluster with average linkage was used to assigned patient in each phenotype. The number of phenotypes was determined using elbow method based on the summation of within-cluster distances for classes ranging from 0 to 10. Clinical differences between phenotypes were analyzed, and their association with one-year exacerbation risk after IA treatment was evaluated using multivariable logistic regression. Predictor selection was based on bivariate analyses and refined by backward stepwise selection using the Akaike Information Criterion. Model performance was assessed via the area under the ROC curve, and results were visualized using forest plots.
The cohort included 402 patients (mean age of 71.6±13.3 years; 55.2% male). Common comorbidities were history of cancer (18.4%), heart disease (15.2%), atrial fibrillation (14.7%), and kidney disease (10.4%). The most prevalent underlying respiratory diseases were bronchiectasis (77.8%) and COPD (39.6%). Among bronchiectasis patients, the most common radiological pattern was cylindrical (78.1%), followed by varicose (23.5%) and cystic (17.0%). Mean FEV1 was 65.8 (25.1) percent predicted value, with 39.4% showing mild-to-moderate and 29.17% severe impairment. Inhaled corticosteroids were used by 65.9%, and 19.2% received alternate-day azithromycin. Pseudomonas aeruginosa was the most common pathogen (81.1%); colistin (72.9%) and tobramycin (14.7%) were the main IA treatments. Median IA duration was 12.0 months (IQR: 5.6–23.8). Further details are provided in Table 1.
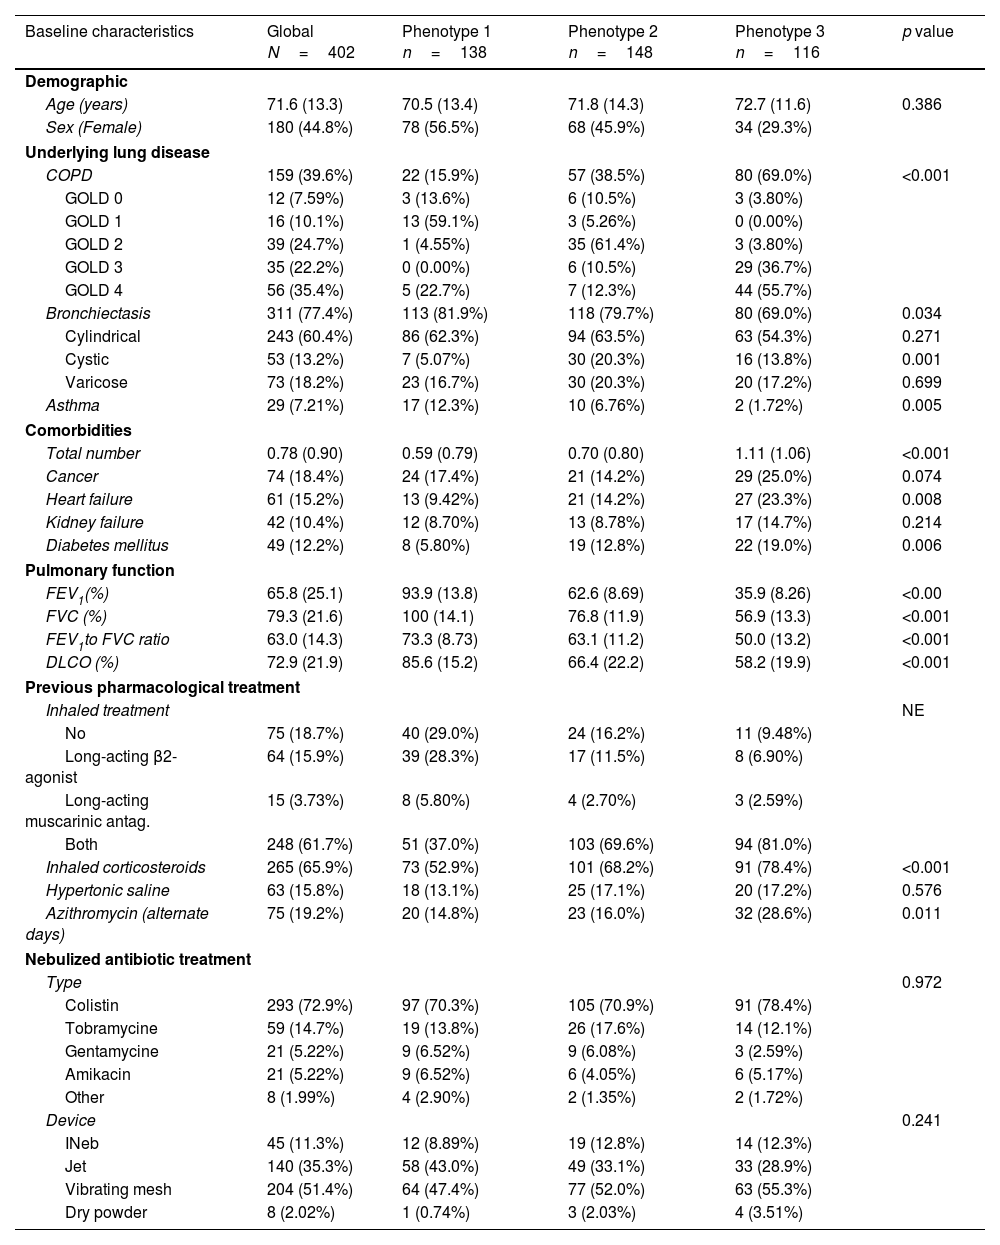
Clinical characteristics, exacerbation rates, longitudinal changes in pulmonary function parameters and other outcomes before and after Inhaled antibiotic treatment by phenotypes.
| Baseline characteristics | Global N=402 | Phenotype 1 n=138 | Phenotype 2 n=148 | Phenotype 3 n=116 | p value |
|---|---|---|---|---|---|
| Demographic | |||||
| Age (years) | 71.6 (13.3) | 70.5 (13.4) | 71.8 (14.3) | 72.7 (11.6) | 0.386 |
| Sex (Female) | 180 (44.8%) | 78 (56.5%) | 68 (45.9%) | 34 (29.3%) | |
| Underlying lung disease | |||||
| COPD | 159 (39.6%) | 22 (15.9%) | 57 (38.5%) | 80 (69.0%) | <0.001 |
| GOLD 0 | 12 (7.59%) | 3 (13.6%) | 6 (10.5%) | 3 (3.80%) | |
| GOLD 1 | 16 (10.1%) | 13 (59.1%) | 3 (5.26%) | 0 (0.00%) | |
| GOLD 2 | 39 (24.7%) | 1 (4.55%) | 35 (61.4%) | 3 (3.80%) | |
| GOLD 3 | 35 (22.2%) | 0 (0.00%) | 6 (10.5%) | 29 (36.7%) | |
| GOLD 4 | 56 (35.4%) | 5 (22.7%) | 7 (12.3%) | 44 (55.7%) | |
| Bronchiectasis | 311 (77.4%) | 113 (81.9%) | 118 (79.7%) | 80 (69.0%) | 0.034 |
| Cylindrical | 243 (60.4%) | 86 (62.3%) | 94 (63.5%) | 63 (54.3%) | 0.271 |
| Cystic | 53 (13.2%) | 7 (5.07%) | 30 (20.3%) | 16 (13.8%) | 0.001 |
| Varicose | 73 (18.2%) | 23 (16.7%) | 30 (20.3%) | 20 (17.2%) | 0.699 |
| Asthma | 29 (7.21%) | 17 (12.3%) | 10 (6.76%) | 2 (1.72%) | 0.005 |
| Comorbidities | |||||
| Total number | 0.78 (0.90) | 0.59 (0.79) | 0.70 (0.80) | 1.11 (1.06) | <0.001 |
| Cancer | 74 (18.4%) | 24 (17.4%) | 21 (14.2%) | 29 (25.0%) | 0.074 |
| Heart failure | 61 (15.2%) | 13 (9.42%) | 21 (14.2%) | 27 (23.3%) | 0.008 |
| Kidney failure | 42 (10.4%) | 12 (8.70%) | 13 (8.78%) | 17 (14.7%) | 0.214 |
| Diabetes mellitus | 49 (12.2%) | 8 (5.80%) | 19 (12.8%) | 22 (19.0%) | 0.006 |
| Pulmonary function | |||||
| FEV1(%) | 65.8 (25.1) | 93.9 (13.8) | 62.6 (8.69) | 35.9 (8.26) | <0.00 |
| FVC (%) | 79.3 (21.6) | 100 (14.1) | 76.8 (11.9) | 56.9 (13.3) | <0.001 |
| FEV1to FVC ratio | 63.0 (14.3) | 73.3 (8.73) | 63.1 (11.2) | 50.0 (13.2) | <0.001 |
| DLCO (%) | 72.9 (21.9) | 85.6 (15.2) | 66.4 (22.2) | 58.2 (19.9) | <0.001 |
| Previous pharmacological treatment | |||||
| Inhaled treatment | NE | ||||
| No | 75 (18.7%) | 40 (29.0%) | 24 (16.2%) | 11 (9.48%) | |
| Long-acting β2-agonist | 64 (15.9%) | 39 (28.3%) | 17 (11.5%) | 8 (6.90%) | |
| Long-acting muscarinic antag. | 15 (3.73%) | 8 (5.80%) | 4 (2.70%) | 3 (2.59%) | |
| Both | 248 (61.7%) | 51 (37.0%) | 103 (69.6%) | 94 (81.0%) | |
| Inhaled corticosteroids | 265 (65.9%) | 73 (52.9%) | 101 (68.2%) | 91 (78.4%) | <0.001 |
| Hypertonic saline | 63 (15.8%) | 18 (13.1%) | 25 (17.1%) | 20 (17.2%) | 0.576 |
| Azithromycin (alternate days) | 75 (19.2%) | 20 (14.8%) | 23 (16.0%) | 32 (28.6%) | 0.011 |
| Nebulized antibiotic treatment | |||||
| Type | 0.972 | ||||
| Colistin | 293 (72.9%) | 97 (70.3%) | 105 (70.9%) | 91 (78.4%) | |
| Tobramycine | 59 (14.7%) | 19 (13.8%) | 26 (17.6%) | 14 (12.1%) | |
| Gentamycine | 21 (5.22%) | 9 (6.52%) | 9 (6.08%) | 3 (2.59%) | |
| Amikacin | 21 (5.22%) | 9 (6.52%) | 6 (4.05%) | 6 (5.17%) | |
| Other | 8 (1.99%) | 4 (2.90%) | 2 (1.35%) | 2 (1.72%) | |
| Device | 0.241 | ||||
| INeb | 45 (11.3%) | 12 (8.89%) | 19 (12.8%) | 14 (12.3%) | |
| Jet | 140 (35.3%) | 58 (43.0%) | 49 (33.1%) | 33 (28.9%) | |
| Vibrating mesh | 204 (51.4%) | 64 (47.4%) | 77 (52.0%) | 63 (55.3%) | |
| Dry powder | 8 (2.02%) | 1 (0.74%) | 3 (2.03%) | 4 (3.51%) | |
| Exacerbation rates | Global n=352 | Phenotype 1 n=133 | Phenotype 2 n=142 | Phenotype 3 n=115 | p value |
|---|---|---|---|---|---|
| Mild-to-moderate exacerbations | |||||
| One-year before inhaled antibiotics | 78.9% [74.5%;82.9%] | 78.9% [71.0%;85.5%] | 78.7% [71.0%;85.2%] | 79.1% [70.6%;86.1%] | 0.997 |
| Number | 1.94 [1.77;2.10] | 2.09 [1.79;2.39] | 1.82 [1.55;2.08] | 1.90 [1.60;2.21] | 0.382 |
| One-year after inhaled antibiotics | 36.9% [31.8%;42.2%] | 35.0% [26.5%;44.4%] | 32.6% [24.8%;41.2%] | 45.3% [35.0%;55.8%] | 0.129 |
| Number | 0.61 [0.50;0.71] | 0.49 [0.34;0.63] | 0.56 [0.39;0.73] | 0.82 [0.57;1.07] | 0.044 |
| Change | −1.49 [−1.67;−1.31] | −1.63 [−1.93;−1.33] | −1.45 [−1.74;−1.17] | −1.37 [−1.76;−0.98] | 0.521 |
| Severe exacerbations (hospitalization) | |||||
| One-year before inhaled antibiotics | 38.9% [34.0%;43.9%] | 34.1% [26.1%;42.8%] | 29.6% [22.2%;37.8%] | 56.2% [46.6%;65.6%] | <0.001 |
| Number | 0.61 [0.51;0.72] | 0.41 [0.30;0.52] | 0.46 [0.32;0.60] | 1.05 [0.79;1.32] | <0.001 |
| One-year after inhaled antibiotics | 12.1% [8.86%;16.0%] | 4.27% [1.40%;9.69%] | 5.88% [2.57%;11.3%] | 30.9% [21.7%;41.2%] | <0.001 |
| Number | 0.18 [0.13;0.24] | 0.06 [0.00;0.12] | 0.07 [0.02;0.11] | 0.51 [0.33;0.69] | <0.001 |
| Change | −0.38 [−0.49;−0.28] | −0.35 [−0.46;−0.24] | −0.35 [−0.48;−0.21] | −0.48 [−0.78;−0.18] | 0.551 |
| Total exacerbations | |||||
| One-year before inhaled antibiotics | 88.8% [85.2%;91.8%] | 87.0% [80.0%;92.3%] | 86.5% [79.8%;91.7%] | 93.8% [87.5%;97.5%] | 0.142 |
| Number | 2.53 [2.34;2.72] | 2.47 [2.15;2.80] | 2.26 [1.97;2.55] | 2.94 [2.54;3.33] | 0.018 |
| One-year after inhaled antibiotics | 43.4% [38.1%;48.8%] | 35.9% [27.2%;45.3%] | 35.6% [27.5%;44.2%] | 63.8% [53.3%;73.5%] | <0.001 |
| Number | 0.78 [0.65;0.91] | 0.55 [0.38;0.71] | 0.61 [0.44;0.79] | 1.31 [0.99;1.62] | <0.001 |
| Change | −1.71 [−1.91;−1.51] | −1.83 [−2.14;−1.51] | −1.66 [−1.96;−1.36] | −1.64 [−2.11;−1.17] | 0.720 |
| Longitudinal changes in pulmonary function parameters | Global n=352 | Phenotype 1 n=120 | Phenotype 2 n=136 | Phenotype 3 n=98 | p value |
|---|---|---|---|---|---|
| FEV1 | |||||
| Baseline | 65.8 [63.1;68.4] | 93.9 [91.4;96.4] | 62.6 [61.2;64.1] | 35.9 [34.3;37.6] | <0.001 |
| One-year | 64.2 [61.0;67.4] | 86.9 [82.8;91.0] | 63.1 [59.9;66.4] | 38.7 [35.8;41.7] | <0.001 |
| Change | −1.28 [−3.21;0.66] | −5.96 [−9.90;−2.03] | 1.18 [−1.96;4.33] | 1.07 [−1.43;3.56] | 0.003 |
| FVC | |||||
| Baseline | 79.3 [77.0;81.5] | 100 [97.9;103] | 76.8 [74.8;78.8] | 56.9 [54.2;59.6] | <0.001 |
| One-year | 76.9 [74.0;79.7] | 93.6 [89.8;97.4] | 77.1 [73.8;80.3] | 57.0 [52.8;61.1] | <0.001 |
| Change | −1.16 [−3.15;0.83] | −5.54 [−9.11;−1.97] | 1.93 [−1.20;5.05] | 0.02 [−3.55;3.59] | 0.005 |
| FEV1/FVC | |||||
| Baseline | 63.0 [61.5;64.5] | 73.3 [71.7;74.9] | 63.1 [61.2;65.0] | 50.0 [47.3;52.6] | <0.001 |
| One-year | 63.0 [61.2;64.9] | 72.1 [69.8;74.5] | 63.6 [60.9;66.2] | 51.8 [48.6;55.1] | <0.001 |
| Change | −0.52 [−1.96;0.92] | −0.29 [−3.50;2.91] | −0.43 [−2.08;1.21] | −0.91 [−3.60;1.79] | 0.943 |
| Other outcomes | Global n=402 | Phenotype 1 n=138 | Phenotype 2 n=148 | Phenotype 3 n=116 | p value |
|---|---|---|---|---|---|
| Clinical improvement measures | |||||
| Sputum amount | 252 (83.2%) | 94 (84.7%) | 97 (87.4%) | 61 (75.3%) | 0.075 |
| Sputum purulence | 242 (81.2%) | 93 (86.1%) | 93 (84.5%) | 56 (70.0%) | 0.011 |
| Dyspnea | 185 (61.7%) | 78 (70.3%) | 77 (70.0%) | 30 (38.0%) | <0.001 |
| Adverse effects | |||||
| None | 289 (74.3%) | 105 (81.4%) | 116 (78.9%) | 68 (60.2%) | <0.001 |
| Cough | 47 (12.1%) | 11 (8.53%) | 14 (9.52%) | 22 (19.5%) | 0.016 |
| Aphonia | 6 (1.54%) | 2 (1.55%) | 2 (1.36%) | 2 (1.77%) | 1.000 |
| Acute respiratory failure | 1 (0.26%) | 0 (0.00%) | 0 (0.00%) | 1 (0.88%) | 0.290 |
| Acute renal failure | 1 (0.26%) | 1 (0.78%) | 0 (0.00%) | 0 (0.00%) | 0.622 |
| Digestive | 3 (0.77%) | 1 (0.78%) | 0 (0.00%) | 2 (1.77%) | 0.197 |
| Cutaneous | 5 (1.29%) | 1 (0.78%) | 4 (2.72%) | 0 (0.00%) | 0.197 |
| IA treatment suspension | |||||
| Intolerance | 84 (21.2%) | 19 (14.1%) | 27 (18.5%) | 38 (33.0%) | 0.001 |
| Eradication | 44 (11.1%) | 18 (13.3%) | 15 (10.3%) | 11 (9.57%) | 0.590 |
| Stability | 65 (16.2%) | 24 (17.4%) | 24 (16.2%) | 17 (14.7%) | 0.840 |
| Dose reduction | 16 (4.23%) | 6 (4.62%) | 5 (3.60%) | 5 (4.59%) | 0.901 |
Data are presented n (%) or mean [95%CI]. Phenotype 1: normal lung function; Phenotype 2: moderately impaired lung function; Phenotype 3: severely impaired lung function. FEV1: forced expiratory volume in 1s; FVC: forced vital capacity; DLCO: diffusing capacity of the lungs for carbon monoxide.
Three reproducible phenotypes were identified using k-prototypes clustering with multiple imputation (Table 1 and Fig. 1Panel A). Phenotype 1 (n=138, 34.3%) was mainly composed of women (56.5%) with preserved lung function (mean FEV1 93.9±13.8% predicted), predominantly bronchiectasis (81.9%) and the highest asthma prevalence (12.3%). Phenotype 2 (n=148, 36.8%) showed moderate airflow obstruction (FEV1 62.6±25.1%), with frequent bronchiectasis (79.7%) and COPD (38.5%). Phenotype 3 (n=116, 28.8%) had severe obstruction (FEV1 35.9±8.3%), a higher prevalence of COPD, more comorbidities, older age, and greater use of dual or triple inhaled therapy. There were no significant differences between phenotypes in terms of IA type or delivery device.
 Radar plot showing the prevalence or standardized mean (0–1) of clustered characteristics for clinical phenotype identification. Clustering was performed using k-prototypes with multiple imputation on sociodemographic information (blue), underlying respiratory diseases (purple), comorbidities (yellow), pulmonary function (green) and pharmacological treatments (red). Abbreviations: COPD, chronic obstructive pulmonary disease; FVC, forced vital capacity; FEV1, forced expiratory volume in 1second; ICS, inhaled corticosteroids; LABA, long-acting beta2 agonist; LAMA, long-acting muscarinic antagonist. (C) Forest plot with Odds Ratios and confidence interval for predictors of exacerbation model. (D) Nomogram to predict risk of exacerbation after one-year IA.")
Panel A: Distribution of clustered characteristics by phenotype; Panel B: Exacerbation one-year pre-post IA according to phenotypes; Panels C and D: Multivariate model for risk of exacerbation one-year after IA. (A) Radar plot showing the prevalence or standardized mean (0–1) of clustered characteristics for clinical phenotype identification. Clustering was performed using k-prototypes with multiple imputation on sociodemographic information (blue), underlying respiratory diseases (purple), comorbidities (yellow), pulmonary function (green) and pharmacological treatments (red). Abbreviations: COPD, chronic obstructive pulmonary disease; FVC, forced vital capacity; FEV1, forced expiratory volume in 1second; ICS, inhaled corticosteroids; LABA, long-acting beta2 agonist; LAMA, long-acting muscarinic antagonist. (C) Forest plot with Odds Ratios and confidence interval for predictors of exacerbation model. (D) Nomogram to predict risk of exacerbation after one-year IA.
After one year of IA therapy, all phenotypes showed symptomatic improvement and a reduction in exacerbations (Table 1). However, phenotype 3 remained at highest risk, with a mean exacerbation rate of 1.31 per year and 63.8% of patients experiencing ≥1 event (Table 1 and Fig. 1 Panel B). This group also had the poorest symptomatic response and highest treatment intolerance, leading to a 33.0% discontinuation rate due to adverse effects (Table 1). In contrast, phenotypes 1 and 2 had lower exacerbation rates and fewer recurrent events. Notably, phenotype 1 was the only group with a significant decline in lung function (FEV1 −5.96%, FVC −5.54%) (Table 1). Bacterial eradication rates did not differ significantly between phenotypes. A multivariable predictive model (Fig. 1 Panel C) identified prior exacerbations (OR 1.37; 95% CI: 1.19–1.59), varicose/cystic bronchiectasis on chest CT (OR 1.84; 95% CI: 1.08–3.16), number of comorbidities (OR 1.48; 95% CI: 1.11–2.01), age (OR 1.01; 95% CI: 0.99–1.03), and phenotype classification (OR 0.93; 95% CI: 0.53–1.64 for phenotype 2; OR 2.36; 95% CI: 1.27–4.42 for phenotype 3) as independent predictors of exacerbation risk, with moderate discriminative performance (AUC 0.74). A web-based application (https://trrm.shinyapps.io/IAscore) and a nomogram (Fig. 1 Panel D) were developed to estimate individual risk.
This multicenter, retrospective study identified three clinically relevant phenotypes among patients with chronic bronchial infection (CBI) receiving inhaled antibiotic (IA) therapy, based primarily on lung function status. Phenotype 1 included patients with preserved lung function, mainly women with bronchiectasis; phenotype 2 had moderate obstruction, often with overlapping COPD and bronchiectasis; and phenotype 3 comprised older patients with severe airflow limitation, predominantly older patients with COPD and multiple comorbidities.
While all phenotypes benefited from IA therapy—showing reductions in exacerbations and symptomatic improvement—patients in phenotype 3 experienced poorer outcomes. This group had the highest exacerbation rate after one year, the lowest symptom response, and a greater incidence of adverse effects, leading to treatment discontinuation in one-third of cases. In contrast, phenotypes 1 and 2 showed more favorable responses, with slightly greater reductions in exacerbation frequency compared to prior studies, likely due to the exclusive inclusion of patients with confirmed CBI in this cohort.
The study's key innovation is the development of a multivariable model to predict exacerbation risk one year after IA initiation. The model includes age, comorbidities, prior exacerbations, bronchiectasis type on chest CT (varicose/cystic), and phenotype classification. It showed moderate discriminative capacity (AUC 0.74) and is accessible via a web-based tool and nomogram, facilitating its use in clinical practice. Unlike previous scoring systems (e.g., FACED,14 E-FACED15), this model incorporates bronchiectasis type, which has rarely been linked to outcomes but may be a marker of more advanced disease. The inclusion of CT morphology may thus represent a step toward precision medicine in CBI.
The poor response observed in phenotype 3 highlights a clinically relevant subgroup. These patients likely derive limited benefit from IA due to non-modifiable risk factors such as advanced COPD,16 comorbidities, and age. Importantly, viral infections17—common drivers of exacerbations in severe COPD—are unaffected by IA, which may explain the limited efficacy in this group. While adverse effects were more frequent in phenotype 3, the rate was comparable to previous studies of IA in COPD, though those cohorts included fewer CBI patients and had higher baseline lung function.18,19
Despite its retrospective design and reliance on electronic medical records, the study includes data from 10 Spanish hospitals, reflecting real-world practice and enhancing generalizability. Limitations include the absence of a control group, incomplete availability of inflammatory markers, and some variability across centers. A prospective multicenter study (REPAIR20) is underway to validate these findings and further assess the utility of the proposed model.
In conclusion, phenotypic analysis in this large cohort of CBI patients treated with IA revealed distinct clinical profiles associated with differential response to therapy. The predictive model developed in this study, incorporating both clinical variables and radiological features, may guide individualized treatment decisions and inform future trial design. While further prospective validation is needed, these findings offer a practical framework for optimizing IA use in patients with CBI.
Authors’ ContributionsConceptualization (BR, IDB, JG, AS), data curation (IDB, AS, AM, IJ-G), formal analysis (IDB, AS, AM), investigation (all), methodology (BR, IDB, JG, AS, DR, GS), project administration (JG, AS, DR, GS), supervision (JG, AS, AM), writing – original draft (BR, JG, IDB, AS), and writing – review & editing (all). All authors provided final approval of the version submitted for publication.
Artificial Intelligence InvolvementThe authors declare that no material has been partially or totally produced with the help of artificial intelligence.
Sources of SupportThis study has been founded by Instituto de Salud Carlos III (ISCIII) through the project PI23/01381 and co-funded by the European Union. AS was supported by Departament de Salut (Pla Estratègic de Recerca i Innovació en Salut (PERIS): SLT028/23/000191), SS was supported by Departament de Salut (Pla Estratègic de Recerca i Innovació en Salut (PERIS): SLT035/24/000025) and IJ-G was supported by the Instituto de Salud Carlos III (ISCIII) through the predoctoral fellowship FI24/00084 and co-funded by the European Union.
Conflicts of InterestThe authors declare not to have any conflicts of interest that may be considered to influence directly or indirectly the content of the manuscript.


