Mucus plugs identified through chest computed tomography (CT) scans have emerged as potential prognostic factors in chronic obstructive pulmonary disease (COPD). This 5-year longitudinal study investigated their impact on exacerbations and FEV1 decline.
MethodsCOPD patients with baseline chest CT and spirometric assessments were categorized based on mucus plug presence. Propensity-score matching yielded balanced groups. Exacerbation rates, time to exacerbation events, hazard ratio (HR) for exacerbations, and annual rates of FEV1 decline were evaluated. Sensitivity analysis was performed with stratification according to mucus plug scores of 0, 1–2, and ≥3.
ResultsAmong 623 eligible patients, the mucus plug group was 44.3%. Through 1:1 propensity-score matching, each group was comprised of 187 individuals with balanced covariates. The mucus plug group showed higher rates of moderate-to-severe (0.51/year vs. 0.58/year, P=0.035), severe exacerbations (0.21/year vs. 0.24/year, P=0.032), and non-eosinophilic exacerbations (0.45/year vs. 0.52/year, P=0.008). Mucus plugs were associated with increased hazard of moderate-to-severe (adjusted HR=1.502 [95% CI 1.116–2.020]), severe (adjusted HR=2.106 [95% CI, 1.429–3.103]), and non-eosinophilic exacerbations (adjusted HR=1.551 [95% CI, 1.132–2.125]). Annual FEV1 decline was accelerated in the mucus plug group (β-coefficient=−62 [95% CI, −120 to −5], P=0.035). Sensitivity analysis showed higher risk of exacerbations and accelerated FEV1 decline in mucus plug score ≥3 compared to score 0.
ConclusionsMucus plugs are associated with increased risks of exacerbations, particularly non-eosinophilic, and accelerated FEV1 declines over 5 years. Our study identified the potential prognostic value of mucus plugs on future exacerbation risks and lung function decline trajectories.
Chronic obstructive pulmonary disease (COPD) is a complex respiratory condition characterized by often progressive airflow limitation, resulting in debilitating symptoms and increased morbidity and mortality.1 The clinical heterogeneity of COPD underscores the need for a comprehensive understanding of various risk factors influencing clinically important outcomes such as acute exacerbation and lung function decline. Acute exacerbation of COPD (AE-COPD) often leads to aggravated dyspnea, worsened lung function, decreased quality of life, and increased hospitalization and mortality, contributing significantly to the burden on both patients and healthcare systems.2–4 Lung function decline is indicative of COPD progression or ongoing structural changes in the airways, playing a crucial role in determining long-term outcomes and prognosis.5,6
Mucus plugs, radiologically visualized as luminal obstruction, are indicative of altered mucus dynamics within the airways.7 The rationale for investigating the association between mucus plugs and clinical outcomes is grounded in the intricate interplay between airway obstruction, inflammation, and clinical manifestations of COPD. Mucus plugs may serve as a surrogate marker for increased sputum production and airway inflammation, both known contributors to exacerbation events.8 Previous studies have explored the link between radiological evidence of mucus plugs and respiratory symptoms,9 suggesting a potential role in exacerbation events.10,11 Furthermore, the histological identification of small airway obstruction attributed to inflammatory mucus secretion demonstrated a significant association with mortality among patients diagnosed with severe emphysema and subjected to lung volume reduction surgery.12 As the number of segmental bronchi involved with mucus plugs increases, the mortality rate in patients with COPD has shown a corresponding rise.13 However, a comprehensive longitudinal assessment integrating AE-COPD and lung function decline and their association with mucus plugs is lacking.
The present study aimed to investigate the influence of mucus plugs in chest computed tomography (CT) on clinical outcomes, including AE-COPD and forced expiratory volume in one second (FEV1) decline, in COPD patients over a 5-year period.
MethodsOur study is in accordance with the guidance outlined in the Strengthening the Reporting of Observational Studies in Epidemiology (STROBE) statement.14
Study Design and ParticipantsThe present retrospective observational study evaluated the patients who were regularly followed up for COPD management at a teaching hospital from January 2004 and December 2019. Diagnosis of COPD was made by pulmonologists based on chronic respiratory symptoms, risk factors, and non-fully reversible airflow limitation (post-bronchodilator forced expiratory volume in one second (FEV1)/forced vital capacity (FVC) ratio <0.7). The inclusion criteria comprised patients with: (1) baseline chest computed tomography (CT), (2) baseline and follow-up spirometric assessments, and (3) hospital visits over a 5-year observation period. We excluded the patients who currently had asthma or interstitial lung disease at baseline assessment. The eligible patients were categorized into two groups according to the presence of mucus plug: (1) the no mucus plug group and (2) the mucus plug group. For sensitivity analyses, eligible patients were further categorized based on mucus plug scores of 0, 1–2, and ≥3.
Variables and MeasurementsDemographic and clinical characteristics were collected as baseline variables for analysis. These included age, sex, body mass index (BMI), smoking history (current smoking status and pack-years for ever-smokers), underlying medical conditions, respiratory comorbidities, severity of symptom (Modified Medical Research Council [mMRC] grade and COPD assessment test [CAT] score), GOLD group classification (A, B, E), complete blood count, pulmonary function profiles (post-bronchodilator FEV1, FVC, FEV1/FVC ratio, and FEF25–75%), as well as details regarding inhaled therapies.
Blood eosinophil count (BEC) was routinely measured as part of the complete blood count with differential at the point of exacerbation, both in outpatient and inpatient settings. Baseline BEC was obtained from routine blood tests conducted at the time of COPD diagnosis, performed at least two weeks after stabilization and in the absence of recent treatment with oral corticosteroids.
CT ProtocolThe CT scan protocol was consistent across different periods, maintaining uniformity in the imaging technique. Chest CT scans were performed using a 16-channel multi-detector CT (MDCT) (LightSpeed, GE Healthcare), a 64-channel MDCT (Brilliance, Philips Medical Systems, Cleveland, Ohio), or a 128-channel CT scanner (Ingenuity, Philips Medical Systems, the Netherlands). Radiologic data was acquired in the cranio-caudal direction with a peak voltage of 120kV. The effective milliampere-second ranged between 150 and 200, utilizing an automatic tube current modulation technique.
Mucus Plug ScoreThe mucus plug score was determined by tallying the count of lung segments exhibiting mucus plugs that entirely obstruct middle-to-large-sized airways (approximately 2–10-mm lumen diameter). The presence of mucus plugs was documented in each lobe, with the lingula treated as an independent lobe. Scores range from 0 (indicating no mucus plugs observed in any lung segments) to 18 (suggesting all lung segments are affected). The bronchial classification comprises 18 lung segments, with the right lung having 3, 2, and 5 segments in the upper, middle, and lower lobes, respectively, and the left lung having 2, 2, and 4 segments in the upper lobe, lingula, and lower lobe, respectively. The presence of mucus plugs was specifically defined as a mucus plug score equal to or greater than 1.
Upon scrutinizing baseline chest CT scans, the mucus plug was first identified in each bronchopulmonary segment by thoracic radiologists. A random selection of 100 scans with mucus plugs and 100 scans without mucus plugs were independently assessed by a thoracic radiologist (KNJ) and a pulmonologist (HWL) using the previously described methodology.13 The two readers evaluated the mucus plug scores, and calibration was conducted through discussion until the inter-reader agreement's correlation coefficient reached 0.9 or higher. Subsequently, the mucus plug score was evaluated for the entire chest CT scan. Any disagreements related to the assessment of the mucus plug score were resolved through discussion between the two investigators.
OutcomesThe primary outcomes of interest encompassed exacerbation rates and time to exacerbation events, categorized into moderate-to-severe, severe, eosinophilic, and non-eosinophilic exacerbations. A moderate exacerbation was defined as a flare-up of COPD symptoms requiring antibiotics or systemic corticosteroids. A severe exacerbation was characterized by hospitalization or emergency room visits due to a flare-up of COPD symptoms. Eosinophilic exacerbations were defined by a blood eosinophil count ≥300/μL at the onset of exacerbation, while non-eosinophilic exacerbations were identified by a blood eosinophil count <300/μL. Subgroup analyses were conducted to evaluate hazard ratios for different exacerbation types based on various clinical phenotypes or inhaled therapies. As a secondary outcome, the decline in FEV1 over a 5-year period was assessed.
Follow-up SpirometryWe collected annual FEV1 values during the 5-year follow-up period. To address any missing values in the annual FEV1 dataset, we employed linear interpolation or extrapolation for imputation. The beta-coefficient, indicative of the linear regression slope, was estimated for each individual by utilizing all available follow-up FEV1 values from the baseline examination to the last follow-up.
Statistical AnalysisIn the baseline characteristics, continuous variables were compared using the t-test or Wilcoxon signed-rank test, while categorical variables were compared using the chi-squared test or Fisher's exact test. Propensity-score matching (PSM) was employed to reduce potential confounding and achieve balance between the groups with and without mucus plugs. PSM was performed using the MatchIt package in R. The propensity-score was calculated using logistic regression, with the presence of CT-detected mucus plugs as the dependent variable. The covariables included in the model were age, sex, BMI, smoking history (current smoking status and pack-years for ever-smokers), follow-up duration, comorbidities (heart failure, chronic liver disease, diabetes mellitus, chronic kidney disease, Charlson comorbidity index), respiratory conditions (asthma, pulmonary tuberculosis, non-tuberculous mycobacterial pulmonary disease, bronchiectasis, TB-destroyed lung, and interstitial lung disease), COPD related symptoms (cough, sputum production, dyspnea, CAT scores, and mMRC scale), exacerbation history, GOLD classification, blood test results, pulmonary function test results, and inhaled therapy. Matching was performed using the nearest neighbor method with a caliper of 0.1 and a 1:1 ratio to minimize differences between the mucus plug and no mucus plug groups. This process resulted in 187 patients in each group, based on the availability of suitable matches. The balance of covariables between the matched groups was assessed using standardized mean differences (SMD), with an SMD of less than 0.1 indicating a negligible difference.
Exacerbation rates were compared using chi-squared tests, and time to exacerbation events was analyzed using Kaplan–Meier curves. Hazard ratios for exacerbations were calculated using Cox proportional hazards models. For the multivariable Cox regression analysis, stepwise selection using AIC was employed to identify the optimal set of variables. This method was implemented using the stepAIC function from the MASS package in R, which performs both forward and backward selection to balance model fit and complexity. Subgroup analyses were conducted to explore the impact of mucus plugs on exacerbations in specific patient subgroups. The annual decline in FEV1 was analyzed using repeated measures two-way ANOVA and linear mixed-effect models. All statistical analyses were performed using a predefined significance level (P-value<0.05), and results were reported with 95% confidence intervals.
ResultsA total of 960 patients visited outpatient clinics with respiratory symptoms, received a COPD diagnosis, and underwent baseline chest CT. After excluding 337 patients lacking 5 years of follow-up or spirometric examinations, 623 eligible patients remained (Fig. 1). Among them, 276 (44.3%) had identifiable mucus plugs in baseline CT scans. The distribution of mucus plug scores is summarized in Supplementary Information 1. The inter-reader agreement, as indicated by Cohen's Kappa coefficient, was 0.87 (95% CI, 0.83–0.91) for the presence of the mucus plugs, and the correlation coefficient for the mucus plug scores was 0.82.
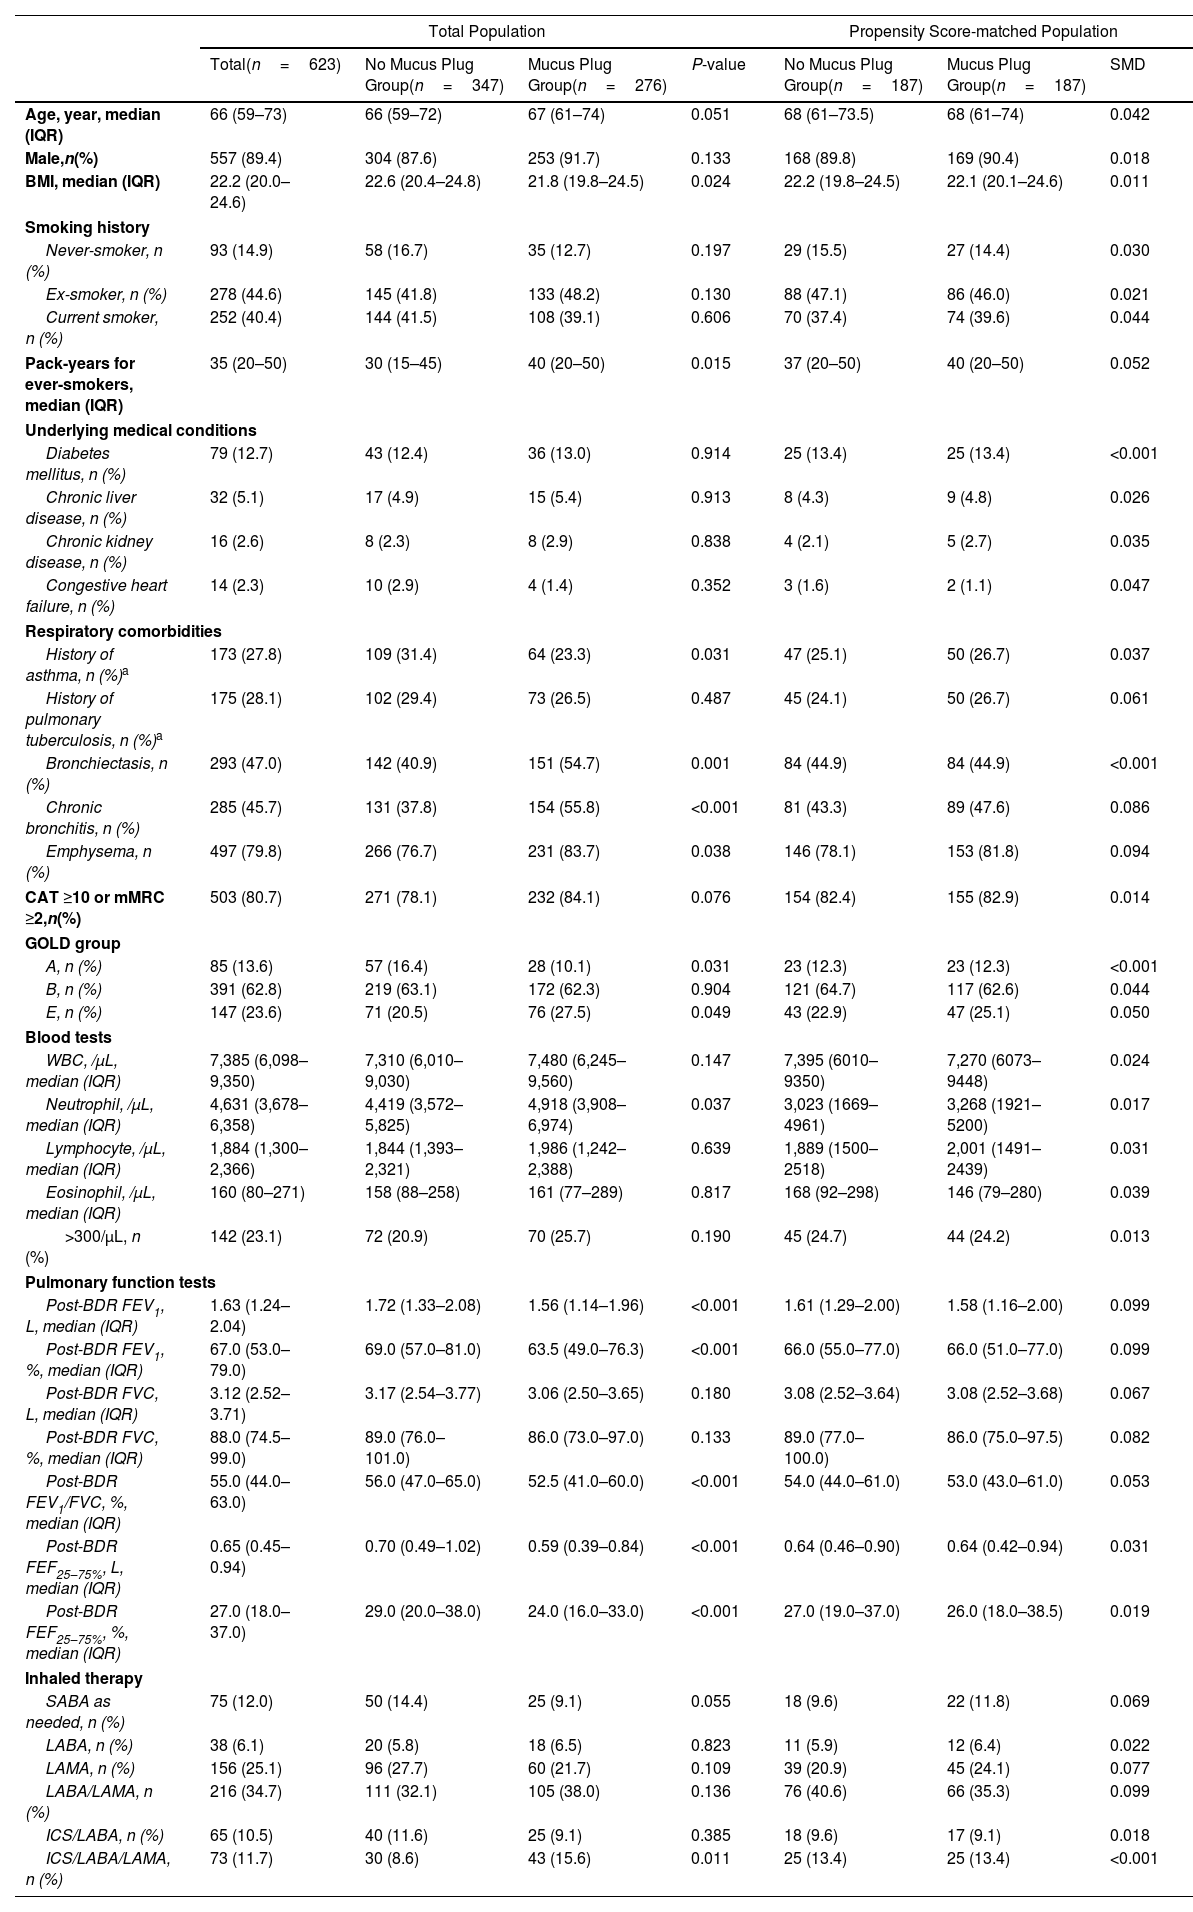
The demographic characteristics and clinical features of the total study population are delineated in Table 1. Significant differences were observed between the no mucus plug group and the mucus plug group across multiple parameters. Propensity-score matching balanced these disparities in the matched population (187 patients per group), with a median age of 68 years, predominantly male composition, and a median BMI of 22.
Demographic Characteristics and Clinical Features in Total and Propensity Score-matched Population.
Total Population | Propensity Score-matched Population | ||||||
---|---|---|---|---|---|---|---|
Total(n=623) | No Mucus Plug Group(n=347) | Mucus Plug Group(n=276) | P-value | No Mucus Plug Group(n=187) | Mucus Plug Group(n=187) | SMD | |
Age, year, median (IQR) | 66 (59–73) | 66 (59–72) | 67 (61–74) | 0.051 | 68 (61–73.5) | 68 (61–74) | 0.042 |
Male,n(%) | 557 (89.4) | 304 (87.6) | 253 (91.7) | 0.133 | 168 (89.8) | 169 (90.4) | 0.018 |
BMI, median (IQR) | 22.2 (20.0–24.6) | 22.6 (20.4–24.8) | 21.8 (19.8–24.5) | 0.024 | 22.2 (19.8–24.5) | 22.1 (20.1–24.6) | 0.011 |
Smoking history | |||||||
Never-smoker, n (%) | 93 (14.9) | 58 (16.7) | 35 (12.7) | 0.197 | 29 (15.5) | 27 (14.4) | 0.030 |
Ex-smoker, n (%) | 278 (44.6) | 145 (41.8) | 133 (48.2) | 0.130 | 88 (47.1) | 86 (46.0) | 0.021 |
Current smoker, n (%) | 252 (40.4) | 144 (41.5) | 108 (39.1) | 0.606 | 70 (37.4) | 74 (39.6) | 0.044 |
Pack-years for ever-smokers, median (IQR) | 35 (20–50) | 30 (15–45) | 40 (20–50) | 0.015 | 37 (20–50) | 40 (20–50) | 0.052 |
Underlying medical conditions | |||||||
Diabetes mellitus, n (%) | 79 (12.7) | 43 (12.4) | 36 (13.0) | 0.914 | 25 (13.4) | 25 (13.4) | <0.001 |
Chronic liver disease, n (%) | 32 (5.1) | 17 (4.9) | 15 (5.4) | 0.913 | 8 (4.3) | 9 (4.8) | 0.026 |
Chronic kidney disease, n (%) | 16 (2.6) | 8 (2.3) | 8 (2.9) | 0.838 | 4 (2.1) | 5 (2.7) | 0.035 |
Congestive heart failure, n (%) | 14 (2.3) | 10 (2.9) | 4 (1.4) | 0.352 | 3 (1.6) | 2 (1.1) | 0.047 |
Respiratory comorbidities | |||||||
History of asthma, n (%)a | 173 (27.8) | 109 (31.4) | 64 (23.3) | 0.031 | 47 (25.1) | 50 (26.7) | 0.037 |
History of pulmonary tuberculosis, n (%)a | 175 (28.1) | 102 (29.4) | 73 (26.5) | 0.487 | 45 (24.1) | 50 (26.7) | 0.061 |
Bronchiectasis, n (%) | 293 (47.0) | 142 (40.9) | 151 (54.7) | 0.001 | 84 (44.9) | 84 (44.9) | <0.001 |
Chronic bronchitis, n (%) | 285 (45.7) | 131 (37.8) | 154 (55.8) | <0.001 | 81 (43.3) | 89 (47.6) | 0.086 |
Emphysema, n (%) | 497 (79.8) | 266 (76.7) | 231 (83.7) | 0.038 | 146 (78.1) | 153 (81.8) | 0.094 |
CAT ≥10 or mMRC ≥2,n(%) | 503 (80.7) | 271 (78.1) | 232 (84.1) | 0.076 | 154 (82.4) | 155 (82.9) | 0.014 |
GOLD group | |||||||
A, n (%) | 85 (13.6) | 57 (16.4) | 28 (10.1) | 0.031 | 23 (12.3) | 23 (12.3) | <0.001 |
B, n (%) | 391 (62.8) | 219 (63.1) | 172 (62.3) | 0.904 | 121 (64.7) | 117 (62.6) | 0.044 |
E, n (%) | 147 (23.6) | 71 (20.5) | 76 (27.5) | 0.049 | 43 (22.9) | 47 (25.1) | 0.050 |
Blood tests | |||||||
WBC, /μL, median (IQR) | 7,385 (6,098–9,350) | 7,310 (6,010–9,030) | 7,480 (6,245–9,560) | 0.147 | 7,395 (6010–9350) | 7,270 (6073–9448) | 0.024 |
Neutrophil, /μL, median (IQR) | 4,631 (3,678–6,358) | 4,419 (3,572–5,825) | 4,918 (3,908–6,974) | 0.037 | 3,023 (1669–4961) | 3,268 (1921–5200) | 0.017 |
Lymphocyte, /μL, median (IQR) | 1,884 (1,300–2,366) | 1,844 (1,393–2,321) | 1,986 (1,242–2,388) | 0.639 | 1,889 (1500–2518) | 2,001 (1491–2439) | 0.031 |
Eosinophil, /μL, median (IQR) | 160 (80–271) | 158 (88–258) | 161 (77–289) | 0.817 | 168 (92–298) | 146 (79–280) | 0.039 |
>300/μL, n (%) | 142 (23.1) | 72 (20.9) | 70 (25.7) | 0.190 | 45 (24.7) | 44 (24.2) | 0.013 |
Pulmonary function tests | |||||||
Post-BDR FEV1, L, median (IQR) | 1.63 (1.24–2.04) | 1.72 (1.33–2.08) | 1.56 (1.14–1.96) | <0.001 | 1.61 (1.29–2.00) | 1.58 (1.16–2.00) | 0.099 |
Post-BDR FEV1, %, median (IQR) | 67.0 (53.0–79.0) | 69.0 (57.0–81.0) | 63.5 (49.0–76.3) | <0.001 | 66.0 (55.0–77.0) | 66.0 (51.0–77.0) | 0.099 |
Post-BDR FVC, L, median (IQR) | 3.12 (2.52–3.71) | 3.17 (2.54–3.77) | 3.06 (2.50–3.65) | 0.180 | 3.08 (2.52–3.64) | 3.08 (2.52–3.68) | 0.067 |
Post-BDR FVC, %, median (IQR) | 88.0 (74.5–99.0) | 89.0 (76.0–101.0) | 86.0 (73.0–97.0) | 0.133 | 89.0 (77.0–100.0) | 86.0 (75.0–97.5) | 0.082 |
Post-BDR FEV1/FVC, %, median (IQR) | 55.0 (44.0–63.0) | 56.0 (47.0–65.0) | 52.5 (41.0–60.0) | <0.001 | 54.0 (44.0–61.0) | 53.0 (43.0–61.0) | 0.053 |
Post-BDR FEF25–75%, L, median (IQR) | 0.65 (0.45–0.94) | 0.70 (0.49–1.02) | 0.59 (0.39–0.84) | <0.001 | 0.64 (0.46–0.90) | 0.64 (0.42–0.94) | 0.031 |
Post-BDR FEF25–75%, %, median (IQR) | 27.0 (18.0–37.0) | 29.0 (20.0–38.0) | 24.0 (16.0–33.0) | <0.001 | 27.0 (19.0–37.0) | 26.0 (18.0–38.5) | 0.019 |
Inhaled therapy | |||||||
SABA as needed, n (%) | 75 (12.0) | 50 (14.4) | 25 (9.1) | 0.055 | 18 (9.6) | 22 (11.8) | 0.069 |
LABA, n (%) | 38 (6.1) | 20 (5.8) | 18 (6.5) | 0.823 | 11 (5.9) | 12 (6.4) | 0.022 |
LAMA, n (%) | 156 (25.1) | 96 (27.7) | 60 (21.7) | 0.109 | 39 (20.9) | 45 (24.1) | 0.077 |
LABA/LAMA, n (%) | 216 (34.7) | 111 (32.1) | 105 (38.0) | 0.136 | 76 (40.6) | 66 (35.3) | 0.099 |
ICS/LABA, n (%) | 65 (10.5) | 40 (11.6) | 25 (9.1) | 0.385 | 18 (9.6) | 17 (9.1) | 0.018 |
ICS/LABA/LAMA, n (%) | 73 (11.7) | 30 (8.6) | 43 (15.6) | 0.011 | 25 (13.4) | 25 (13.4) | <0.001 |
BDR, bronchodilator; BMI, body mass index; CAT, COPD assessment test; FEV1, forced expiratory volume in one second; FVC, forced vital capacity; GOLD, Global Initiative for Chronic Obstructive Lung Disease; ICS, inhaled corticosteroid; IQR, interquartile range; LABA, long-acting beta-agonist; LAMA, long-acting muscarinic antagonist; mMRC, Modified Medical Research Council; SABA, short-acting bronchodilator; SD, standard deviation; SMD, standard mean difference.
In the propensity score-matched population, the mucus plug group experienced more moderate-to-severe exacerbations (89 [47.6%] vs. 109 [58.3%], P-value=0.049) and severe exacerbations (47 [25.1%] vs. 77 [41.2%], P-value=0.002) than the no mucus plug group. The annual rate of moderate-to-severe exacerbations was significantly higher in the mucus plug group (0.51event/year vs. 0.58event/year, P-value=0.035; Fig. 2). Additionally, the mucus plug group exhibited a significantly higher rate of severe exacerbations (0.21event/year vs. 0.24event/year, P-value=0.032).
The mucus plug group experienced more non-eosinophilic exacerbations (73 [39.0%] vs. 97 [51.9%], P-value=0.017) compared to the no mucus plug group, while eosinophilic exacerbations were comparable. The annual rate of non-eosinophilic exacerbations was significantly higher in the mucus plug group (0.45event/year vs. 0.52event/year, P-value=0.008). However, the risk of eosinophilic exacerbations did not significantly differ between the two groups (P-value=0.440).
Time to Exacerbation EventIn the Kaplan–Meier curve, the mucus plug group demonstrated a shortened time to moderate-to-severe exacerbations (P-value=0.040) and severe exacerbations (P-value=0.001) compared to the no mucus plug group (Fig. 3). The mucus plug group also showed a shortened time to non-eosinophilic exacerbations (P-value=0.009), but there was no significant difference in the time to eosinophilic exacerbation events between the two groups. Conversely, eosinophilic exacerbations tended to occur less frequently in the mucus plug group, as observed in the total population (Supplementary Information 2). Especially, mucus plug score of ≥3 showed a significant increase in both moderate-to-severe exacerbation (P-value=0.040), severe exacerbation (P-value<0.001), and non-eosinophilic exacerbation (P-value=0.026) in comparison to those with mucus plug score of 0 (Fig. 4).
Mucus plug presence was associated with an increased hazard for moderate-to-severe exacerbations (HR=1.343 [95% CI, 1.015–1.777]), severe exacerbations (HR=1.769 [95% CI, 1.231–2.543]), and non-eosinophilic exacerbations (HR=1.494 [95% CI, 1.102–2.024]) (Supplementary Information 3–5). However, the hazard for eosinophilic exacerbations was decreased in the mucus plug group without statistical significance (HR=0.747 [95% CI, 0.354–1.580], Supplementary Information 6).
In subgroup analyses, an elevated risk of these exacerbations was observed in COPD patients with chronic bronchitis, emphysema, high blood neutrophil count (≥5000/μL), low blood lymphocyte count (<2000/μL), high blood neutrophil/lymphocyte ratio (NLR) (≥2.3), or low blood eosinophil count (<300/μL or <100/μL). Additionally, among patients using ICS/LABA/LAMA, the hazard of non-eosinophilic exacerbations was significantly increased in those with mucus plug. In COPD patients with a history of asthma or a low blood NLR, or those using ICS/LABA, there was a tendency for an increase in eosinophilic exacerbations in the presence of mucus plug, although statistical significance was not reached.
In multivariable Cox regression model, the presence of mucus plugs was related with an increased hazard for moderate-to-severe exacerbation (adjusted HR=1.502 [95% CI 1.116–2.020]), severe exacerbation (adjusted HR=2.106 [95% CI, 1.429–3.103]), and non-eosinophilic exacerbation (adjusted HR=1.551 [95% CI, 1.132–2.125]), while it is not significantly associated with eosinophilic exacerbation (Supplementary Information 7).
In the analysis according to mucus plug score, mucus plug score of ≥3 is significantly associated with an increased hazard of moderate-to-severe exacerbation, severe exacerbation, and non-eosinophilic exacerbation compared to mucus plug score of ≥0 (Supplementary Information 8).
FEV1 DeclineThe median change in FEV1 over 5 years was −50 (interquartile range [IQR], −468 to 265) mL in the no mucus plug group and −122 (IQR, −450 to 185) mL in the mucus plug group (Fig. 5). The annual FEV1 decline was significantly higher in the mucus plug group (repeated measures two-way ANOVA, P-value=0.014). In linear mixed-effect model, annual FEV1 decline rate (mL/year) was significantly accelerated in the mucus plug group (β-coefficient=−62 [95% CI, −120 to −5], P-value=0.035). In particular, a mucus plug score of ≥3 demonstrated a significant association with an accelerated decline in FEV1 compared to a mucus plug score of 0 (β-coefficient=−79 [95% CI, −148 to −10], P-value=0.026). However, there was no statistically significant difference observed for mucus plug scores of 1–2 (β-coefficient=−43 [95% CI, −116 to 29], P-value=0.241).
DiscussionOur findings underscore a significant association between the presence of mucus plugs and acute exacerbations, as well as a decline in lung function over a 5-year period in propensity-score matched COPD patients. Importantly, our results reveal a higher incidence of non-eosinophilic exacerbations in the mucus plug group. Conversely, eosinophilic exacerbations showed a trend towards lower occurrence in the presence of mucus plugs, although statistical significance was not reached. Non-eosinophilic exacerbations were notably elevated in subgroups manifesting clinical conditions associated with type 1 inflammation, such as chronic bronchitis and bronchiectasis, high blood neutrophil count or high blood NLR, and low blood eosinophil count. These findings suggest a potential link between mucus plugs and neutrophilic airway inflammation in COPD exacerbations. In addition, patients with identifiable mucus plugs exhibited a significantly higher annual decline in FEV1 compared to those without. This aligns with the concept that mucus plugs may serve as a radiological marker indicative of ongoing structural changes in the airways, contributing to a more rapid decline in lung function.
Patients diagnosed with COPD presented observable mucus plugs on CT scans, with a prevalence ranging from 25% in randomly sampled cases from the COPDgene cohort to 67% in the SPIROMICS cohort.15,16 In our study, the prevalence of mucus plugs in COPD patients was 44%, which aligns with the mid-range of prevalence reported in the previous studies, establishing concordance with recent observations.13,17 Among ever-smokers, a high mucus plug score exhibited associations with worsened symptoms, a higher frequency of moderate or severe exacerbation events over a one-year period, and a shortened distance in the 6-minute walk test.16 The mucus plugs identified on CT scans in COPD patients were correlated with lung function, quality of life, and the extent of emphysema.15 Among those with the presence of mucus plugs, 73% persisted in exhibiting the mucus plugs even after a 5-year follow-up.15 Thus, examining the presence of mucus plugs through chest CT at the time of COPD diagnosis is clinically meaningful, as it highlights a potentially treatable aspect associated with the natural course of the disease.18
In AE-COPD, non-eosinophilic exacerbations with low blood eosinophil counts dominate, with a prevalence ranging from 63% to 90%.19–21 No significant differences in blood eosinophil counts were observed based on AE-COPD severity.22 However, despite this, several studies consistently reported worse clinical outcomes for non-eosinophilic exacerbations compared to eosinophilic exacerbations.23,24 This finding indicates the importance of the role of blood eosinophil count as a biomarker for the response to systemic corticosteroids in AE-COPD.25–27 In addition, the increased susceptibility to dysregulated inflammation and bacterial infection has been proposed as another plausible biological link between the non-eosinophilic inflammation and poor outcomes in COPD.28,29 Our finding is consistent with previous reports that, unlike those in asthma patients, mucus plugs in COPD patients are primarily associated with worsening type 1 inflammation or neutrophilic airway inflammation, as well as bacterial infection.17,28,30 Small airway occlusion due to mucus plugs may compromise microorganism clearance, further increasing the risk of pulmonary infection and associated mortality.12,31 Therefore, in COPD patients with the presence of mucus plugs, interventions aimed at alleviating neutrophilic airway inflammation or reducing airway bacterial colonization may confer clinical benefits.18
Our study has several limitations. First, this study was conducted at a single teaching hospital, which may limit the generalizability of the findings. Our study lacks external validation from independent cohorts, highlighting the need for validation in diverse populations and healthcare settings. Second, this study was designed retrospectively, relying on data collected over a 15-year period. Therefore, our study is susceptible to inherent biases, which limits control over confounding variables. Third, the determination of mucus plugs through chest CT scans is subject to interpretation, even with inter-reader calibration. The variability in radiological interpretation could introduce measurement bias, impacting the reliability of the mucus plug scores and potentially affecting the observed associations.
In conclusion, the presence of mucus plugs is associated with an increased risk of moderate-to-severe and severe exacerbations, particularly non-eosinophilic exacerbations, as well as an accelerated decline in FEV1 in COPD patients. The identification of mucus plugs may serve as a valuable prognostic marker for assessing the risk of exacerbations and lung function decline in COPD patients.
Ethical Approval and Consent to ParticipateIn accordance with the Declaration of Helsinki, our study was conducted with adherence to ethical standards. This study received approval (IRB no. 30-2024-1) from the Institutional Review Board of Seoul Metropolitan Government-Seoul National University (SMG-SNU) Boramae Medical Center, which exempted the need for written informed consent.
FundingThis research received no specific grant from any funding agency in the public, commercial, or not-for-profit sectors.
Authors’ ContributionsStudy concept and design: K.N.J., H.W.L.
Acquisition of data: K.N.J., H.J.L., H.P., J.K.L., E.Y.H., D.K.K., H.W.L.
Analysis and interpretation of data: K.N.J., J.K.L., E.Y.H., D.K.K., H.W.L.
Drafting the manuscript: K.N.J., H.W.L.
Critical revision of the manuscript and important intellectual content: K.N.J., J.K.L., E.Y.H., D.K.K., H.W.L.
Obtained funding: Not applicable.
Study supervision: H.W.L.
Conflict of InterestThe authors declare that they have no known competing financial interests or personal relationships that could have appeared to influence the work reported in this paper.
Availability of Data and MaterialsDue to the confidential nature of patient information, direct data sharing is not permitted. However, interested researchers may request access to the data by obtaining approval from the Institutional Review Board (IRB). Requests for data sharing can be directed to the corresponding author, and upon approval from the IRB, appropriate datasets or information may be shared in accordance with ethical and privacy considerations.