


Identifying high-risk patients is fundamental to slowing disease progression in mild-to-moderate COPD. Over one-fifth of these patients have impaired ventilatory efficiency, strongly associated with advanced disease severity, while its unclear prognostic value for high-risk case identification persists.
MethodsThis was a prospective cohort study conducted from July 2019 to September 2024 (encompassing the COVID-19 pandemic period) in China. Non-COPD subjects and mild-to-moderate COPD patients who completed questionnaires, lung function tests and cardiopulmonary exercise tests at baseline were annually followed up over 3 years. Subjects with predefined high-risk criteria, including CAT score≥10, mMRC score≥2, postbronchodilator FEV1<60% predicted, and frequent exacerbations, were further excluded. Impaired ventilatory efficiency was defined as a nadir minute ventilation/CO2 output≥the upper limit of normal. Outcomes included annual lung function decline, exacerbation risks, and symptom scores.
ResultsA total of 780 subjects were included, with 684 (88%) completing follow-up. Patients with impaired ventilatory efficiency displayed a greater annual decline in postbronchodilator FEV1 (54 [95% CI: 32–76]mL/year) than patients with normal ventilatory efficiency (31 [15–47] mL/year, adjusted P=0.008) and non-COPD subjects (31 [22–40]mL/year, adjusted P=0.001). However, no significant difference existed between patients with normal ventilatory efficiency and non-COPD subjects (adjusted P=0.756). Similar results were observed for exacerbation risks and symptom scores.
ConclusionsImpaired ventilatory efficiency can identify high-risk mild-to-moderate COPD patients with poor prognosis independently of established risk factors. Further studies are needed to explore effective interventions for patients with impaired ventilatory efficiency.

Chronic obstructive pulmonary disease (COPD) is the third leading cause of global mortality, with its burden continuously rising.1 In China, more than 90% of patients with COPD are classified as mild-to-moderate stages.2 Patients with mild-to-moderate COPD experience a more rapid decline in lung function than those in the advanced stages.3 Moreover, exacerbations in these patients can irreversibly accelerate lung function decline, and affect them more significantly than patients in the advanced stages of the disease.4 Although pharmacological interventions, particularly long-acting bronchodilators, are beneficial for patients with mild-to-moderate COPD.5,6 Concerns have been raised about potential overtreatment if all of these patients receive pharmacological intervention, as only a subset of them experience the disease progression, including rapid lung function decline, frequent exacerbations, and increased respiratory symptoms.7,8 Therefore, the effective identification of high-risk patients with poor prognosis is crucial for implementing personalized treatment strategies and improving outcomes.9,10
Current identification of high-risk COPD patients requiring treatment primarily relies on symptomatic or lung function criteria: (1) COPD Assessment Test (CAT) score≥10; (2) modified Medical Research Council (mMRC) dyspnea scale≥2; (3) postbronchodilator forced expiratory volume in 1 second (FEV1)<60% predicted; or (4) frequent exacerbations.11,12 However, most patients with mild-to-moderate COPD fail to meet these thresholds.13 This gap suggests the potential existence of undetected high-risk subgroups with poor prognosis, requiring longitudinal cohort studies to identify novel risk stratification markers.
The cardiopulmonary exercise test (CPET) is a method used to evaluate the pathophysiological changes in subjects as they reach peak exercise capacity. In the early stages of COPD, patients still retain a certain level of exercise reserve, which is why no significant symptoms or pathophysiological changes are observed at rest. Compared to conventional resting spirometry test, CPET is more sensitive in detecting early pathophysiological changes in COPD.14 Ventilatory efficiency, measured by CPET, is typically quantified by the nadir minute ventilation (V˙E)/carbon dioxide output (V˙CO2).15,16 Elevated values of this parameter above the upper limit of the normal (ULN) reference range indicate impaired ventilatory efficiency, necessitating an increased ventilation volume to effectively expel the CO2 produced during exercise.17,18 Previous studies found impaired ventilatory efficiency was associated with lower lung function, more severe emphysema, increased exertional dyspnea, impaired exercise tolerance, and a higher mortality risk in patients with COPD.17–19 Although patients with mild-to-moderate COPD have mild lung lesions, more than one-fifth demonstrate impaired ventilatory efficiency.17,20 It is not well understood whether patients with impaired ventilatory efficiency would exhibit rapid disease progression and those with normal ventilatory efficiency had no worse prognosis than non-COPD subjects.
With this in mind, we hypothesized that impaired ventilatory efficiency could help to identify a subset of mild-to-moderate COPD patients with rapidly progressive disease. To validate this hypothesis, we conducted a three-year prospective, observational, community-based cohort study in China, involving non-COPD subjects and mild-to-moderate COPD patients, to understand the association between impaired ventilatory efficiency and respiratory health outcomes.
MethodsStudy Design and SubjectsThe subjects were recruited during the community screening phase of the Early Chronic Obstructive Pulmonary Disease (ECOPD) study, a multicentre, community-based cohort study in China.21 The ECOPD study, approved by the Ethics Committee of the First Affiliated Hospital of Guangzhou Medical University (No. 2018-53), aims to longitudinally track individuals with and without COPD to identify parameters that may predict disease progression in early-stage COPD. Written informed consent was obtained from all subjects. Non-COPD subjects and mild-to-moderate COPD patients were included in this study.
The inclusion criteria were age 40–80 years with complete questionnaire, lung function, and CPET data. The exclusion criteria were: (1) acute exacerbation within past 4 weeks; (2) severe/very severe COPD defined as postbronchodilator FEV1/forced vital capacity (FVC)<0.70 and FEV1<50% predicted; (3) lobectomy history; (4) active cancer treatment; (5) active pulmonary tuberculosis, silicosis, extensive bronchiectasis, or other serious lung conditions; or (6) CPET contraindications and severe cardiovascular disease affecting ventilatory efficiency, including pulmonary hypertension, heart failure, pulmonary embolism, and severe coronary heart disease. To establish the independent prognostic value of impaired ventilatory efficiency, we further excluded subjects meeting predefined high-risk criteria: (1) CAT≥10, (2) mMRC≥2, (3) postbronchodilator FEV1<60% predicted, or (4) frequent exacerbations (≥2 moderate or ≥1 severe events in the year prior to baseline).11,12
QuestionnaireDemographic information, respiratory-related risk factors, chronic respiratory symptoms, comorbidities, medication history, and exacerbations experienced in the year before baseline were collected.22,23 Respiratory-related risk factors included smoking history, passive smoke exposure, biomass exposure, occupational exposure, and a family history of respiratory disease. Chronic respiratory symptoms included dyspnea, chronic cough, chronic sputum, and wheezing.
Lung Function TestsPrebronchodilator and postbronchodilator lung function tests used portable spirometers (CareFusion, Yorba Linda, CA, USA), adhering to American Thoracic Society and European Respiratory Society guidelines for standard operating procedures and quality control.24,25 We used the reference values for lung function provided by the 1993 European Community for Steel and Coal, and subsequently adjusted the predicted FEV1 values using correction factors tailored to the characteristics of the Chinese population (0.95 for men, 0.93 for women).26,27 Non-COPD was defined as postbronchodilator FEV1/FVC ratio≥0.70, while mild-to-moderate COPD was defined as postbronchodilator FEV1/FVC ratio<0.70 and FEV1≥50% predicted.1
CPETThe subjects underwent a maximal incremental CPET on a calibrated cycle ergometer (Quark PFT Ergo Bp900; COSMED, Rome, Italy). They were encouraged to maintain a pedaling speed of 55–65rpm during the exercise phase until maximum exertion or limiting symptoms occurred, transitioning then to the recovery phase.28 Ventilation flow and CO2 concentrations were measured via breath-by-breath analysis during CPET. V˙CO2 was calculated as the product of CO2 concentration and V˙E. The nadir V˙E/V˙CO2 represents the lowest 30-s average ratio during exercise, typically occurring around the ventilatory compensation point, and is neither measured at maximal exertion nor protocol-dependent.16 Ventilatory efficiency in this study was assessed by the nadir V˙E/V˙CO2 because its high reproducibility in both healthy individuals and COPD patients.29 Impaired ventilatory efficiency was considered if the nadir V˙E/V˙CO2 exceeded the ULN as per the Wasserman and Sun equation.16
Chest CTThoracic CT imaging was acquired using 128-slice multi-detector scanners (Siemens/United-imaging) during maximal inspiration and expiration. Quantitative analyses through 3D Slicer's Chest Imaging Platform included: total lung capacity and residual volume measurements; emphysema quantification via inspiratory low-attenuation areas<−950Hounsfield units; air trapping assessment using expiratory attenuation thresholds<−856Hounsfield units; along with three-dimensional vascular modeling to determine total intraparenchymal vessel volume and small vessel fraction.30–32
Study OutcomesThe study outcomes of interest were lung function decline, exacerbation, and respiratory symptoms. The subjects underwent annual prebronchodilator and postbronchodilator lung function tests, with procedures and quality control consistent over the follow-up visits. In cases of exacerbation during follow-up, lung function data collection was delayed until 4 weeks after resolution. Exacerbation, including acute exacerbation for COPD patients and acute respiratory events for non-COPD subjects, was defined as the presence/worsening of ≥2 of the following symptoms: cough, sputum production, purulent sputum, wheezing, or dyspnea lasting>48h after excluding congestive heart failure, pulmonary embolism, pneumothorax, pleural effusion, and arrhythmia.4,5,33 Moderate-to-severe exacerbations required outpatient/emergency/hospital care with antibiotics and/or systemic corticosteroids. Subjects were given the contact information of the researcher and instructed to promptly report any respiratory symptom deterioration. The research team documented and evaluated all exacerbations details.
Statistical AnalysisThis study was an exploratory analysis, so the sample size was not calculated previously and no pairwise adjustment for multiple comparisons was performed. The calculated power for the primary outcome was 87% in this study based on the following data: a 27mL/year difference in the annual decline of postbronchodilator FEV1 between non-COPD subjects (n=465) and patients with impaired ventilatory efficiency (n=84), with a standard deviation of 90mL/year and a two-tailed significance level of 5% (PASS 23.0.2).6
Baseline characteristics were compared between the groups by analysis of variance for continuous variables and the Chi-square test or Fisher's exact test for categorical variables. Random coefficient regression models were used to compare the annual decline in lung function among the three groups. Mixed-effects models for repeated measures were used to identify differences in lung function and CAT score between the groups across multiple visits. Least-squares mean estimates were used to determine the changes of lung function at each time point relative to baseline. Exacerbations were evaluated using a negative binomial model, and the natural log-transformed follow-up duration was considered as an offset variable. The chi-square test was used to identify differences in mMRC dyspnea score between groups at each visit.
In analyses of lung function decline, exacerbations, and respiratory symptoms, we adjusted for potential confounders including age, sex, body mass index, smoking status, smoking index, passive smoking at home, biomass exposure, occupational exposure, and family history of respiratory diseases. Longitudinal lung function models further incorporated baseline parameter values, while exacerbations analyze further accounted for pre-baseline exacerbation frequency. As severe cardiovascular diseases affecting ventilatory efficiency were exclusion criteria, cardiovascular comorbidities with comparable prevalence across groups were not included in adjustment models.
To validate the robustness of the results, we conducted four sensitivity analyses. First, we analyzed the study outcome without excluding subjects meeting predefined high-risk criteria. Second, we used the lower limit of normal for FEV1/FVC ratio reference values and predicted FEV1 values obtained from the healthy Chinese population to diagnose and grade COPD.34 Third, we defined impaired ventilatory efficiency using an absolute cut-off value (nadir V˙E/V˙CO2>34) based on the previous study.16 Finally, we analyzed subjects who reached the ventilation compensation point.
Subjects with at least one follow-up data point for each outcome were included in longitudinal analyses. Minimal missing data in key variables were assumed missing at random, and analyses conducted on available cases. Statistical analyses were performed using SPSS 24.0 software (IBM Corp., Armonk, NY, US) and SAS 9.4 software (SAS, Cary, NC). Two-sided P<0.05 was considered significant.
ResultsStudy Recruitment and Follow-UpThe study flowchart is shown in Fig. 1. From 1004 subjects completing baseline CPET with valid questionnaires and lung function data, 909 were non-COPD or mild-to-moderate COPD qualified for nadir V˙E/V˙CO2 analysis. After excluding 129 subjects meeting predefined high-risk criteria, the final cohort (n=780) comprised three subgroups: 516 non-COPD subjects, 173 patients with normal ventilatory efficiency, and 91 patients with impaired ventilatory efficiency. The cohort maintained 88% (684/780) retention rate at 3-year follow-up.
 CAT≥10; (2) mMRC≥2; (3) post-bronchodilator FEV1<60% predicted; or (4) frequent exacerbations (≥2 moderate or ≥1 severe exacerbations in the year prior to baseline). No subjects in this community-based study had frequent exacerbations before enrolment. † Subjects with at least one follow-up data point for each outcome (lung function decline, exacerbations, respiratory symptoms) were included in longitudinal analyses. Abbreviations: BD=bronchodilator, COPD=chronic obstructive pulmonary disease, CPET=cardiopulmonary exercise testing, CAT=COPD Assessment Test, mMRC=modified Medical Research Council, FEV1=forced expiratory volume in 1 second; FVC=forced vital capacity, ULN=upper limit of normal, V˙E/V˙CO2 = ventilatory equivalent for carbon dioxide production.")
Flowchart of patient eligibility, screening, and follow-up. * To establish the independent prognostic value of impaired ventilatory efficiency, we further excluded subjects meeting predefined high-risk criteria requiring treatment: (1) CAT≥10; (2) mMRC≥2; (3) post-bronchodilator FEV1<60% predicted; or (4) frequent exacerbations (≥2 moderate or ≥1 severe exacerbations in the year prior to baseline). No subjects in this community-based study had frequent exacerbations before enrolment. † Subjects with at least one follow-up data point for each outcome (lung function decline, exacerbations, respiratory symptoms) were included in longitudinal analyses. Abbreviations: BD=bronchodilator, COPD=chronic obstructive pulmonary disease, CPET=cardiopulmonary exercise testing, CAT=COPD Assessment Test, mMRC=modified Medical Research Council, FEV1=forced expiratory volume in 1 second; FVC=forced vital capacity, ULN=upper limit of normal, V˙E/V˙CO2 = ventilatory equivalent for carbon dioxide production.
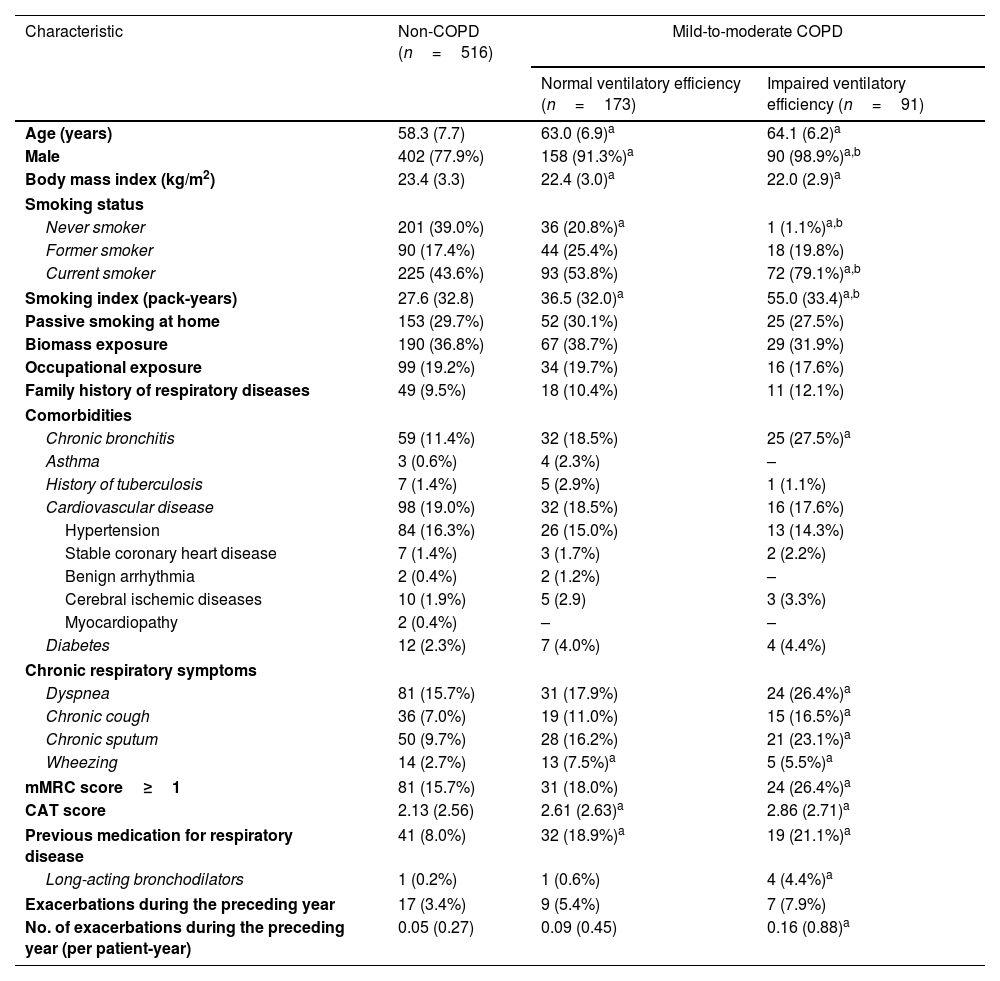
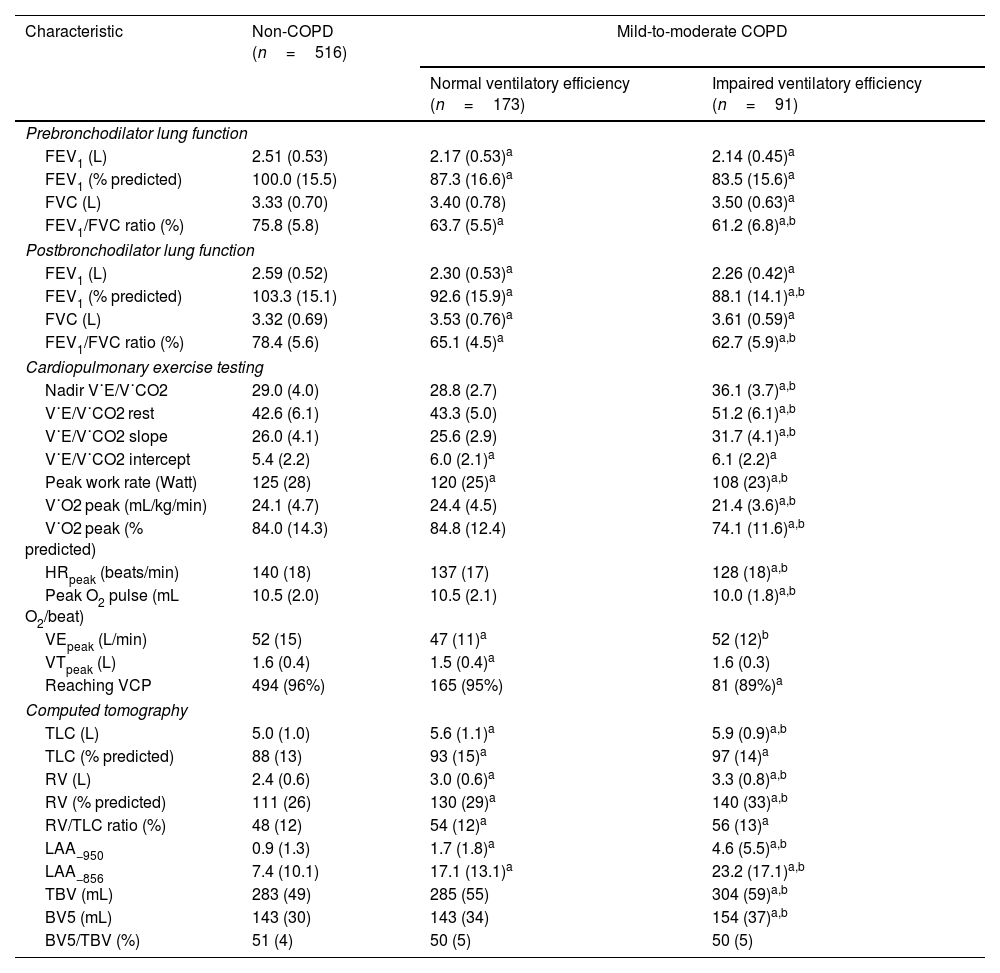
Patients with impaired ventilatory efficiency (mean age 64.1 years, 98.9% male) demonstrated higher smoking exposure (55.0±33.4 pack-years), increased prevalence of chronic bronchitis and respiratory symptoms, and elevated CAT/mMRC dyspnea scores compared to non-COPD subjects. Among patients with impaired ventilatory efficiency, 21.1% had previously used respiratory medication, with 4.4% using long-acting bronchodilators (Table 1). They also had poorer lung function and exercise tolerance, higher RV/TLC, and more severe lung structural changes such as emphysema and air trapping than non-COPD subjects and patients with normal ventilatory efficiency (Table 2).
Baseline demographic and clinical characteristics of the study subjects.
| Characteristic | Non-COPD (n=516) | Mild-to-moderate COPD | |
|---|---|---|---|
| Normal ventilatory efficiency (n=173) | Impaired ventilatory efficiency (n=91) | ||
| Age (years) | 58.3 (7.7) | 63.0 (6.9)a | 64.1 (6.2)a |
| Male | 402 (77.9%) | 158 (91.3%)a | 90 (98.9%)a,b |
| Body mass index (kg/m2) | 23.4 (3.3) | 22.4 (3.0)a | 22.0 (2.9)a |
| Smoking status | |||
| Never smoker | 201 (39.0%) | 36 (20.8%)a | 1 (1.1%)a,b |
| Former smoker | 90 (17.4%) | 44 (25.4%) | 18 (19.8%) |
| Current smoker | 225 (43.6%) | 93 (53.8%) | 72 (79.1%)a,b |
| Smoking index (pack-years) | 27.6 (32.8) | 36.5 (32.0)a | 55.0 (33.4)a,b |
| Passive smoking at home | 153 (29.7%) | 52 (30.1%) | 25 (27.5%) |
| Biomass exposure | 190 (36.8%) | 67 (38.7%) | 29 (31.9%) |
| Occupational exposure | 99 (19.2%) | 34 (19.7%) | 16 (17.6%) |
| Family history of respiratory diseases | 49 (9.5%) | 18 (10.4%) | 11 (12.1%) |
| Comorbidities | |||
| Chronic bronchitis | 59 (11.4%) | 32 (18.5%) | 25 (27.5%)a |
| Asthma | 3 (0.6%) | 4 (2.3%) | – |
| History of tuberculosis | 7 (1.4%) | 5 (2.9%) | 1 (1.1%) |
| Cardiovascular disease | 98 (19.0%) | 32 (18.5%) | 16 (17.6%) |
| Hypertension | 84 (16.3%) | 26 (15.0%) | 13 (14.3%) |
| Stable coronary heart disease | 7 (1.4%) | 3 (1.7%) | 2 (2.2%) |
| Benign arrhythmia | 2 (0.4%) | 2 (1.2%) | – |
| Cerebral ischemic diseases | 10 (1.9%) | 5 (2.9) | 3 (3.3%) |
| Myocardiopathy | 2 (0.4%) | – | – |
| Diabetes | 12 (2.3%) | 7 (4.0%) | 4 (4.4%) |
| Chronic respiratory symptoms | |||
| Dyspnea | 81 (15.7%) | 31 (17.9%) | 24 (26.4%)a |
| Chronic cough | 36 (7.0%) | 19 (11.0%) | 15 (16.5%)a |
| Chronic sputum | 50 (9.7%) | 28 (16.2%) | 21 (23.1%)a |
| Wheezing | 14 (2.7%) | 13 (7.5%)a | 5 (5.5%)a |
| mMRC score≥1 | 81 (15.7%) | 31 (18.0%) | 24 (26.4%)a |
| CAT score | 2.13 (2.56) | 2.61 (2.63)a | 2.86 (2.71)a |
| Previous medication for respiratory disease | 41 (8.0%) | 32 (18.9%)a | 19 (21.1%)a |
| Long-acting bronchodilators | 1 (0.2%) | 1 (0.6%) | 4 (4.4%)a |
| Exacerbations during the preceding year | 17 (3.4%) | 9 (5.4%) | 7 (7.9%) |
| No. of exacerbations during the preceding year (per patient-year) | 0.05 (0.27) | 0.09 (0.45) | 0.16 (0.88)a |
Data are shown as mean (SD) or n (%), as appropriate.
Analysis of variance was used to compare the baseline characteristics between the three groups for continuous variables, while the Chi-square test or Fisher's exact test was used to compare the categorical variables.
Baseline lung function, cardiopulmonary exercise testing, and computed tomography of the study subjects.
| Characteristic | Non-COPD (n=516) | Mild-to-moderate COPD | |
|---|---|---|---|
| Normal ventilatory efficiency (n=173) | Impaired ventilatory efficiency (n=91) | ||
| Prebronchodilator lung function | |||
| FEV1 (L) | 2.51 (0.53) | 2.17 (0.53)a | 2.14 (0.45)a |
| FEV1 (% predicted) | 100.0 (15.5) | 87.3 (16.6)a | 83.5 (15.6)a |
| FVC (L) | 3.33 (0.70) | 3.40 (0.78) | 3.50 (0.63)a |
| FEV1/FVC ratio (%) | 75.8 (5.8) | 63.7 (5.5)a | 61.2 (6.8)a,b |
| Postbronchodilator lung function | |||
| FEV1 (L) | 2.59 (0.52) | 2.30 (0.53)a | 2.26 (0.42)a |
| FEV1 (% predicted) | 103.3 (15.1) | 92.6 (15.9)a | 88.1 (14.1)a,b |
| FVC (L) | 3.32 (0.69) | 3.53 (0.76)a | 3.61 (0.59)a |
| FEV1/FVC ratio (%) | 78.4 (5.6) | 65.1 (4.5)a | 62.7 (5.9)a,b |
| Cardiopulmonary exercise testing | |||
| Nadir V˙E/V˙CO2 | 29.0 (4.0) | 28.8 (2.7) | 36.1 (3.7)a,b |
| V˙E/V˙CO2 rest | 42.6 (6.1) | 43.3 (5.0) | 51.2 (6.1)a,b |
| V˙E/V˙CO2 slope | 26.0 (4.1) | 25.6 (2.9) | 31.7 (4.1)a,b |
| V˙E/V˙CO2 intercept | 5.4 (2.2) | 6.0 (2.1)a | 6.1 (2.2)a |
| Peak work rate (Watt) | 125 (28) | 120 (25)a | 108 (23)a,b |
| V˙O2 peak (mL/kg/min) | 24.1 (4.7) | 24.4 (4.5) | 21.4 (3.6)a,b |
| V˙O2 peak (% predicted) | 84.0 (14.3) | 84.8 (12.4) | 74.1 (11.6)a,b |
| HRpeak (beats/min) | 140 (18) | 137 (17) | 128 (18)a,b |
| Peak O2 pulse (mL O2/beat) | 10.5 (2.0) | 10.5 (2.1) | 10.0 (1.8)a,b |
| VEpeak (L/min) | 52 (15) | 47 (11)a | 52 (12)b |
| VTpeak (L) | 1.6 (0.4) | 1.5 (0.4)a | 1.6 (0.3) |
| Reaching VCP | 494 (96%) | 165 (95%) | 81 (89%)a |
| Computed tomography | |||
| TLC (L) | 5.0 (1.0) | 5.6 (1.1)a | 5.9 (0.9)a,b |
| TLC (% predicted) | 88 (13) | 93 (15)a | 97 (14)a |
| RV (L) | 2.4 (0.6) | 3.0 (0.6)a | 3.3 (0.8)a,b |
| RV (% predicted) | 111 (26) | 130 (29)a | 140 (33)a,b |
| RV/TLC ratio (%) | 48 (12) | 54 (12)a | 56 (13)a |
| LAA−950 | 0.9 (1.3) | 1.7 (1.8)a | 4.6 (5.5)a,b |
| LAA−856 | 7.4 (10.1) | 17.1 (13.1)a | 23.2 (17.1)a,b |
| TBV (mL) | 283 (49) | 285 (55) | 304 (59)a,b |
| BV5 (mL) | 143 (30) | 143 (34) | 154 (37)a,b |
| BV5/TBV (%) | 51 (4) | 50 (5) | 50 (5) |
Data are shown as mean (SD) or n (%), as appropriate.
Analysis of variance was used to compare the baseline characteristics between the three groups for continuous variables, while the chi-square test or Fisher's exact test was used to compare the categorical variables.
Significant difference from COPD patients with normal ventilatory efficiency.
Abbreviations: BV5=volume of pulmonary vessels less than 5mm2 in cross-sectional area, COPD=chronic obstructive pulmonary disease, FEV1=forced expiratory volume in 1second, FVC=forced vital capacity, HR=heart rate, LAA−950=the low-attenuation area of the lung with attenuation values below−950 Hounsfield units, LAA−856=the low-attenuation area of the lung with attenuation values below−856 Hounsfield units, RV=residual volume measured at end-expiration using computed tomography, TBV=total volume of all intraparenchymal vessels, TLC=total lung capacity measured at full inspiration using computed tomography, VCP=ventilation compensation point, VE=minute ventilation, V˙E/V˙CO2 = ventilatory equivalent for carbon dioxide production, V˙O2 = oxygen uptake, VT=tidal volume.
Subjects without lung function follow-up data had fewer males, more never smokers, lower smoking index, less dyspnea symptom, lower proportion of mMRC≥1, and more diabetes than those with follow-up data (e-Table 1). Additionally, subjects without follow-up data on other respiratory outcomes (exacerbations, CAT, or mMRC) also had fewer males and more never smokers than those with corresponding follow-up data (e-Tables 2–4).
Lung Function DeclineAt the 3-year follow-up, COPD patients with impaired ventilatory efficiency displayed a greater annual decline in postbronchodilator FEV1 (54 [95% confidence interval [CI]: 32–76]mL/year) than patients with normal ventilatory efficiency (31 [95% CI: 15–47]mL/year, adjusted mean difference [AMD]=25 [95%CI: 7–44], P=0.008) and non-COPD subjects (31 [95% CI: 22–40]mL/year, AMD=27 (95% CI: 11–44), P=0.001). However, there was no significant difference between patients with normal ventilatory efficiency and non-COPD subjects (AMD=2 [95%CI: −11 to 15], P=0.756). Similar findings were observed for prebronchodilator FEV1% of predicted, postbronchodilator FEV1% of predicted, and postbronchodilator FEV1/FVC ratio (Fig. 2 and e-Table 5). The adjusted least squares mean for pre- and post-bronchodilator FEV1, FEV1% predicted, FEV1/FVC ratio, and FVC at each visit were additionally presented in e-Table 6.
. Mixed-effects models were used to identify differences in lung function among groups across multiple visits. Least-squares mean estimates were used to determine the changes at each time point relative to baseline. The model was adjusted for confounding factors including age, sex, body mass index, smoking status, smoking index, passive smoking at home, biomass exposure, occupational exposure, family history of respiratory diseases, and baseline spirometric values (pre or postbronchodilator FEV1 or FEV1% predicted). Abbreviations: COPD=chronic obstructive pulmonary disease, FEV1=forced expiratory volume in 1second, CI=confidence interval.")
Longitudinal change in lung function throughout the study. Data are shown as the mean (95%CI). Mixed-effects models were used to identify differences in lung function among groups across multiple visits. Least-squares mean estimates were used to determine the changes at each time point relative to baseline. The model was adjusted for confounding factors including age, sex, body mass index, smoking status, smoking index, passive smoking at home, biomass exposure, occupational exposure, family history of respiratory diseases, and baseline spirometric values (pre or postbronchodilator FEV1 or FEV1% predicted). Abbreviations: COPD=chronic obstructive pulmonary disease, FEV1=forced expiratory volume in 1second, CI=confidence interval.
Patients with impaired ventilatory efficiency experienced significantly more exacerbations than non-COPD subjects, with total exacerbations rates of 0.58 vs. 0.34 per patient-year (adjusted relative risk [RR]=1.64, 95% CI: 1.19–2.30, P=0.003) and moderate-to-severe exacerbations rates of 0.35 vs. 0.18 per patient-year (adjusted RR=1.80, 95% CI: 1.23–2.63, P=0.002). Patients with normal ventilatory efficiency exhibited total and moderate-to-severe exacerbation rates of 0.41 and 0.22 per patient-year, respectively, both lower than those with impaired ventilatory efficiency (Total: adjusted RR=1.38, 95% CI: 0.97–1.97, P=0.073; Moderate-to-severe: adjusted RR=1.56, 95% CI: 1.04–2.35, P=0.031). No significant differences in exacerbation rate were observed between patients with normal ventilatory efficiency and non-COPD subjects (Total: adjusted RR=1.20, 95% CI: 0.92–1.55, P=0.184; Moderate-to-severe: adjusted RR=1.15, 95% CI: 0.84–1.57, P=0.381) (Fig. 3).
. The frequency of exacerbations was evaluated for the relative risk using a negative binomial model over the 3-year follow-up period. The total events occurrences served as the response variable, while the natural log-transformed follow-up duration was considered as an offset variable. The analysis adjusted for potential confounders, including age, sex, body mass index, smoking status, smoking index, passive smoking at home, biomass exposure, occupational exposure, family history of respiratory diseases, and number of exacerbations during the year prior to baseline. Abbreviations: COPD=chronic obstructive pulmonary disease, RR=relative risk, CI=confidence interval.")
The frequency of exacerbation/acute respiratory events. Data are shown as the mean (95% CI). The frequency of exacerbations was evaluated for the relative risk using a negative binomial model over the 3-year follow-up period. The total events occurrences served as the response variable, while the natural log-transformed follow-up duration was considered as an offset variable. The analysis adjusted for potential confounders, including age, sex, body mass index, smoking status, smoking index, passive smoking at home, biomass exposure, occupational exposure, family history of respiratory diseases, and number of exacerbations during the year prior to baseline. Abbreviations: COPD=chronic obstructive pulmonary disease, RR=relative risk, CI=confidence interval.
COPD patients with impaired ventilatory efficiency showed significant differences in CAT scores and mMRC dyspnea scores compared with non-COPD subjects and patients with normal ventilatory efficiency starting at the 2-year follow-up. In contrast, minimal differences were observed in both scores between non-COPD subjects and patients with normal ventilatory efficiency subjects by the 3-year follow-up (Fig. 4, e-Tables 7, and 8).
 or n (%), as appropriate. Participants had at least one follow-up data point were included in the analysis for CAT and mMRC. Mixed-effects models were used to identify differences in CAT score between groups across multiple visits. The Chi-square test was used to identify differences in mMRC dyspnea score between groups across multiple visits. Abbreviations: COPD=chronic obstructive pulmonary disease, CAT=COPD Assessment Test, mMRC=modified Medical Research Council.")
Longitudinal change in CAT and mMRC dyspnea score throughout the study. Data are shown as the mean (95%CI) or n (%), as appropriate. Participants had at least one follow-up data point were included in the analysis for CAT and mMRC. Mixed-effects models were used to identify differences in CAT score between groups across multiple visits. The Chi-square test was used to identify differences in mMRC dyspnea score between groups across multiple visits. Abbreviations: COPD=chronic obstructive pulmonary disease, CAT=COPD Assessment Test, mMRC=modified Medical Research Council.
A sensitivity analysis of 909 subjects, including those meeting predefined high-risk criteria, aligned with the primary analysis (e-Tables 9–13). Whether using the latest lung function reference values for Chinese population (e-Tables 14–18), defining impaired ventilatory efficiency as a nadir V˙E/V˙CO2>34 (e-Tables 19–23) or including only subjects who reached the ventilation compensation point (e-Tables 24–28), patients with impaired ventilatory efficiency experienced faster lung function decline and a higher risk of moderate-to-severe exacerbations than non-COPD subjects. All above respiratory health outcome were similar between patients with normal ventilatory efficiency and non-COPD subjects.
DiscussionThis study has two main findings. We found that mild-to-moderate COPD patients with impaired ventilatory efficiency had a faster lung function decline, higher exacerbation risks, and higher respiratory symptoms compared to patients with normal ventilatory efficiency and non-COPD subjects. Moreover, there is no significant difference in the rate of annual decline in lung function and exacerbation risk between patients with normal ventilatory efficiency and non-COPD subjects.
To our knowledge, this is the first study to provide prospective evidence for respiratory health outcomes in mild-to-moderate COPD patients with impaired ventilatory efficiency. Many previous studies have explored markers of poor respiratory health prognosis in advanced COPD, such as acute exacerbations in the previous year, CAT scores, mMRC dyspnea scores, emphysema, air trapping, mucus plugging, etc.35 However, patients with mild-to-moderate COPD in the community experience fewer acute exacerbations, lower symptom scores, and milder lung structure damage compared to advanced COPD.36 Considering that mild-to-moderate COPD has mild disease severity and early intervention may slow or even halt disease progression, evaluating prognostic markers for mild-to-moderate COPD is clinically essential. The results of this study can effectively guide the prognosis assessment in clinical practice.
Mild-to-moderate COPD exhibits significant heterogeneity, with patients at similar lung function levels having varying symptoms, symptom severity, and prognosis. Although existing evidence clearly indicates that early interventions (including risk factor modification and pharmacotherapy) can slow lung function decline and improve respiratory symptoms,5,37 identifying patients requiring intensive pharmacotherapy to avoid unnecessary treatment is clinically important. Poor long-term prognosis should serve to distinguish those needing early intensive intervention.38 Our study showed that patients with impaired ventilatory efficiency had worse respiratory health outcomes, including a 27ml/year (87%) faster annual decline in FEV1 compared to non-COPD subjects, which exceeds the clinically significant 15ml/year threshold. Conversely, patients with normal ventilatory efficiency showed prognosis comparable to non-COPD subjects. These findings suggest that impaired ventilatory efficiency serves as a marker for high-risk mild-to-moderate COPD.
In clinical practice, CPET can be strategically implemented to identify patients with impaired ventilatory efficiency who do not meet predefined, easily applicable high-risk criteria, thereby enabling early interventions. A crossover clinical trial with small sample sizes has shown that inhaled nitric oxide can improve ventilatory efficiency, increase exercise tolerance and improve dyspnea in patients with mild COPD.39 Further prospective clinical trials are needed to clarify which type of pharmacological treatment is suitable for patients with mild-to-moderate COPD and impaired ventilatory efficiency.
Some patients with mild-to-moderate COPD do not have impaired ventilatory efficiency, which may be related to different risk factor exposures and different pathophysiological processes for the development and progression of COPD.40 Although the prognosis of patients with normal ventilatory efficiency is not worse, they had impaired lung function, more severe emphysema, air trapping, and static hyperinflation. Therefore, risk factor intervention and close follow-up management are still needed. Previous studies have shown that smoking cessation can improve the prognosis of mild-to-moderate COPD,37 establishing it as the foundational intervention for current smokers regardless of ventilatory efficiency status.
This study has limitations that should be considered. First, the ULN reference for nadir V˙E/V˙CO2 in this study was derived from healthy adults in the United States,16 which may limit generalizability due to ethnic variations. However, sensitivity analyses using a fixed cutoff of 34 showed consistent prognostication, supporting its clinical application until ethnic-specific references are established. Second, while 3-year follow-up may limit long-term COPD prognosis assessment, biannual measurements over 18 months reliably capture annual FEV1 decline in COPD cohorts, suggesting minimal impact on study validity.41 Third, we advocate integrating CPET into routine assessments for mild-to-moderate COPD patients to enhance high-risk screening. However, the specialized equipment requirements, high operational costs, and operator expertise limit its use to tertiary hospitals. To address these barriers, our team is developing a portable ventilatory efficiency monitor based on wearable sensors and machine learning algorithms. Fourth, COVID-19 impact was not assessed as enrollment occurred under China's zero-COVID policy with assumed uniform exposure risk. Lung function measurements were systematically delayed ≥4 weeks post-infection to minimize pandemic-related bias.
In conclusion, mild-to-moderate COPD patients with impaired ventilatory efficiency experience accelerated lung function decline, increased risk of acute exacerbations, and respiratory symptoms, warranting greater attention to slow disease progression. Further clinical trials are needed to explore the effectiveness of early intervention for patients with impaired ventilatory efficiency.
Contribution of Each AuthorPR and YZ supervised the study. ZD had the idea for and designed the study. ZD and FW did the statistical analysis. All authors contributed to the acquisition, analysis, or interpretation of data. ZD and FW wrote the draft report. All authors revised the report and approved the final version before submission. ZD, FW, and QW have accessed and verified the data in this study. PR and YZ were responsible for the decision to submit the manuscript.
Artificial Intelligence InvolvementNo content in this manuscript has been partially or totally produced with the help of any artificial intelligence software or tool.
Funding of the ResearchThis work was supported by the Foundation of Guangzhou National Laboratory (SRPG22-016 and SRPG22-018), the Clinical and Epidemiological Research Project of State Key Laboratory of Respiratory Disease (SKLRD-L-202402), the Major Clinical Research Project of Guangzhou Medical University's Scientific Research Capability Improvement Plan (GMUCR2024-01012), and the Department of Health of Guangdong Province (ZNSXS-20250019).
Conflicts of InterestThe authors declare not to have any conflicts of interest that may be considered to influence directly or indirectly the content of the manuscript.
We thank all the study participants and personnel who assisted with this study. For continuous support, assistance and cooperation, we thank the medical staff of the Lianping County People's Hospital and Wengyuan County People's Hospital for their assistance in conducting this study. We also thank Peiyu Huang, Ningning Zhao, Shan Xiao, Heshen Tian, Xiang Wen, Jianwu Xu, Bijia Lin, Shaodan Wei, and Xiaopeng Ling (The First Affiliated Hospital of Guangzhou Medical University) for their efforts in collecting the information and verification. We thank Emily Woodhouse, PhD, from Liwen Bianji (Edanz) (www.liwenbianji.cn) for editing the English text of a draft of this manuscript.
The followings are the supplementary data to this article:


