

The first cases of coronavirus disease 2019 (COVID-19) were identified in Wuhan, China1 a year ago. However, few studies have been published comparing the characteristics and clinical outcomes of hospitalized patients with pneumonia secondary to severe acute respiratory syndrome coronavirus 2 (SARS-CoV-2) of the first and second wave of the pandemic in Europe. Moreover, it has not been investigated whether patient management and health indicators improved during the second wave as a result of the experience acquired during the first. The objective of this study is to compare the characteristics and outcomes of hospitalized patients with COVID-19 of the first and second wave of the pandemic.
Data were collected from the medical reports of patients diagnosed with Covid-19 and admitted to our hospital, from February 2020 (date of first Covid-19 diagnosis) to December 31 (first wave until June 30; second wave since July 1). The study was approved by the Institutional Review Board (#2020/194). A case of Covid-19 was confirmed in the presence of a positive result in the reverse transcription polymerase chain reaction test on samples obtained from nasal or throat swabs, or a positive antigen test performed in accordance with the Spanish Ministry of Health recommendations.2 Only laboratory-confirmed cases were considered for analysis. All patients diagnosed with Covid-19 pneumonia3 were hospitalized and included in the study. All data were recorded at admission (+1 day). Patient were eligible for intensive care unit (ICU) admission if required mechanical ventilation or had a fraction of inspired oxygen (FiO2) of at least 60% or more. Radiological anomalies were collected from reports of the Unit of Radiology.
We assumed missing data occurred at random depending on the clinical variables and performed multiple imputations using chained equations. Missing values were predicted from other outcome predictors. We created 100 datasets with identical known information but with differences in imputed values reflecting the uncertainty associated with imputations. In total <1% clinical data items were imputed (see Table 1). We used Chi-square test to compare proportions and Mann–Whitney U test for comparison of quantitative variables. Logistic regression analyses were performed to investigate the effects of the two waves on outcomes (risk of death, ICU admission and the risk for mechanical ventilation). For this purpose, regression models were tested using non-parametric techniques, adjusted for the predictors of the DALSH score (diabetes, age, lymphocytes, oxygen saturation, pH).4 Results are presented as Odds Ratio (OR) with 95% confidence intervals (95%CI). Statistical analyses were carried out in R using the mice and mgcv packages. These packages are freely available at http://cran.r-project.org.
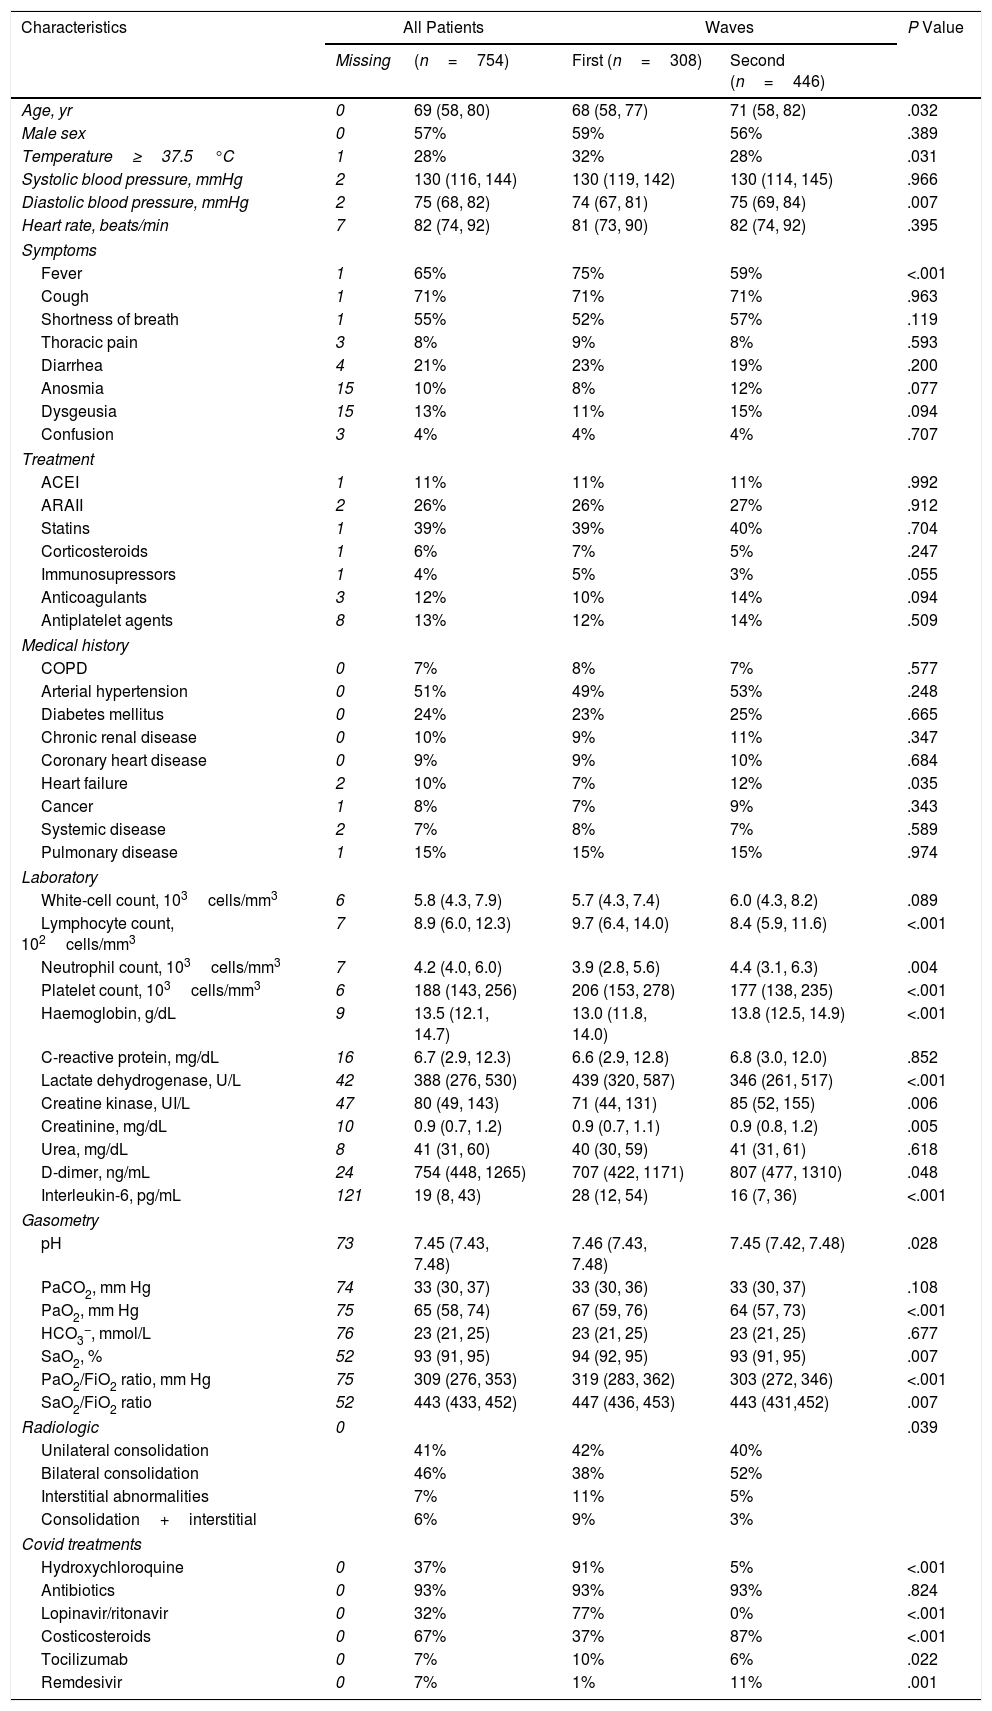
Clinical Characteristics of the Study Patients.
| Characteristics | All Patients | Waves | P Value | ||
|---|---|---|---|---|---|
| Missing | (n=754) | First (n=308) | Second (n=446) | ||
| Age, yr | 0 | 69 (58, 80) | 68 (58, 77) | 71 (58, 82) | .032 |
| Male sex | 0 | 57% | 59% | 56% | .389 |
| Temperature≥37.5°C | 1 | 28% | 32% | 28% | .031 |
| Systolic blood pressure, mmHg | 2 | 130 (116, 144) | 130 (119, 142) | 130 (114, 145) | .966 |
| Diastolic blood pressure, mmHg | 2 | 75 (68, 82) | 74 (67, 81) | 75 (69, 84) | .007 |
| Heart rate, beats/min | 7 | 82 (74, 92) | 81 (73, 90) | 82 (74, 92) | .395 |
| Symptoms | |||||
| Fever | 1 | 65% | 75% | 59% | <.001 |
| Cough | 1 | 71% | 71% | 71% | .963 |
| Shortness of breath | 1 | 55% | 52% | 57% | .119 |
| Thoracic pain | 3 | 8% | 9% | 8% | .593 |
| Diarrhea | 4 | 21% | 23% | 19% | .200 |
| Anosmia | 15 | 10% | 8% | 12% | .077 |
| Dysgeusia | 15 | 13% | 11% | 15% | .094 |
| Confusion | 3 | 4% | 4% | 4% | .707 |
| Treatment | |||||
| ACEI | 1 | 11% | 11% | 11% | .992 |
| ARAII | 2 | 26% | 26% | 27% | .912 |
| Statins | 1 | 39% | 39% | 40% | .704 |
| Corticosteroids | 1 | 6% | 7% | 5% | .247 |
| Immunosupressors | 1 | 4% | 5% | 3% | .055 |
| Anticoagulants | 3 | 12% | 10% | 14% | .094 |
| Antiplatelet agents | 8 | 13% | 12% | 14% | .509 |
| Medical history | |||||
| COPD | 0 | 7% | 8% | 7% | .577 |
| Arterial hypertension | 0 | 51% | 49% | 53% | .248 |
| Diabetes mellitus | 0 | 24% | 23% | 25% | .665 |
| Chronic renal disease | 0 | 10% | 9% | 11% | .347 |
| Coronary heart disease | 0 | 9% | 9% | 10% | .684 |
| Heart failure | 2 | 10% | 7% | 12% | .035 |
| Cancer | 1 | 8% | 7% | 9% | .343 |
| Systemic disease | 2 | 7% | 8% | 7% | .589 |
| Pulmonary disease | 1 | 15% | 15% | 15% | .974 |
| Laboratory | |||||
| White-cell count, 103cells/mm3 | 6 | 5.8 (4.3, 7.9) | 5.7 (4.3, 7.4) | 6.0 (4.3, 8.2) | .089 |
| Lymphocyte count, 102cells/mm3 | 7 | 8.9 (6.0, 12.3) | 9.7 (6.4, 14.0) | 8.4 (5.9, 11.6) | <.001 |
| Neutrophil count, 103cells/mm3 | 7 | 4.2 (4.0, 6.0) | 3.9 (2.8, 5.6) | 4.4 (3.1, 6.3) | .004 |
| Platelet count, 103cells/mm3 | 6 | 188 (143, 256) | 206 (153, 278) | 177 (138, 235) | <.001 |
| Haemoglobin, g/dL | 9 | 13.5 (12.1, 14.7) | 13.0 (11.8, 14.0) | 13.8 (12.5, 14.9) | <.001 |
| C-reactive protein, mg/dL | 16 | 6.7 (2.9, 12.3) | 6.6 (2.9, 12.8) | 6.8 (3.0, 12.0) | .852 |
| Lactate dehydrogenase, U/L | 42 | 388 (276, 530) | 439 (320, 587) | 346 (261, 517) | <.001 |
| Creatine kinase, UI/L | 47 | 80 (49, 143) | 71 (44, 131) | 85 (52, 155) | .006 |
| Creatinine, mg/dL | 10 | 0.9 (0.7, 1.2) | 0.9 (0.7, 1.1) | 0.9 (0.8, 1.2) | .005 |
| Urea, mg/dL | 8 | 41 (31, 60) | 40 (30, 59) | 41 (31, 61) | .618 |
| D-dimer, ng/mL | 24 | 754 (448, 1265) | 707 (422, 1171) | 807 (477, 1310) | .048 |
| Interleukin-6, pg/mL | 121 | 19 (8, 43) | 28 (12, 54) | 16 (7, 36) | <.001 |
| Gasometry | |||||
| pH | 73 | 7.45 (7.43, 7.48) | 7.46 (7.43, 7.48) | 7.45 (7.42, 7.48) | .028 |
| PaCO2, mm Hg | 74 | 33 (30, 37) | 33 (30, 36) | 33 (30, 37) | .108 |
| PaO2, mm Hg | 75 | 65 (58, 74) | 67 (59, 76) | 64 (57, 73) | <.001 |
| HCO3−, mmol/L | 76 | 23 (21, 25) | 23 (21, 25) | 23 (21, 25) | .677 |
| SaO2, % | 52 | 93 (91, 95) | 94 (92, 95) | 93 (91, 95) | .007 |
| PaO2/FiO2 ratio, mm Hg | 75 | 309 (276, 353) | 319 (283, 362) | 303 (272, 346) | <.001 |
| SaO2/FiO2 ratio | 52 | 443 (433, 452) | 447 (436, 453) | 443 (431,452) | .007 |
| Radiologic | 0 | .039 | |||
| Unilateral consolidation | 41% | 42% | 40% | ||
| Bilateral consolidation | 46% | 38% | 52% | ||
| Interstitial abnormalities | 7% | 11% | 5% | ||
| Consolidation+interstitial | 6% | 9% | 3% | ||
| Covid treatments | |||||
| Hydroxychloroquine | 0 | 37% | 91% | 5% | <.001 |
| Antibiotics | 0 | 93% | 93% | 93% | .824 |
| Lopinavir/ritonavir | 0 | 32% | 77% | 0% | <.001 |
| Costicosteroids | 0 | 67% | 37% | 87% | <.001 |
| Tocilizumab | 0 | 7% | 10% | 6% | .022 |
| Remdesivir | 0 | 7% | 1% | 11% | .001 |
ACEI, angiotensin-converting enzyme inhibitors; ARAII, angiotensin II receptor antagonists; COPD, chronic obstructive pulmonary disease.
Data are percentages or medians (percentil25, percentil75).
Fig. 1 shows the number of hospitalized patients by month during the two waves. Table 1 shows the characteristics of patients at baseline. As compared to the first wave, during the second wave, patients were significantly older, had fever less frequently, received the same medications and had similar comorbidities as patients of the first wave. Of note, the prevalence of heart failure was higher. Laboratory data show a lower inflammatory component (lower levels of lactate dehydrogenase and interleukin-6 and similar C-reactive protein levels) and lower concentrations of lymphocyte and platelets. In addition, respiratory distress (lower SaO2, PaO2/FiO2 and SaO2/FiO2 ratios) and bilateral consolidations on chest X-ray were more frequent in the second wave, whereas interstitial abnormalities were less frequent. A higher use of corticosteroids and remdesivir was observed in the second wave, whereas hydroxychloroquine was hardly administered (5%) and Lopinavir/ritonavir were no longer used.

The median length of hospital stay was significantly higher during the first wave [10 (7, 19) vs 9 (6, 13) days; P<.001]. Health indicators were poorer in the first than in the second wave (admission to ICU, 13% vs 11%; mechanical ventilation, 11% vs 7%; deaths, 17% vs 15%).
After adjusting for diabetes, age, lymphocyte count, oxygen saturation and pH (DALSH score), the risk for mechanical ventilation (OR 0.45, 95%CI 0.26–0.79) and for death (OR 0.52, 95%CI 0.31–0.85) were significantly lower in the second wave than in the first wave. The risk of admission to ICU (0.65, 95%CI 0.40–1.05) was also lower but without reaching significantly statistical association.
According to the results obtained, the length of hospital stay, use of mechanical ventilation and mortality were lower in hospitalized patients with COVID-19 pneumonia during the second wave, as compared to the first. All despite the fact that patients in the second wave were older and their characteristics were associated with a higher risk for developing severe COVID-19 (lower SaO2, PaO2/FiO2 and SaO2/FiO2 ratios).5 These results persisted after adjustment for variables of severity (DALSH score).4
Previous studies with a different design also show that mortality decreased over time.6,7 This cannot be attributed to demographic changes or variations in disease severity at presentation. Thus, whereas COVID-19 was approached as other severe respiratory diseases during the first wave, during the second wave the disease was managed based on the clinical experience acquired. As a result, clinicians started to use new drugs, prevailingly remdesivir and corticosteroids. Remdesivir had demonstrated its effectiveness in reducing time to recovery in hospitalized adults with Covid-19 and improving lower respiratory tract infection, although survival did not seem to improve with this drug.8 Corticosteroids proved a benefit on survival in patients with respiratory insufficiency9 and their use increased in the second wave. New practices (prone position)10 were also incorporated in the second wave. In addition, during the first wave it was observed that clinical outcomes improved with the use of assisted ventilation or high-flow nasal cannula at the early stages of the disease, so they were more frequently used during the second wave.
The strengths of the study lie in that it is the only hospital of the Health District (450,000 population) where COVID-19 patients are hospitalized, and all associated clinical data are available on electronic medical records. The major limitation of this study is that it only includes patients from a single healthcare area.
Although COVID-19 may progress to severe disease in high-risk patients and patients of the second wave were older and respiratory distress was more frequent, health indicators improved in the second wave of the pandemic.
Authors’ ContributionsConception of the study: Francisco Gude, Luis Valdés.
Study design: Nuria Rodríguez-Núñez, Francisco Gude, Luis Valdés.
Data collection: Nuria Rodríguez-Núñez, Adriana Lama, Carlos Rábade, Alfonso Varela, Romina Abelleira, Ana Casal, Vanessa Riveiro, Manuel Taboada.
Data analysis: Francisco Gude.
Drafting the manuscript: All authors helped to revise the draft of the manuscript.
Editing and approval of the manuscript: All authors.
FundingInstituto de Salud Carlos III, Spain, Grant/Award Number: COV20/00404; Ministry of Economy and Competitiveness (SPAIN) and the European Regional Development Fund (FEDER).
Funding source had no involvement in study design, in the collection, analysis, and interpretation of data, in the writing of the report, and in the decision to submit the paper for publication.
Conflict of InterestWe declare no conflicts of interest associated with this publication. This project was funded by the Carlos III Health Institute, Spain, Grant/Award Number: COV20/00404; Ministry of Economy and Competitiveness (SPAIN) and the European Regional Development Fund (FEDER). This funding source did not have a role in the design of the study, analysis, interpretation of results, or decision to submit the manuscript for publication.


