
Small airway dysfunction (SAD) caused by smoking contributes to the early onset of airflow limitation (AFL), although its impact on patients’ perception of health is largely unknown. We aimed to evaluate the frequency of SAD in active smokers without AFL, and to compare health-related quality of life (HRQoL) of non-smokers, smokers without SAD, smokers with SAD, and smokers with AFL.
MethodsA total of 53 active smokers without AFL, 20 smokers with AFL, and 20 non-smokers completed the SF-36 and EuroQoL questionnaires and performed impulse oscillometry and spirometry. Pulmonary parenchymal attenuation was determined in inspiration and expiration. SAD was determined to exist when resistance at 5Hz (R5), the difference between R5 and R20, and reactance area (AX) exceeded the upper limit of normal.
ResultsIn total, 35.8% of smokers without AFL had SAD. No differences were detected in spirometric parameters or pulmonary attenuation between smokers with or without AFL and non-smokers. However, smokers with SAD had worse scores on HRQoL questionnaires than smokers without SAD or non-smokers, and scores compared to smokers with AFL were intermediate. R5 and X5 were identified as independent determinants of HRQoL in smokers without AFL.
ConclusionsSAD is common in smokers without AFL, affecting one third of this population, and independently affecting their perception of health.
La disfunción de las pequeñas vías aéreas (DPV) inducida por el tabaco contribuye precozmente a la patogenia de la limitación al flujo aéreo (LFA), aunque resulta poco conocida su repercusión en la percepción de salud. Se pretende evaluar la frecuencia de DPV en fumadores activos sin LFA y comparar la calidad de vida relacionada con la salud (CVRS) de no fumadores, fumadores sin DPV, fumadores con DPV y fumadores con LFA.
MétodosEn 53 fumadores activos sin LFA, 20 fumadores con LFA y 20 no fumadores, se utilizaron los cuestionarios SF-36 y EuroQoL y se realizó oscilometría de impulsos, espirometría y determinación de las densidades de atenuación del parénquima pulmonar en inspiración y espiración máximas. Se consideró que existía DPV cuando la resistencia a 5Hz (R5), la diferencia R5-R20 y el área de reactancia (AX) excedían su límite superior de la normalidad.
ResultadosEl 35.8% de los fumadores sin LFA tenía DPV. No se detectaron diferencias en los parámetros espirométricos ni la atenuación pulmonar entre los fumadores con o sin DPV y los no fumadores. Sin embargo, los fumadores con DPV presentaban una peor puntuación en los cuestionarios de CVRS que los fumadores sin DPV o los no fumadores, e intermedia a los fumadores con LFA. R5 y X5 fueron identificados como determinantes independientes de la CVRS en los fumadores sin LFA.
ConclusionesLa DPV es frecuente en fumadores sin LFA, afectando a un tercio de los mismos, y condicionando de forma independiente su percepción de salud.
Smoking is by far the most common cause of chronic obstructive pulmonary disease (COPD) in the world, and is responsible for more than 80%–90% of new cases.1 COPD has conventionally been attributed to chronic inflammation triggered by tobacco smoke, which releases proteolytic substances and free radicals, causing airway damage and breakdown of the pulmonary parenchyma, leading to airflow limitation (AFL) and significant symptoms.2 Nevertheless, early involvement of the small airways has been known for several decades to play an important role in the pathogenesis of this disease.3,4
Various studies have used computed tomography (CT) to investigate smokers who have not yet developed AFL.5,6 However, this technique does not directly evaluate the small airways, and instead analyzes the walls of the larger bronchioles and the probable impact of small airway dysfunction (SAD) on attenuation of the lung parenchyma.7 The forced oscillation technique (FOT) or impulse oscillometry system (IOS), on the other hand, provides a specific, systemized, functional assessment of the small airways that shows a pattern of involvement characteristic of SAD.8,9
In recent years, smokers without AFL have been known to constitute a heterogeneous group with various symptomatic manifestations that impact on their health-related quality of life (HRQOL).10,11 However, scant information is available on the functional or morphological parameters that might differentiate these individuals and, in some way, contribute to their symptoms. Given its potential pathogenic importance, it is interesting to speculate that SAD might be an early step in the development of AFL12 and could, as such, demonstrate incipient effects on quality of life.
We hypothesize, therefore, that smokers without AFL who have developed SAD have a poorer quality of life. Our main objective was to compare the quality of life of smokers without AFL but with evidence of SAD on IOS, with that of non-smokers, smokers without SAD, and smokers with AFL consistent with COPD. As secondary objectives, we also aimed to determine the frequency of SAD in smokers without AFL and to compare lung attenuation densities between the 4 groups of subjects.
MethodsStudy SubjectsWe consecutively selected 53 active smokers without evidence of AFL and 20 active smokers with AFL consistent with COPD from among the patients attending the smoking cessation clinic of our hospital. Subjects from both groups had to be 40–70 years old, and have a mean accumulated tobacco consumption of at least 20 pack-years. As a control group, we selected 20 subjects aged 40–70 years from the reference group of our laboratory. The study was approved by the Research Ethics Committee of the Hospital Universitario La Paz (PI-1261) and all participants signed informed consent forms.
Appendix B supplementary material provides more detailed information on the selection criteria and procedures performed.
DeterminationsHRQOL was evaluated by self-administration of the Spanish version of the Short Form 36 Health Survey (SF-36) and European Quality of Life-5 Dimensions (EQ-5D) generic questionnaires, and smokers completed the Fagerström and Glover-Nilsson tests.
A high-resolution volumetric CT scan of the chest was performed in maximum inspiratory and expiratory phases, using equipment with a 16-slice configuration (Somatom Emotion 16, Siemens Medical Solutions, Erlangen, Germany). Semi-automatic analysis software (Syngo InSpace4D, Siemens) was used to determine mean lung density (MLD), percentage of voxels with attenuation values below −950 Hounsfield units (HU) (LAV) or between −1000 and −951HU (subrange 1), and attenuation thresholds corresponding to the 15th percentile (P15), in both inspiratory and expiratory phases.13
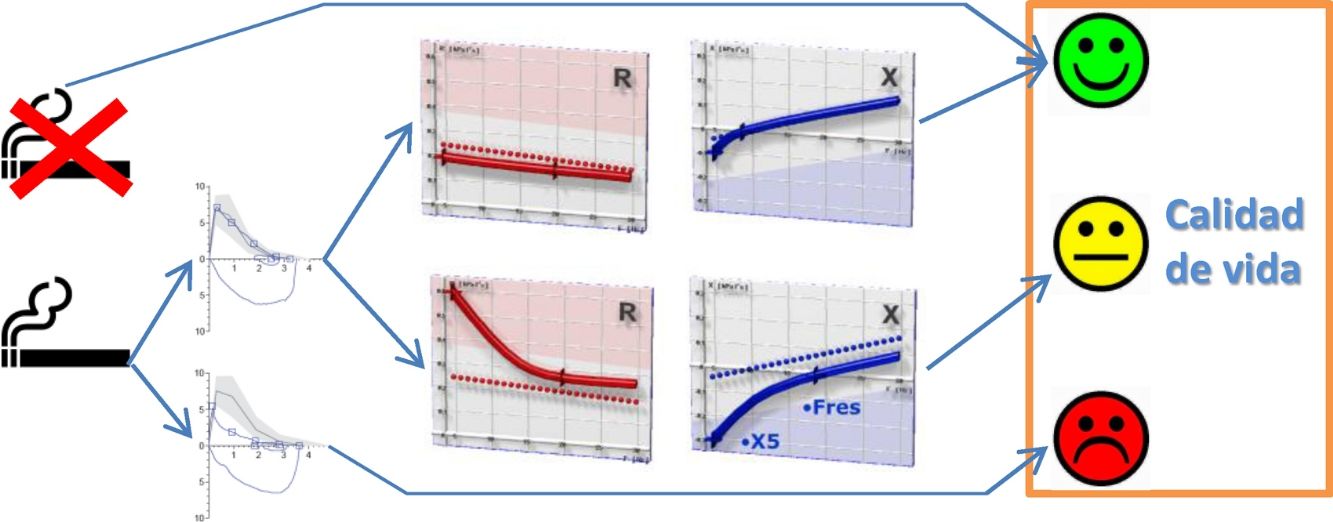
All pulmonary function tests were carried out by a single researcher (CGQ) using the MasterScreen system (Viasys Healthcare, Würzburg, Germany). IOS was performed according to the current recommendations.8 Participants, wearing a nose clip and sitting with their head in a neutral position, were asked to breathe normally (tidal volume) with their lips sealed around the mouthpiece while firmly squeezing their cheeks with their hands. At least 3 acceptable recordings were obtained (coherence values at 5 and 20Hz≥0.7 and 0.9, respectively) with a duration of 30s: the average of 3 acceptable and repeatable tests was used for the analysis (variability<10%). Resistance values at 5 and 20Hz (R5 and R20) were used to indicate total and proximal airway resistance, while a drop in resistance from 5 to 20Hz (R5–R20) was considered an indicator of peripheral airway resistance. Reactance at 5Hz (X5) and the low-frequency reactance area index (AX) were also determined as indicators of peripheral airway function. Data obtained were interpreted according to the Oostveen European reference values.14 Pre- and post-bronchodilator spirometry were performed immediately afterwards, according to current guidelines15 using the GLI reference values.16
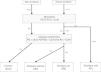
Patient ClassificationAFL was defined as consistent with COPD when post-bronchodilator FEV1/FVC was below the lower limit of normal.17 SAD was defined by the presence of R5, R5–R20 and AX above the upper limit of normal.18 Individuals without AFL and SAD were taken as control subjects. Based on these criteria, study subjects were divided into 4 mutually exclusive groups: non-smoker controls, smokers without SAD, smokers with SAD, and smokers with AFL (Fig. 1). Finally, patients with AFL were classified by severity, risk group, and COPD phenotype, according to current recommendations.19,20
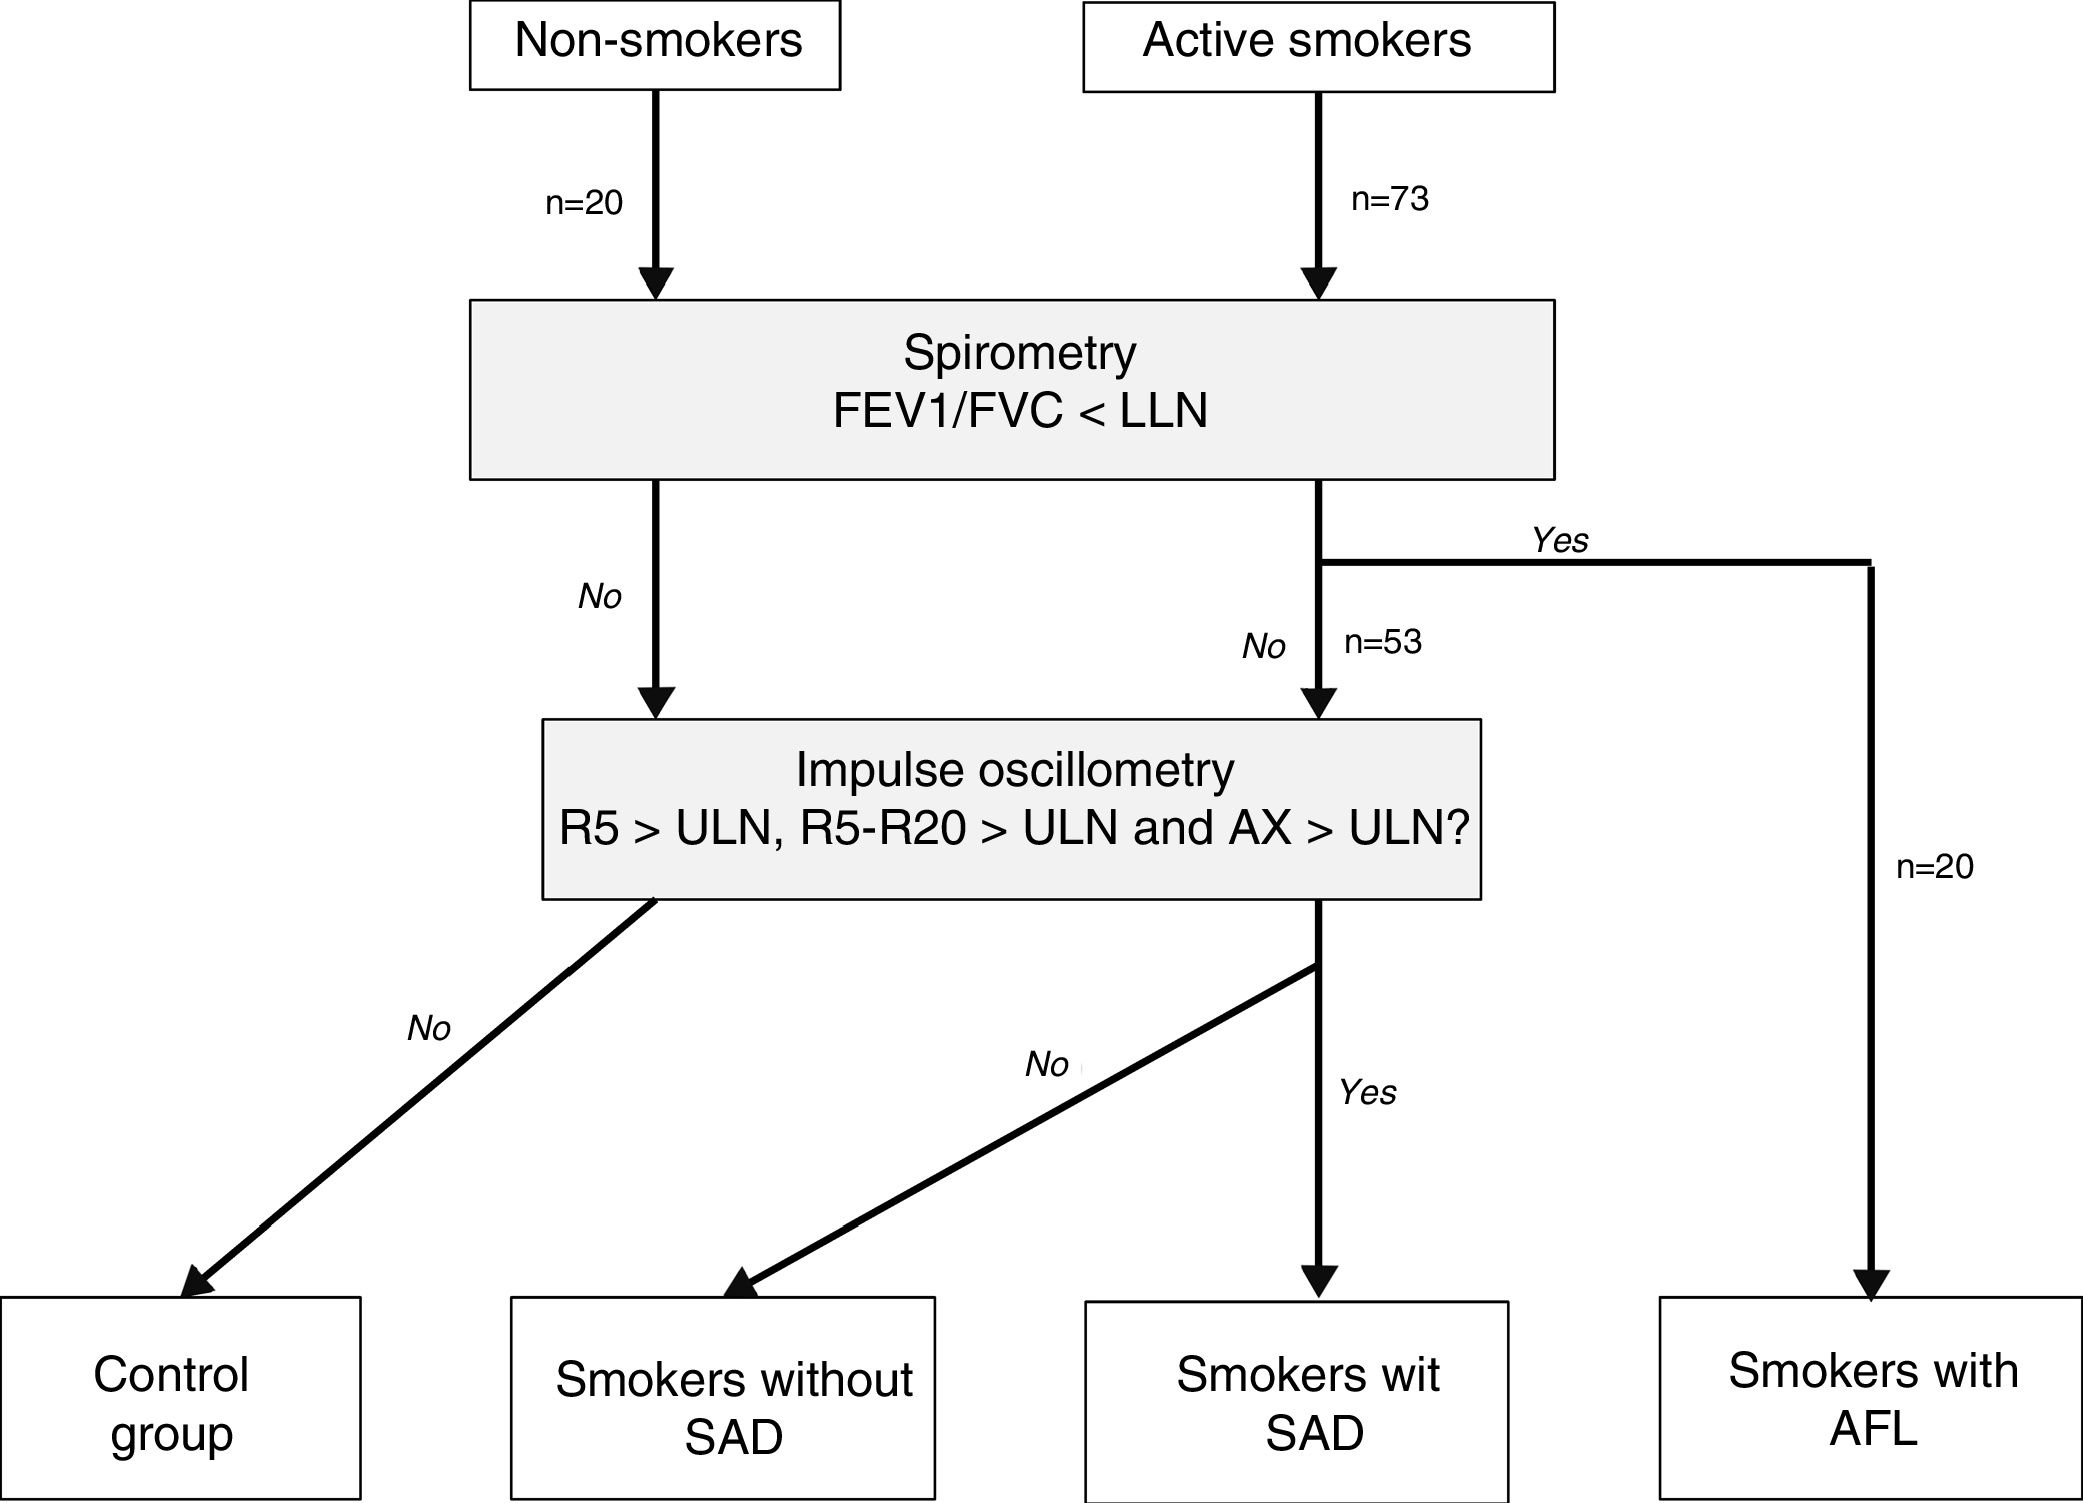
Flow chart of study patients. AFL: airflow limitation; AX: low frequency reactance area; FEV1: forced expiratory volume in 1 second; FVC: forced vital capacity; LLN: lower limit of normality; ULN: upper limit of normal; R5: respiratory resistance at 5Hz; R20: respiratory resistance at 20Hz; SAD: small airway dysfunction.
The sample size was estimated on the basis of a physical component score on the SF-36 questionnaire of 49.0±4.7 obtained in a pilot study in smokers without AFL (unpublished data). Twenty subjects per group would be required to detect a difference of at least 5 units in a 2-tailed comparison with an alpha risk of 0.05 and a beta risk of 0.10. According to a previous study that reported a prevalence of SAD of 26.3% among smokers or former smokers with ischemic heart disease, rising to 38% in active smokers,21 53 subjects would be needed to obtain 2 comparable subgroups of smokers without AFL according to the presence or absence of SAD.
The data are presented as number (percentage) or mean±standard deviation, according to their characteristics, after using the Shapiro–Wilk test to check for normal distribution. For comparisons between groups, we used the Chi-squared test and analysis of variance with multiple post hoc comparisons using the Bonferroni test. The relationship between variables was evaluated using Pearson's correlation analysis. Variables that showed a significant relationship were included in a multiple linear regression analysis using the forward stepwise method. A p value of less than 0.05 was considered significant, and all analyses were performed using SPSS 15.0 software (SPSS Inc., Chicago, IL, USA).
ResultsAccording to the established criteria, we recruited 20 non-smokers, 53 active smokers without AFL, and 20 active smokers with AFL consistent with COPD (Table S1, supplementary material). The three groups were homogeneous in terms of sex, age, height, weight, and body mass index (Table S2, supplementary material).
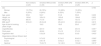
In the group of smokers without AFL, 19 subjects had SAD, i.e., a rate of 35.8% (95% CI: 22.9–48.81%). None of the non-smokers showed SAD, so they were all considered control subjects. Table 1 shows the anthropometric characteristics and tobacco consumption of the 4 final groups. The anthropometric parameters were similar, and no differences were observed in the characteristics of tobacco consumption, nicotine dependence, or psychological, social or gestural dependence among smokers.
Anthropometric Characteristics and Smoking Habit of the Study Groups.
| Non-smokers (n=20) | Smokers Without SAD (n=34) | Smokers With SAD (n=19) | Smokers With AFL (n=20) | p | |
|---|---|---|---|---|---|
| Sex | 0.793 | ||||
| Women | 15 (75%) | 26 (76%) | 13 (68%) | 13 (65%) | |
| Men | 5 (25%) | 8 (24%) | 6 (32%) | 7 (35%) | |
| Age, years | 55±6 | 53±7 | 51±6 | 53±6 | 0.229 |
| Height, cm | 163±6 | 165±10 | 163±8 | 164±8 | 0.932 |
| Weight, kg | 69±10 | 71±16 | 68±11 | 70±13 | 0.717 |
| BMI, kg/m2 | 25.6±3.1 | 26.3±4.8 | 25.4±3.9 | 26.3±4.2 | 0.815 |
| Age at start of smoking, years of age | – | 18±3 | 18±5 | 20±3 | 0.267* |
| Cigarettes/day | – | 22±10 | 18±6 | 23±12 | 0.091* |
| Pack-years | – | 42±24 | 31±12 | 37±16 | 0.063* |
| Fagerström test | – | 5.5±2.6 | 4.6±2.6 | 5.0±0 | 0.433* |
| Dependence (Glover-Nilsson test) | |||||
| Psychological | – | 9.7±3.2 | 8.7±4.0 | 8.8±3.9 | 0.595* |
| Social | – | 3.6±1.8 | 3.9±2.2 | 3.4±2.1 | 0.695* |
| Gestural | – | 15.2±7.5 | 14.1±8.9 | 13.6±8.1 | 0.815* |
SAD: small airway dysfunction; BMI, body mass index; ALF: airflow limitation.
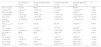
Apart from obvious differences in the forced oscillation variables used to define the groups, the only spirometric parameters that were lower in smokers with SAD compared with smokers without SAD were FEF25% and FEF25–75% (Table 2).
Functional Characteristics of Study Groups.
| Non-smokers (n=20) | Smokers Without SAD (n=34) | Smokers With SAD (n=19) | Smokers With AFL (n=20) | p | |
|---|---|---|---|---|---|
| FVC, % pred. | 112±10 | 96±27 | 85±29b | 82±4b,f | 0.002 |
| z-Score FVC | 0.82±0.70 | −0.33±2.02 | −1.12±2.1b | −1.28±0.37b,f | 0.002 |
| FEV1, % pred. | 109±11 | 94±26 | 81±26a | 43±9a,e,g | <0.001 |
| z-Score FEV1 | 0.70±0.82 | −0.45±1.99 | −1.34±1.99a | −3.83±0.56a,e,i | <0.001 |
| FEV1/FVC | 0.78±0.04 | 0.78±0.05 | 0.76±0.03 | 0.42±0.10a,d,g | <0.001 |
| z-Score FEV1/FVC | −0.32±0.66 | −0.34±0.86 | −0.56±0.53 | −4.13±0,72a,d,g | <0.001 |
| FEF25–75%, % pred. | 81±15 | 83±33 | 58±34c,f | 42±23a,e,h | 0.005 |
| R5, % pred. | 87±15 | 103±24 | 157±37a,d | 162±38a,e | <0.001 |
| z-Score R5 | −0.36±0.40 | 0.04±0.65 | 2.35±0.89a,d | 2.41±0.87a,e | <0.001 |
| R5–R20, % pred. | 86±6 | 94±4 | 186±12a,d | 179±13a,d | 0.003 |
| X5, % pred. | 106±6 | 110±7 | 164±11a,d | 182±23a,d | <0.001 |
| z-Score X5 | 1.13±0.12 | 1.27±0.32 | 2.16±0.43a,d | 2.45±0.42a,d | <0.001 |
| AX, % pred. | 70±9 | 69±8 | 523±81a,d | 548±145a,d | <0.001 |
| z-Score AX | −0.68±0.43 | −0.94±0.37 | 4.46±1.52a,d | 4.53±1.67a,d | <0.001 |
AX: low frequency reactance area; SAD: small airway dysfunction; FEF25–75%: Forced end-inspiratory flow; FEV1: forced expiratory volume in 1 second; FVC: forced vital capacity; AFL: airflow limitation; R5: respiratory resistance at 5Hz; R20: respiratory resistance at 20Hz; X5: distal capacitive reactance at 5Hz.
Statistical comparisons:
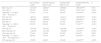
The morphological involvement of lung parenchyma showed a lower attenuation density in smokers with AFL compared to the other 3 groups (Table 3). In both inspiratory and expiratory phases, COPD patients showed a lower mean lung density, higher percentages of low attenuation volume, and attenuation volumes of between −1000 to −951HU and between −950 to −901HU, and a lower P15. However, no differences were detected in attenuation densities between smokers with or without SAD. Furthermore, no correlation was found between the measurements of lung attenuation and forced oscillation variables between the 2 groups of smokers without AFL.
Comparison of Lung Attenuation Parameters Between Study Groups.
| Non-smokers (n=20) | Smokers without SAD (n=34) | Smokers With SAD (n=19) | Smokers With AFL (n=20) | p | |
|---|---|---|---|---|---|
| MLD insp, HU | −831±25 | −826±27 | −839±20 | −856±30b,e,g | 0.001 |
| LAV insp, % | 2.2±2.5 | 1.8±2.0 | 3.0±2.9 | 13.8±11.3a,d,f | <0.001 |
| Subrange 1 (−1.000 to −951HU) insp, % | 2.1±2.3 | 1.7±1.9 | 2.8±2.8 | 12.4±9.6a,d,f | <0.001 |
| P15 insp, HU | −907±21 | −902±21 | −914±17 | −939±28b,e,h | <0.001 |
| MLD exp, HU | −692±68 | −685±66 | −703±72 | −805±50a,d,f | <0.001 |
| LAV exp, % | 0.2±0.4 | 0.2±0.2 | 0.3±0.6 | 8.3±8,1a,d,f | <0.001 |
| Subrange 1 (−1.000 to −951HU) exp, % | 0.2±0.3 | 0.2±0.2 | 0.3±0.5 | 7.1±6,7a,d,f | <0.001 |
| P15 exp, HU | −817±50 | −821±51 | −827±48 | −910±48b,d,f | <0.001 |
| MLD insp-exp, HU | −132±43 | −141±55 | −136±68 | −51±40a,d,f | <0.001 |
| LAV insp-exp, HU | 3.7±4.3 | 1.6±2.0 | 2.7±2.8 | 5.5±4.5e | 0.002 |
| Subrange 1 (−1.000 to −951HU) insp-exp, % | 3.8±4.0 | 1.5±1.9 | 2.6±2.7 | 5.3±4.2e,g | 0.001 |
| P15 insp-exp, HU | −70±59 | −92±41 | −87±45 | −29±28c,d,g | <0.001 |
SAD: small airway dysfunction; exp: expiration; insp: inspiration; LAV: low attenuation volume; AFL: airflow limitation; MLD: mean pulmonary density; HU Hounsfield units; P: percentile.
Statistical comparisons:
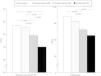
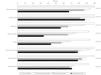
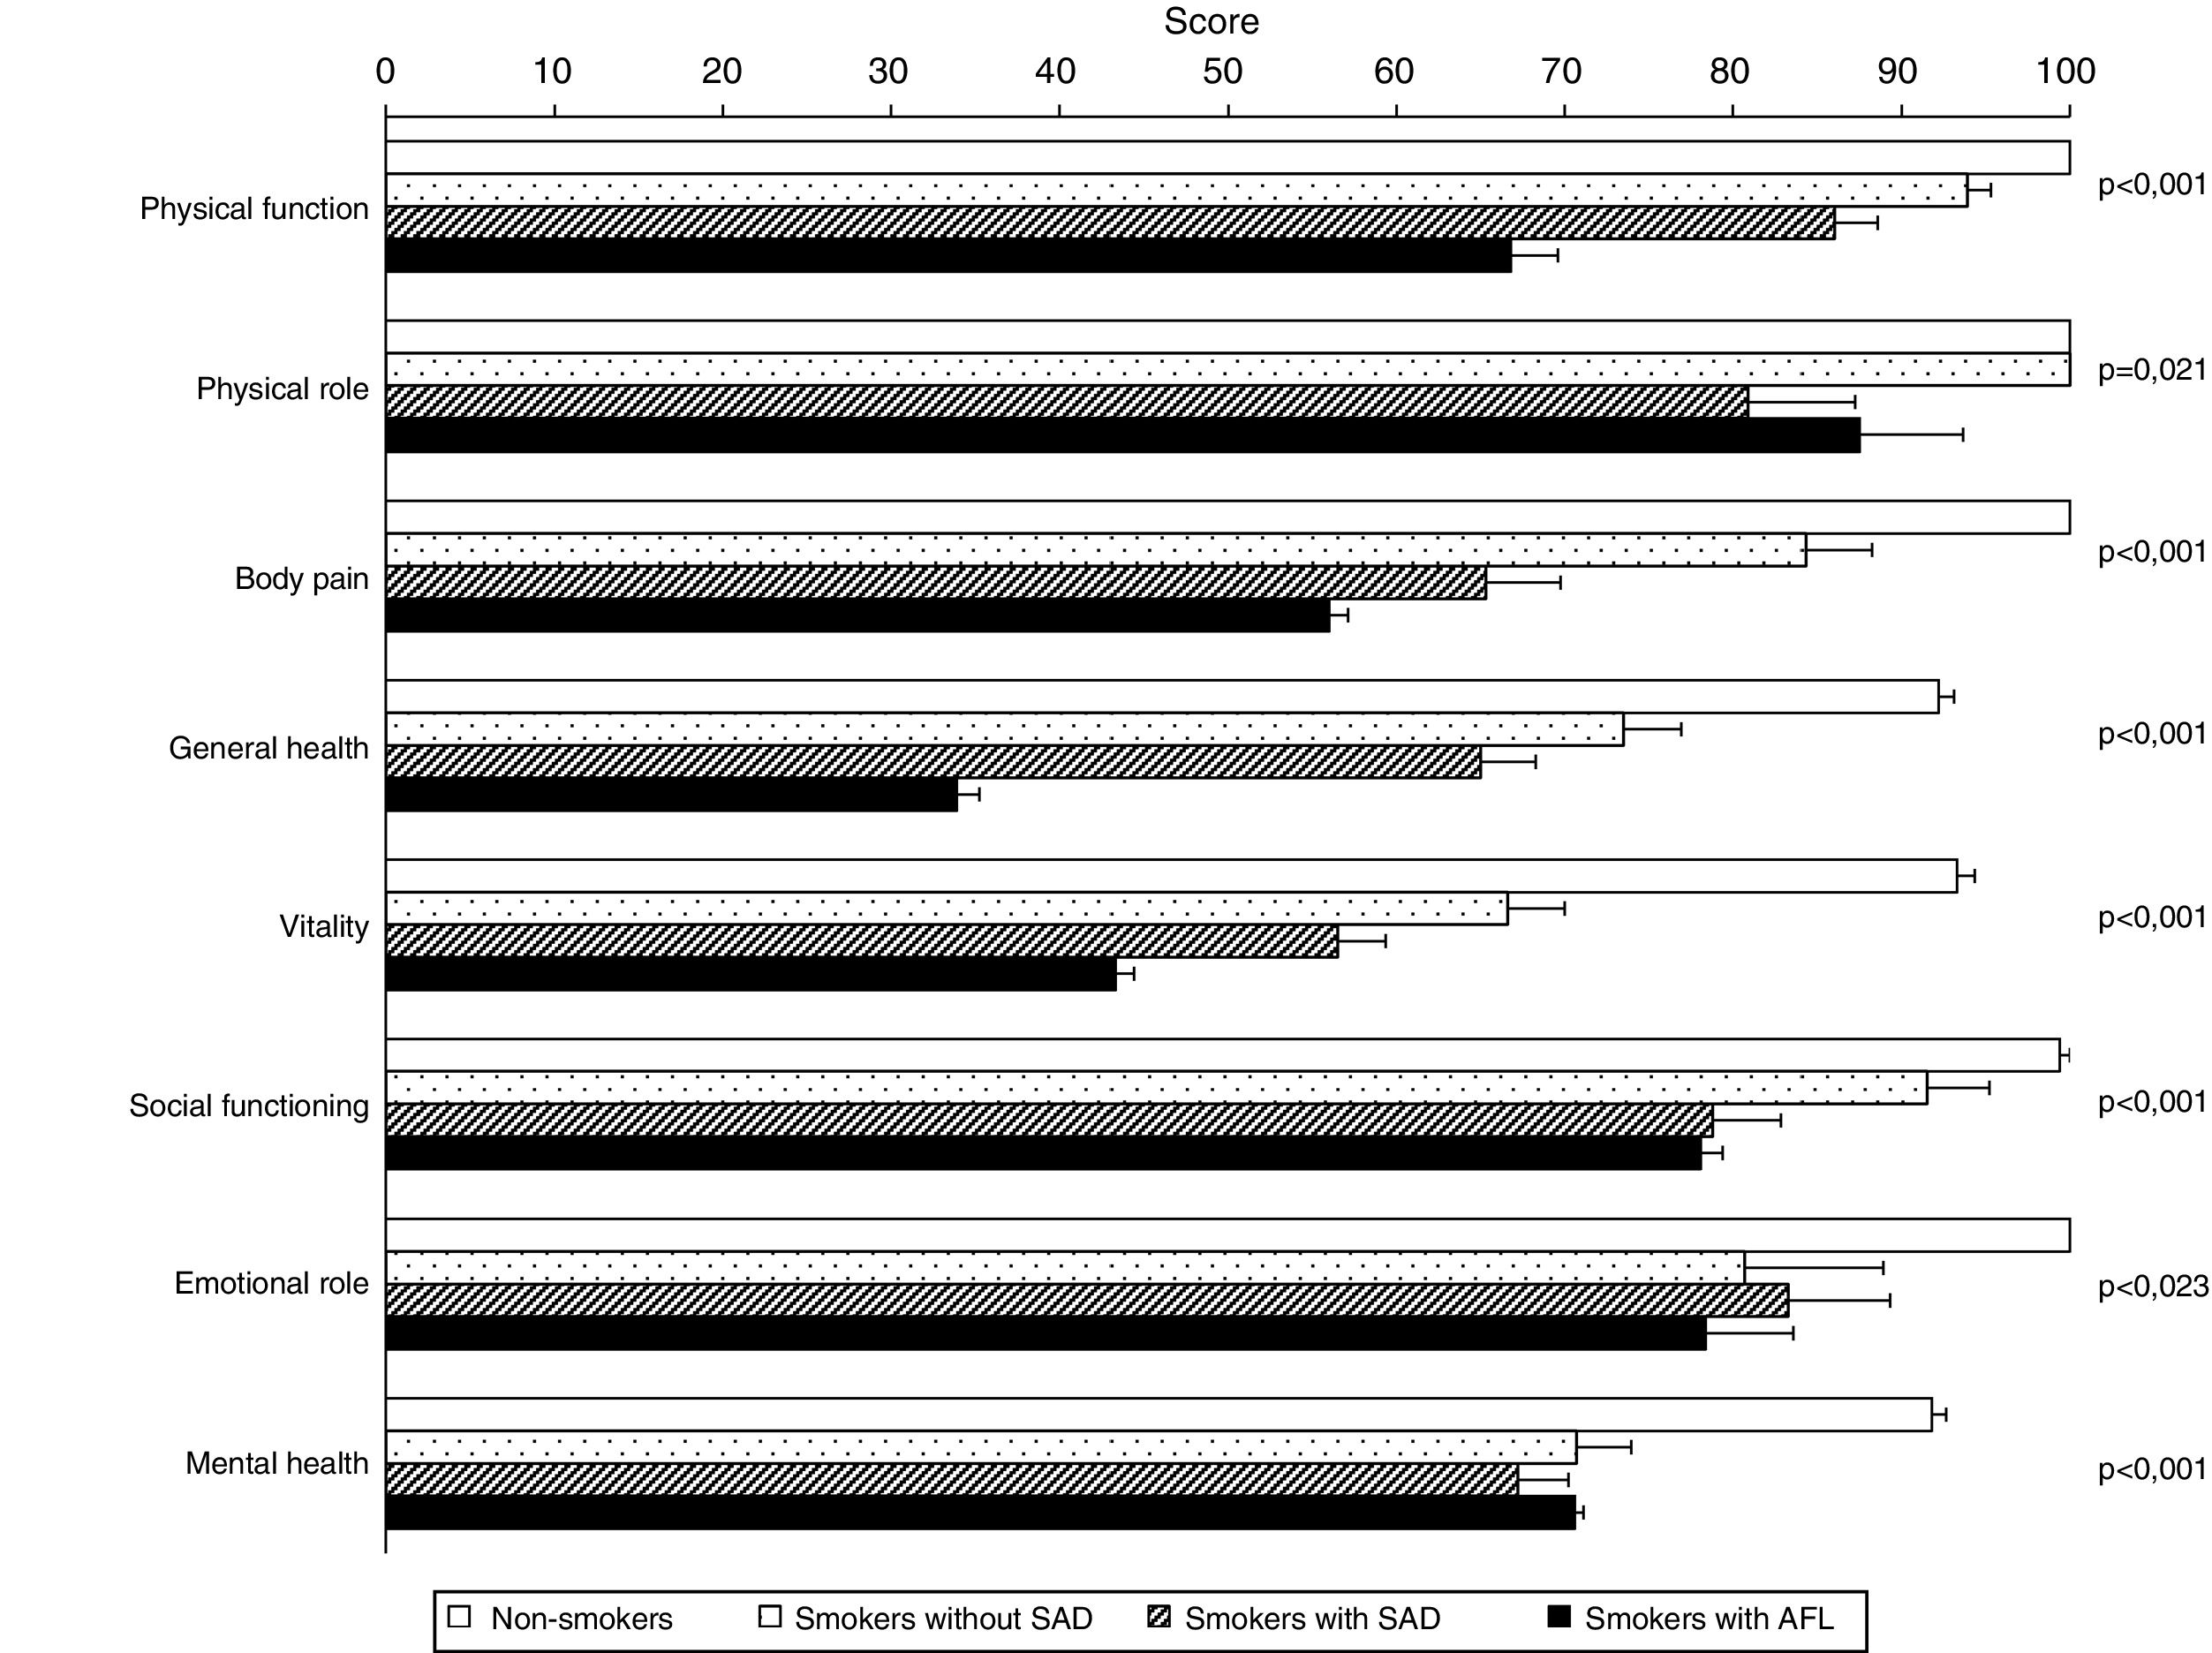
Table 4 shows a comparison of HRQOL between the 4 study groups. In addition to the predictable differences between smokers with AFL and the other groups, it is interesting to note that smokers with SAD scored worse in the physical and mental components of the SF-36 questionnaire and on the EQ-5D visual analog scale (VAS), compared to both non-smoker controls and smokers without SAD, evidence of an intermediate situation of deterioration in quality of life between these subjects and smokers with COPD (Fig. 2). The analysis of the different domains of the SF-36 questionnaire shows a similar behavior, mainly affecting the domains related to the physical component (Table 4 and Fig. 3).
Comparison of Health-related Quality of Life Between Study Groups.
| Questionnaires and Domains | Non-smokers (n=20) | Smokers Without SAD (n=34) | Smokers With SAD (n=19) | Smokers With AFL (n=20) | p |
|---|---|---|---|---|---|
| SF-36 | |||||
| Physical component scale | 57.0±0.5 | 55.3±3.9 | 49.0±7.4a,e | 40.1±4.7a,d,g | <0.001 |
| Mental component scale | 57.4±1.2 | 56.7±9.5 | 45.6±10.5a,f | 49.5±2.3c,f | <0.001 |
| Physical function | 100±0 | 93.9±6.1 | 86.0±15.0a | 66.8±12.5a,d,g | <0.001 |
| Physical role | 100±0 | 100±0 | 80.9±36.9 | 87.5±27.5 | 0.021 |
| Body pain | 100±0 | 84.3±17.2 | 65.3±26.1a,e | 56.0±5.0a,d | <0.001 |
| General health | 92.2±4.0 | 73.5±15.0c | 65.0±19.1a,d | 33.9±6.0a,d,g | <0.001 |
| Vitality | 93.3±4.7 | 66.6±14.8a | 56.5±16.7a,f | 43.3±4,9a,d,h | <0.001 |
| Social function | 99.4±2.8 | 91.5±16.1 | 78.8±23.7a,f | 78.1±5.6b | <0.001 |
| Emotional role | 100±0 | 80.7±35.7 | 83.3±35.1 | 78.4±32.0 | 0.023 |
| Mental health | 91.8±3.8 | 70.7±14.2a | 67.2±17.7a | 70.6±2.3a | <0.001 |
| EQ-5D | |||||
| VAS score | 1.000±0 | 0.905±0.145 | 0.817±0.158a | 0.864±0.143b | <0.001 |
| TE score | 1.000±0 | 0.937±0.129 | 0.871±0.160 | 0.829±0.100b | 0.004 |
| Scale | 88±4 | 82±10 | 72±16a,f | 65±8a,d | <0.001 |
AFL: airflow limitation; EQ-5D: European Quality of Life-5 Dimensions; SAD: small airway dysfunction; SF-36: Short Form 36 Health Survey; TE: temporal equivalence; VAS: visual analog scale.
Statistical comparisons:
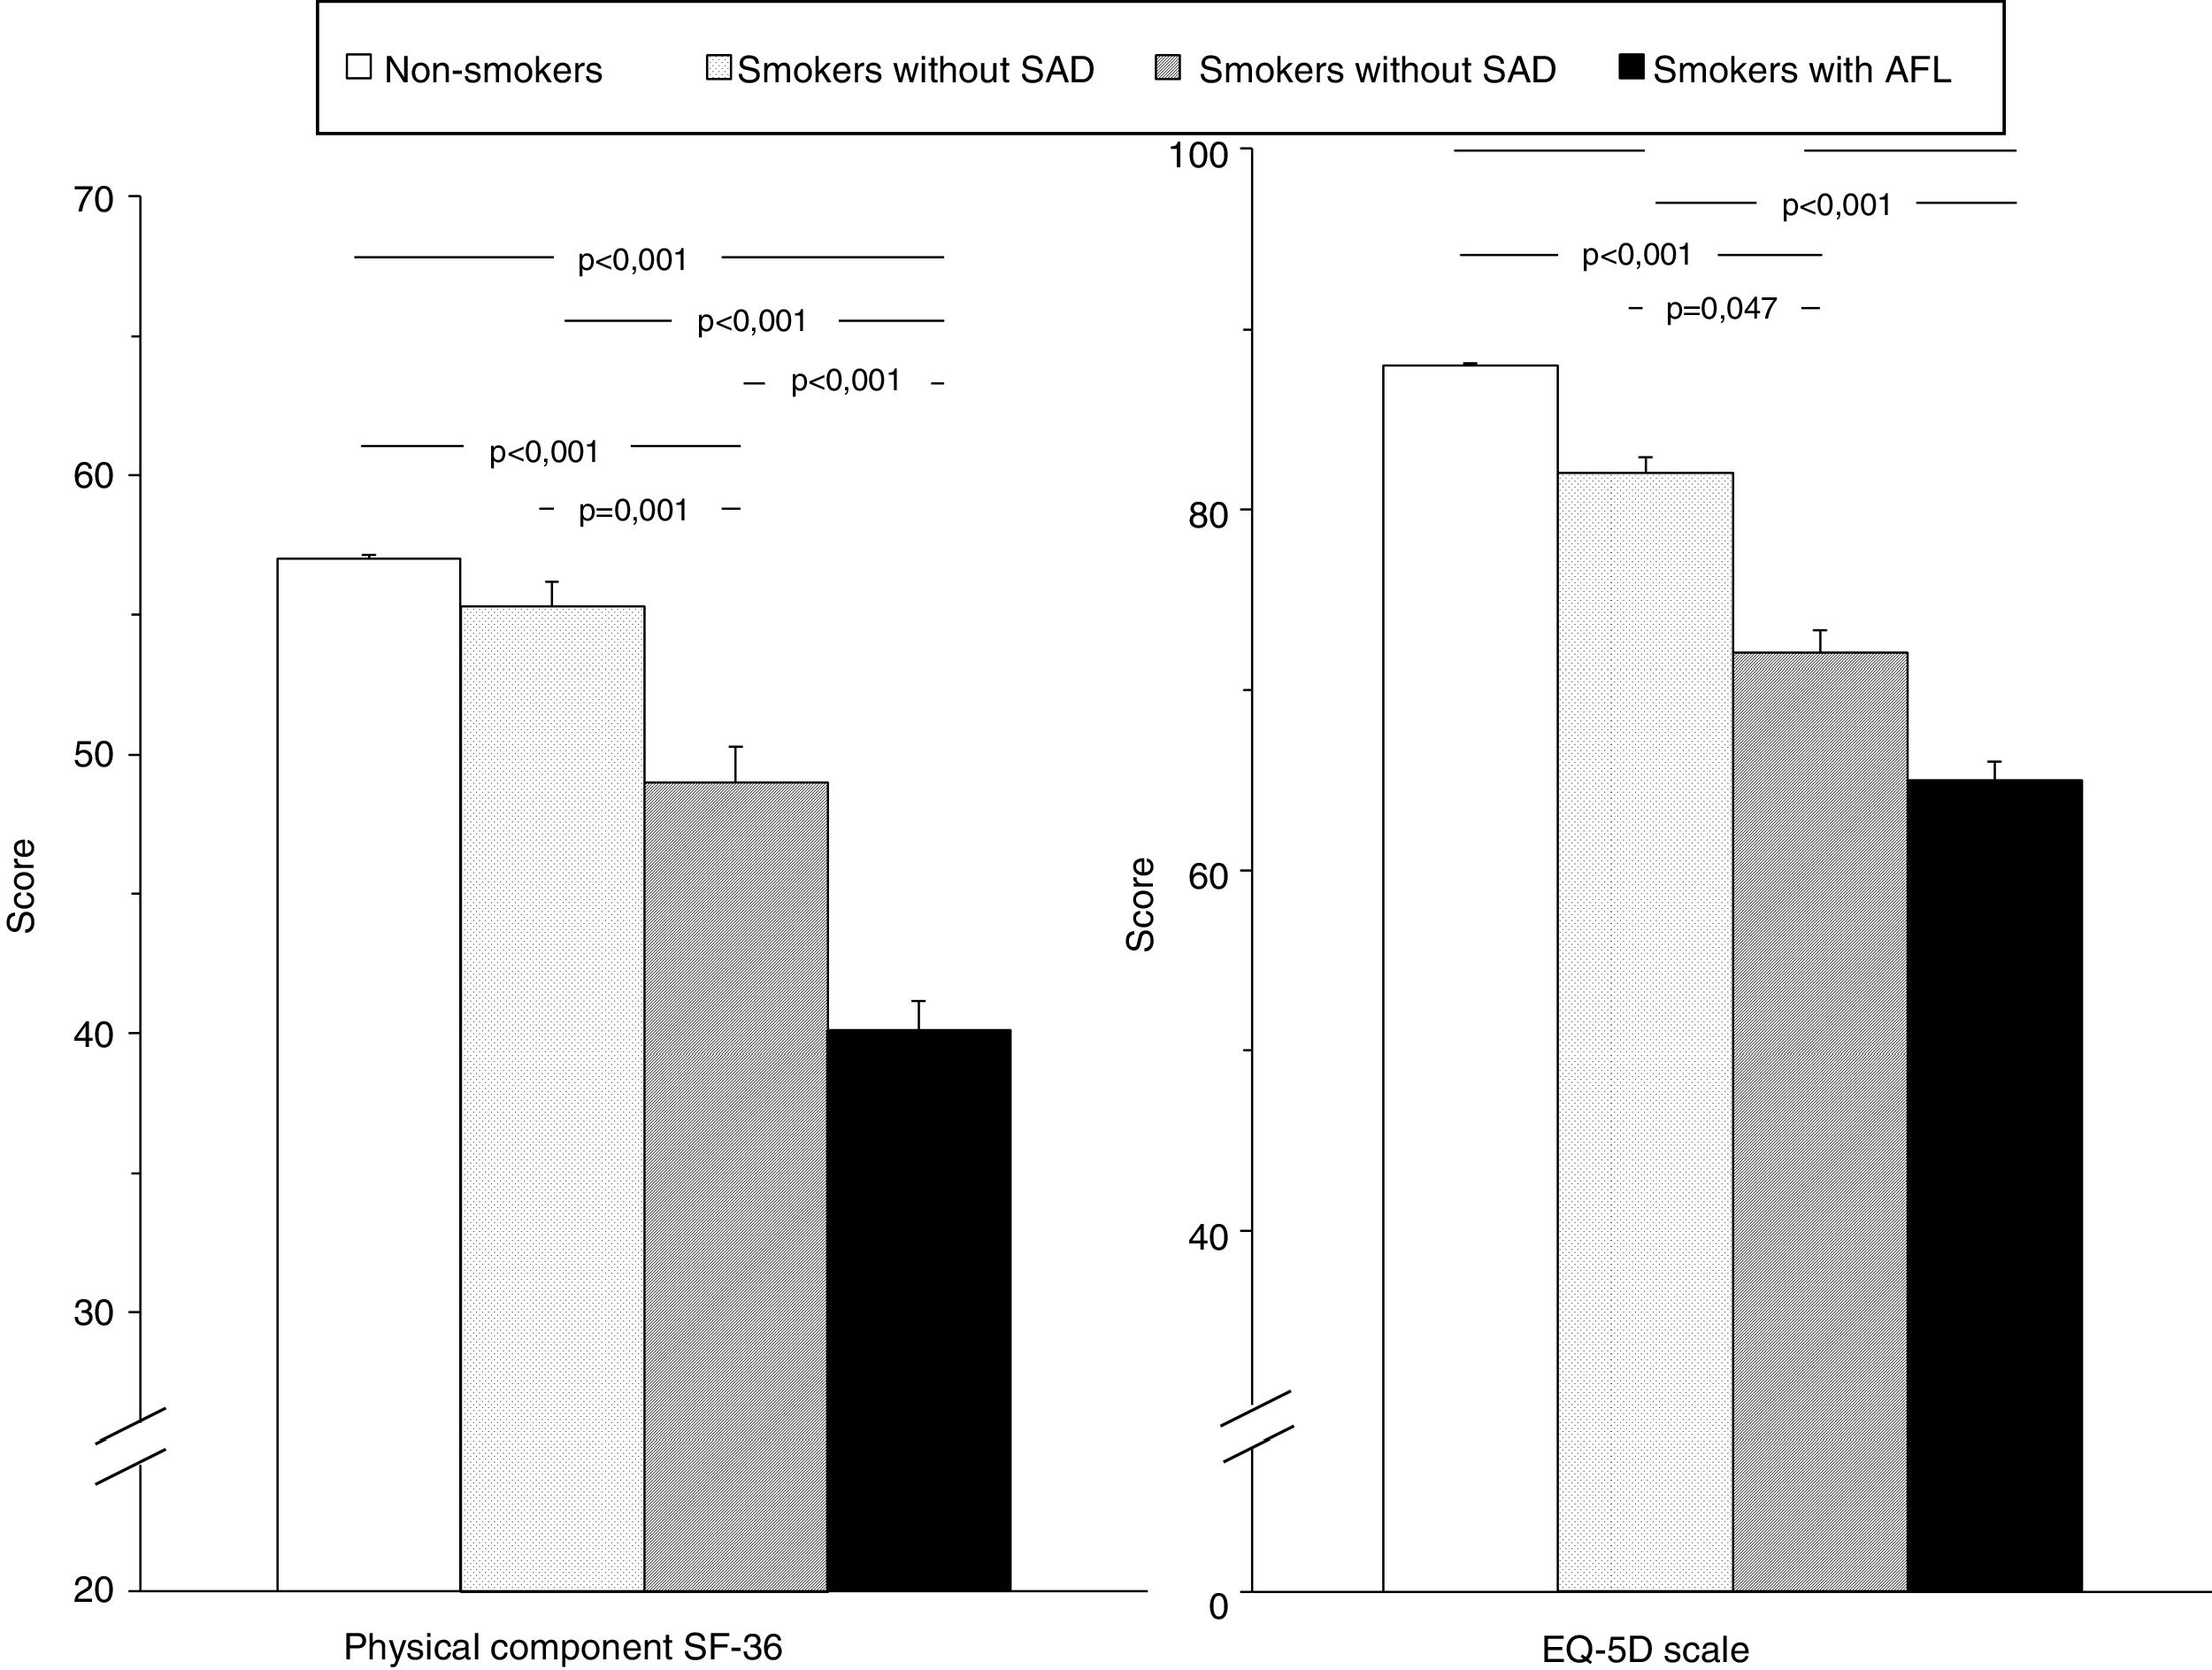
Comparison of global scores for the physical component of the SF-36 questionnaire and the EQ-5D scale in the 4 study groups. Error bars correspond to the standard mean error. AFL: airflow limitation; EQ-5D: European Quality of Life-5 Dimensions; SAD: small airway dysfunction; SF-36: Short Form 36 Health Survey.
In smokers without AFL, both with and without SAD, no correlation was found between HRQOL and anthropometric characteristics, age of onset, intensity of tobacco use, years of cigarette smoking, or Fagerström or Glover-Nilsson scores.
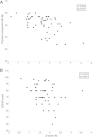
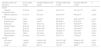
However, the quality of life of these subjects was associated with various functional and morphological parameters (Table 5). Thus, the SF-36 physical component score showed a moderate inversely proportional relationship with R5, R20, X5 and AX and a weak directly proportional relationship with FVC. FEV1, and FEF25–75%, and various measurements of lung attenuation (MLD and P15) in inspiration. The score obtained on the EQ-5D scale was proportionally inversely associated with R5 and X5 (Table 5). Finally, the multiple linear regression models only retained R5 and X5 as independent predictors of the SF-36 questionnaire physical component and the EQ-5D scale, respectively (Fig. 4 and Table 6).
Relationship Between Oscillometric Parameters and Health-related Quality of Life in Smokers Without Airflow Limitation.
| Parameter | Physical Component Scale | EQ-5D Scale | ||
|---|---|---|---|---|
| Correlation Coefficient (95% CI) | p | Correlation Coefficient (95% CI) | p | |
| FVC, % pred. | 0.300 (0.032 to 0.528) | 0.029 | – | – |
| z-Score FVC | 0.298 (0.030 to 0.526) | 0.030 | – | – |
| FEV1, % pred. | 0.320 (0.054 to 0.543) | 0.020 | – | – |
| z-Score FEV1 | 0.305 (0.038 to 0.531) | 0.026 | – | – |
| FEF25–75%, % pred. | 0.328 (0.063 to 0.550) | 0.017 | – | – |
| R5, % pred. | −0.448 (−0.641 to −0.202) | 0.001 | −0.276 (−0.508 to −0.006) | 0.046 |
| z-Score R5 | −0.502 (−0.680 to −0.268) | <0.001 | −0.297 (−0.525 to −0.029) | 0.031 |
| R20, % pred. | −0.521 (−0.694 to −0.292) | <0.001 | – | – |
| z-Score R20 | −0.468 (−0.655 to −0.226) | <0.001 | – | – |
| X5, % pred. | −0.509 (−0.685 to −0.277) | <0.001 | −0.311 (−0.536 to −0.044) | 0.024 |
| z-Score X5 | −0.515 (−0.689 to −0.284) | <0.001 | −0.314 (−0.539 to −0.048) | 0.022 |
| AX, % pred. | −0.339 (−0.558 to −0.076) | 0.015 | – | – |
| z-Score AX | −0.338 (−0.557 to −0.075) | 0.015 | – | – |
| MLD insp, HU | 0.298 (0.030 to 0.526) | 0.030 | – | – |
| P15 insp, HU | 0.298 (0.030 to 0.526) | 0.031 | – | – |
95% CI: 95% confidence interval; AX: low frequency reactance area; FEF25–75%: forced end-inspiratory flow; FEV1: forced expiratory volume in 1 second; FVC: forced vital capacity; insp: inspiration; HU: Hounsfield units; MLD: mean lung density; P: percentile; R5: respiratory resistance at 5Hz; R20: respiratory resistance at 20Hz; X5: distal capacitive reactance at 5Hz.
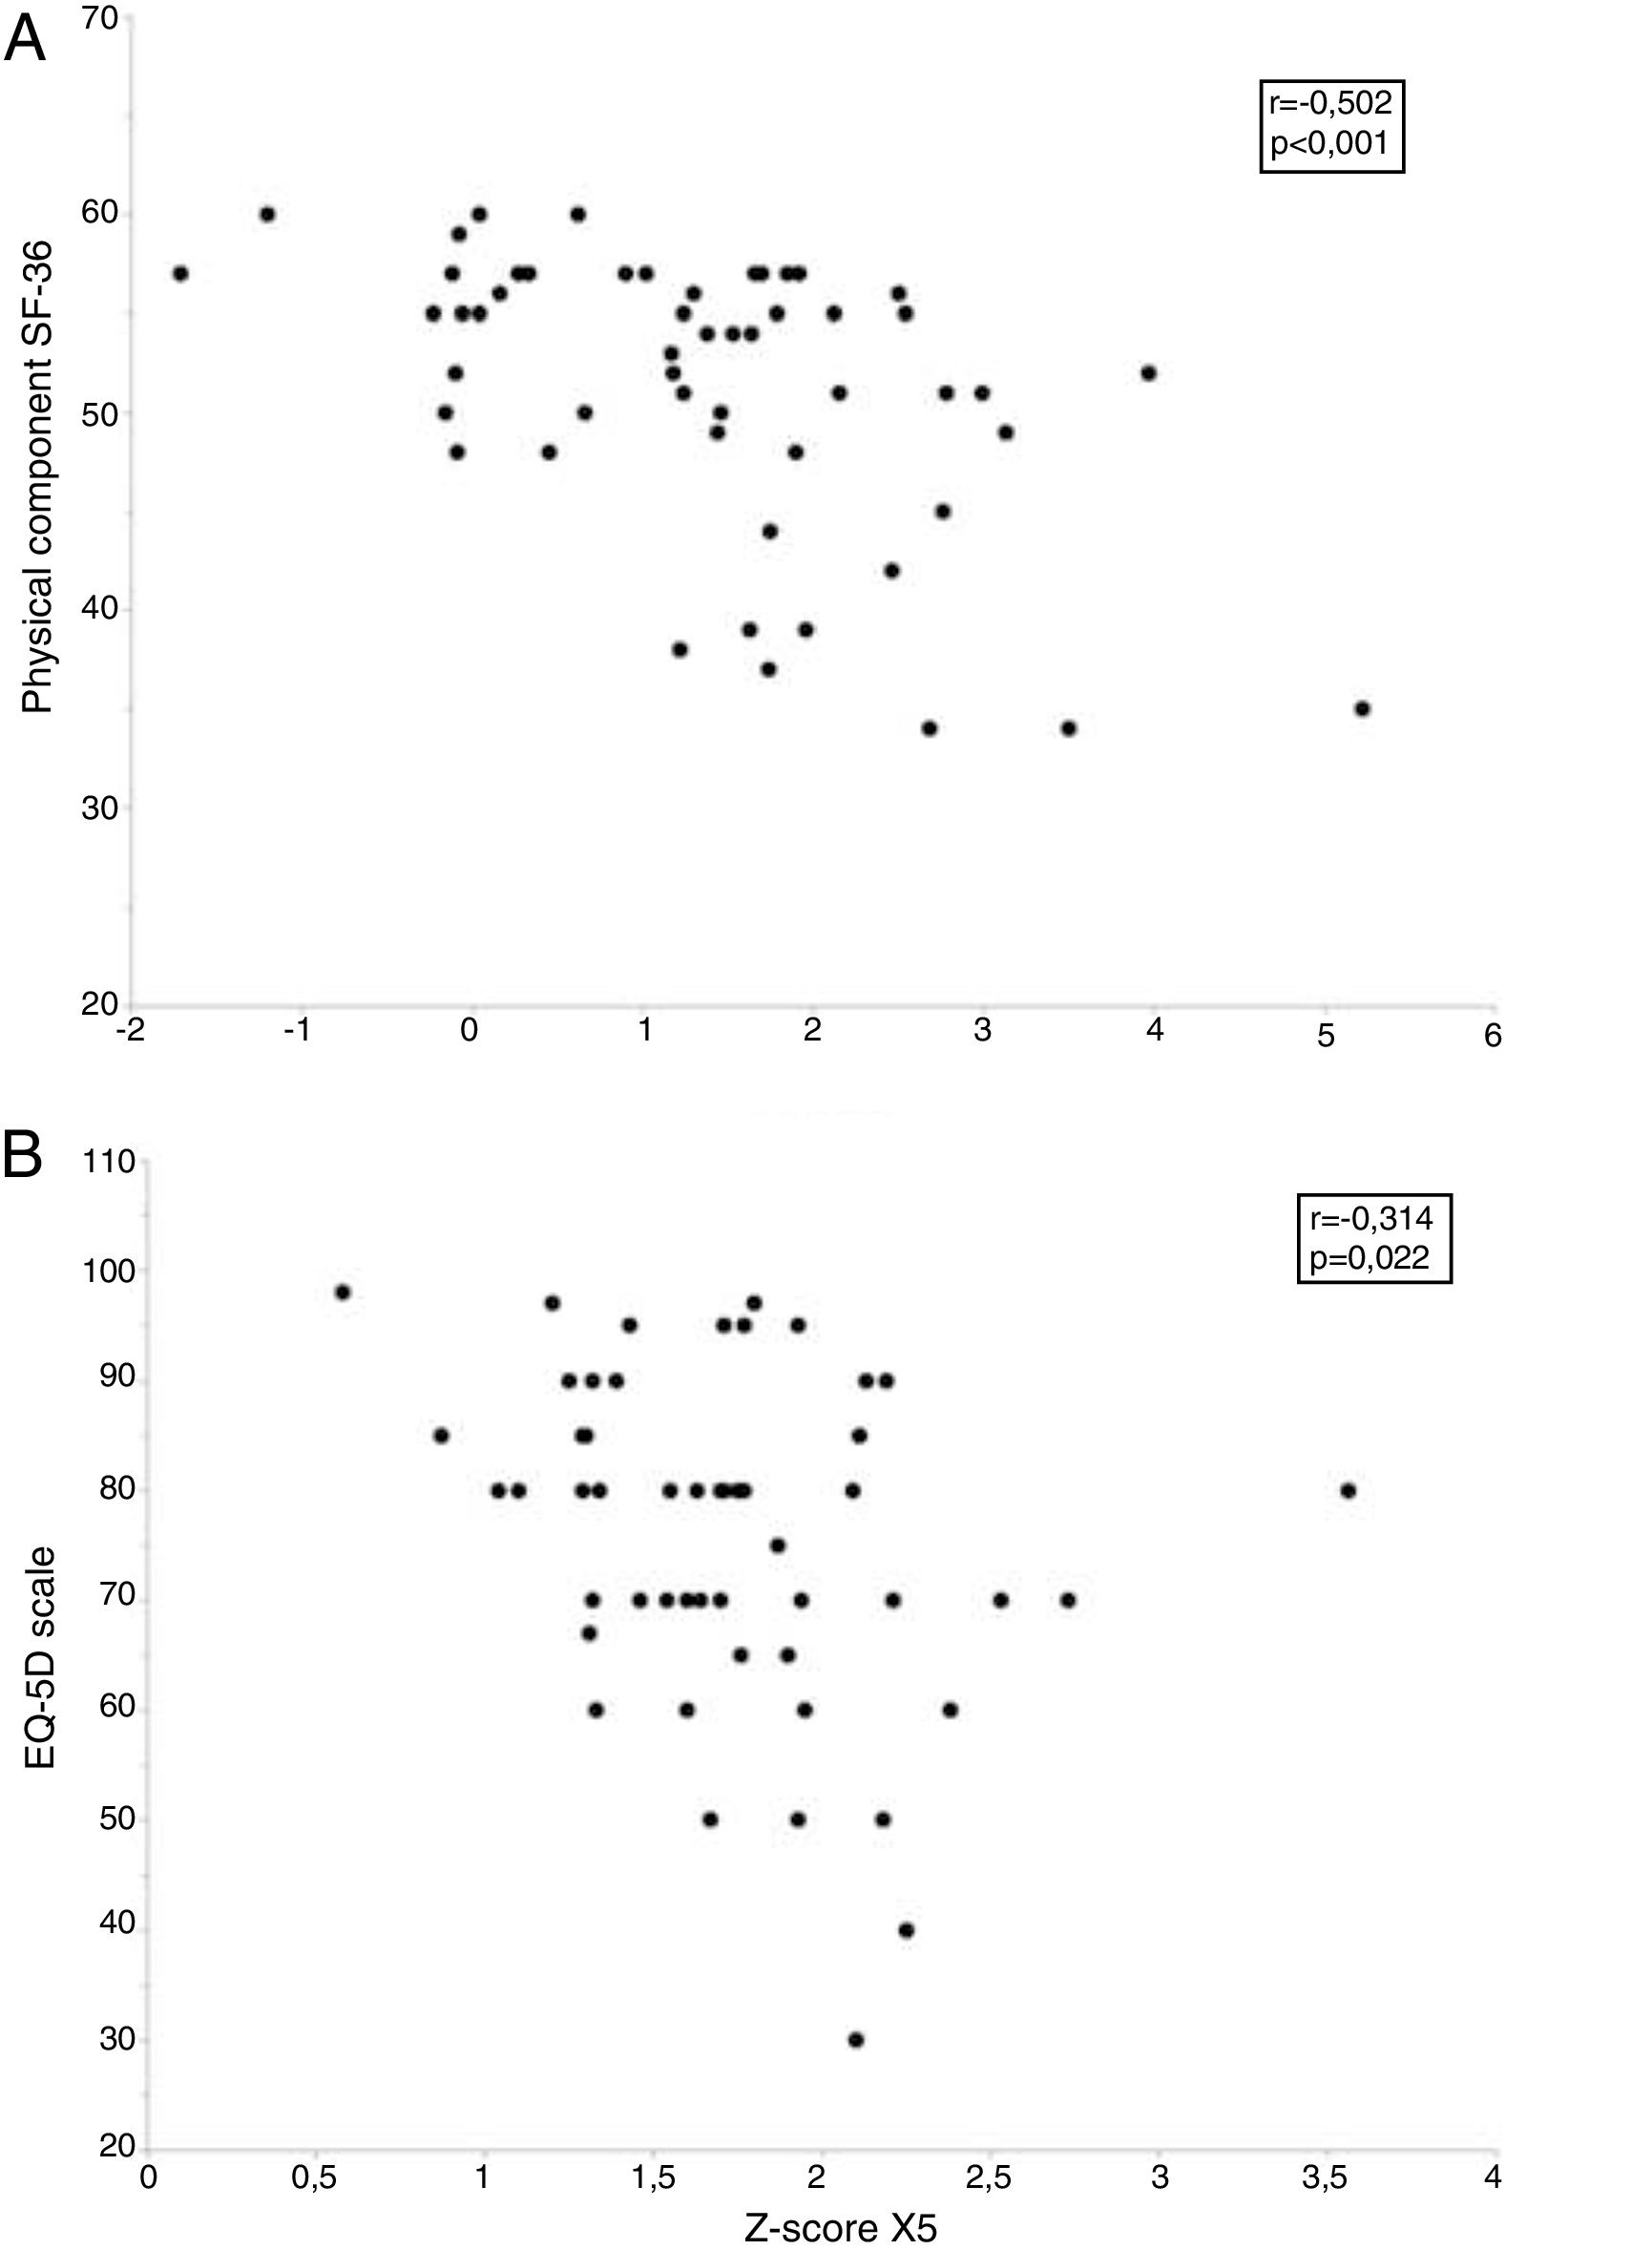
Relationship between the oscillometric parameters and health-related quality of life in smokers without airflow limitation. The upper panel (A) shows the relationship between respiratory resistance at 5Hz (R5) and the physical component of the Short Form 36 Health Survey (SF-36) questionnaire, while the lower panel (B) shows the relationship between capacitive reactance at 5Hz (X5), and European Quality of Life-5 Dimensions (EQ-5D) questionnaire.
Relationship Between Oscillometric Parameters and Health-related Quality of Life in Smokers Without Airflow Limitation.
| Non-standardized Coefficients | Standardized Coefficients | Change r2 | p | |||
|---|---|---|---|---|---|---|
| Beta | Standard Error | 95% CI | Beta | |||
| Physical component SF-36 questionnaire | ||||||
| z-Score R5 | −2.616 | 0.594 | −3.810 to −1.422 | −0.520 | 0.290 | <0.001 |
| Constant | −21.345 | 36.957 | −95.693 to 53.002 | – | – | 0.566 |
| EQ-5D scale | ||||||
| z-Score X5 | −9.559 | 4.049 | −17.687 to −1.430 | −0.314 | 0.099 | 0.022 |
| Constant | 73.058 | 2.262 | 68.517 to 77.599 | – | – | <0.001 |
95% CI: 95% confidence interval; EQ-5D: European Quality of Life-5 Dimensions; r2: coefficient of determination; R5: respiratory resistance at 5Hz; SF-36: Short Form 36 Health Survey; X5: capacitive reactance at 5Hz.
The principal finding of our study is that SAD affects over one third of smokers without AFL. Although these changes do not affect spirometry or cause changes in lung attenuation, they are associated with an incipient decline in HRQOL, to the extent that an independent relationship could be identified between HRQOL and some forced oscillation parameters.
SAD was detected in our smokers at a higher rate than in previous studies, which reported that 5%–13% of smokers with normal spirometry might have altered IOS.22,23 However, these studies did not specify a cut-off point for the detection of AFL and did not distinguish between active smokers and former smokers with different times of abstinence. In contrast, when predetermined cut-off points for R5–R20 were used, the presence of SAD was reported in 33%–42% of subjects with asthma and normal spirometry.24,25 Although the information available in smokers without AFL is scarce, Jetmalani et al.26 found at least one abnormality in up to 51% of such individuals, mainly in respiratory resistance, while Berger et al.27 reported that R5 is high in 56% of asymptomatic smokers with normal spirometry. In any case, the percentage of SAD identified in smokers without AFL is in line with figures determined by multiple breath nitrogen washout, which identified conductive airway involvement in 24% of subjects and acinar airway involvement in 38%.28
A preliminary analysis of a subsample of the ECLIPSE study revealed the potential usefulness of IOS in the preliminary stages of smoking-induced lung damage.22 Although that study found no differences in the absolute values of the IOS parameters between patients with COPD, smokers without AFL, and non-smokers, probably due to the notable differences in anthropometric characteristics and smoking among the groups, it did show a discreet, clinically acceptable intra-individual variability in respiratory system impedance in the short and medium term.22 But the most interesting finding was the identification of an “apparently healthy” group of smokers who had a high AX, leading the authors to speculate that the presence of small airway changes could provide early evidence of AFL that would otherwise be undetectable with conventional spirometric parameters.22 Along the same lines, Frantz et al.29 compared patients with normal spirometry and a self-reported diagnosis of chronic bronchitis or emphysema with subjects without this diagnosis, and found that the first group had higher values of R5, R5–R20, X5, and AX, in addition to greater use of respiratory medication.
It is interesting to note that no correlation between oscillometric parameters and lung attenuation measurements in inspiratory or expiratory phases was observed in our smokers with no evidence of AFL. A similar finding was reported in the ECLIPSE study with regard to CT measurements carried out in inspiration.22 Three types of pulmonary involvement detectable on CT have been proposed to explain this discrepancy: airway wall thickening, increased lung attenuation (emphysema), and mixed.30 Changes in R5, R5–R20, fres and X5 may correspond mainly to airway involvement and mixed involvement, so their relationship with attenuation changes is not predictable.30 Another explanation may lie in the fact that IOS and CT are sensitive to changes in pulmonary mechanics that occur at various stages in the progression of airway damage. Resistance is affected by many factors, including airway caliber, particularly when narrowing is heterogeneous and widespread, and involves the central and peripheral airways.14 Reactance is also sensitive to the heterogeneous and widespread narrowing of the bronchial and bronchiolar lumen, but it also depends on airway closure,9 which may also be compromised in the case of air trapping. However, air trapping in smokers without AFL is much lower than in asthmatics,31 so this change is probably too insignificant to induce important changes in lung attenuation and generate an additional increase in X5. In short, we might suggest that CT can be used to evaluate distal parenchymal involvement, whereas respiratory impedance, particularly respiratory resistances, reflect the caliber of the small airways to an even better extent than bronchial wall thickness, since this latter measurement is performed on higher bronchial generations.31
In our opinion, the most singular finding of this study is the loss of HRQOL in active smokers with SAD who have not yet developed AFL. A greater frequency of wheezing was previously reported in subjects with high R5.28 The decline in HRQOL among smokers with SAD, which lies midway between non-smokers or smokers without SAD and smokers with AFL, could explain the differences in perceived health among smokers. Smokers are also known to have worse HRQOL than non-smokers32 and a persistent smoking habit is associated with a progressive deterioration of HRQOL,11 while smoking cessation leads to an improvement in quality of life.33 As in our study, HRQOL involvement was detected by changes in EQ-5D scores and in all domains of the SF-12 and SF-36 questionnaires,33–35 although those authors reported a slightly higher degree of involvement than found in our patients, probably because their patients were older, predominantly men, with an unknown cumulative smoking rate, who were resident in other geographic areas.
However, the most notable finding regarding HRQOL in smokers with normal spirometry was the heterogeneity of its intensity, which to date could not be adequately explained merely by a more intense habit34 or greater nicotine dependence.35 The finding that smokers with SAD are those who really experience a deterioration in their quality of life helps identify this functional alteration as a potential risk, and is consistent with information from patients with COPD, in whom SAD evaluated by IOS is associated with health status and dyspnea level.36
It is reasonable to assume that the presence of SAD in smokers without AFL is caused by oxidative stress and the direct damage caused by local inflammation in the peripheral airways.37 In fact, in smokers with normal spirometry, individuals with SAD have shown higher lymphocyte and neutrophil counts in their bronchoalveolar lavage and higher cytokines IL-8, eotaxin, and chemokine CD3Cl1 levels.27 The latter is of particular importance due to its involvement in the differentiation of Th17 cells38 and, as such, the progression of chronic respiratory diseases. In turn, the existence of a directly proportional relationship between R5 and bronchoalveolar lavage levels of IL-8, eotaxin, CD3CL1, IL-12p70, and TGFalfa supports its association with the degree of inflammation of the distal airways.27
Evidence on the prognostic significance of SAD in smokers without AFL is still emerging, although in the COPDGene Study changes in the small airways in smokers and ex-smokers without COPD were found to correlate with the rate of annual FEV1 decline, which may reach the same levels as those of patients with moderate COPD, yet could be reversible if distal airway inflammation is controlled.39 These results seem consistent with those obtained in a small group of patients with moderate COPD followed over 5 years, in whom X5, AX and fres were also associated with the annual rate of FEV1 decline.40
Our study has some limitations. It was a small, single-center study, although the sample size was sufficient to detect differences in HRQOL among the different groups of subjects. This makes it difficult to extrapolate results to the general population of smokers. Unlike other analyses, we included a large number of women and middle-aged individuals in order to obtain a more representative sample of the smoking population, but this means that comparison with other studies must be approached with caution. Lung attenuation was evaluated using software for clinical use which does not measure airway caliber thickness. Moreover, we do not have measurements of the diffusing capacity of the lung, although the possibility of finding changes in this parameter among smokers with or without SAD seems unlikely, as attenuation densities did not differ between these groups. Finally, the cross-sectional design of our study prevented us from establishing prognostic factors or demonstrating any kind of association or causation. Similarly, our results do not allow us to make any recommendations on the management or treatment of active smokers with SAD.
In conclusion, SAD in active smokers who have not yet developed AFL or changes in lung attenuation density affects their symptomatic perception of health, since smokers with SAD have a lower HRQOL, which lies midway between non-smokers or smokers without SAD and smokers who have developed COPD. Forced oscillation is a simple, fast, safe, and economic procedure that can identify SAD in more than a third of active smokers.
FundingResearch project partially funded by Chiesi. The sponsor has not participated in the study design, data collection, data analysis and interpretation, manuscript preparation, or the decision to submit the article for publication.
Conflict of InterestsThe authors state that they have no conflict of interests.
The following are the supplementary data this article:


Please cite this article as: García-Quero C, Carreras J, Martínez-Cerón E, Casitas R, Galera R, Utrilla C, et al. La disfunción de las pequeñas vías aéreas deteriora la calidad de vida de fumadores sin limitación al flujo aéreo. Arch Bronconeumol. 2020;56:9–17.