Journal Information
Share
Share
Download PDF
More article options
Visits
323
Original Article
Full text access
Available online 14 June 2024
Radiomics and Clinical Data for the Diagnosis of Incidental Pulmonary Nodules and Lung Cancer Screening: Radiolung Integrative Predictive Model
Visits
323
Sonia Baezaa,b,c,
Corresponding author
smbaeza.germanstrias@gencat.cat

Corresponding author.
, Debora Gild, Carles Sanchezd, Guillermo Torresd, João Carmezimb,e, Cristian Tebéb,e, Ignasi Guaschf, Isabel Nogueiraf, Samuel García-Reinag,h, Carlos Martínez-Barenysg,h, Jose Luis Matei, Felipe Andreoa,b,c, Antoni Rosella,b,c
a Respiratory Medicine Department, Hospital Universitari Germans Trias i Pujol, Badalona, Barcelona, Spain
b Germans Trias i Pujol Research Institute (IGTP), Badalona, Barcelona, Spain
c Departament de Medicina, Universitat Autònoma de Barcelona, Barcelona, Spain
d Computer Vision Center and Computer Science Department, UAB, Barcelona, Spain
e Biostatistics Support and Research Unit, Hospital Universitari Germans Trias i Pujol, Badalona, Barcelona, Spain
f Radiodiagnostic Department, Hospital Universitari Germans Trias i Pujol, Badalona, Barcelona, Spain
g Thoracic Surgery Department, Hospital Universitari Germans Trias i Pujol, Badalona, Barcelona, Spain
h Departament de Cirugia, Universitat Autònoma de Barcelona, Barcelona, Spain
i Pathology Department, Hospital Universitari Germans Trias i Pujol, Badalona, Barcelona, Spain
Ver más
This item has received
Article information
Abstract
Full Text
Bibliography
Download PDF
Statistics
Figures (7)
Show moreShow less
Tables (2)
Table 1. Demographic and clinical characteristics of the patients.
Table 2. Optimal clinical model on 90 patients.
Show moreShow less
Additional material (1)
Abstract
Introduction

Early diagnosis of lung cancer (LC) is crucial to improve survival rates. Radiomics models hold promise for enhancing LC diagnosis. This study assesses the impact of integrating a clinical and a radiomic model based on deep learning to predict the malignancy of pulmonary nodules (PN).
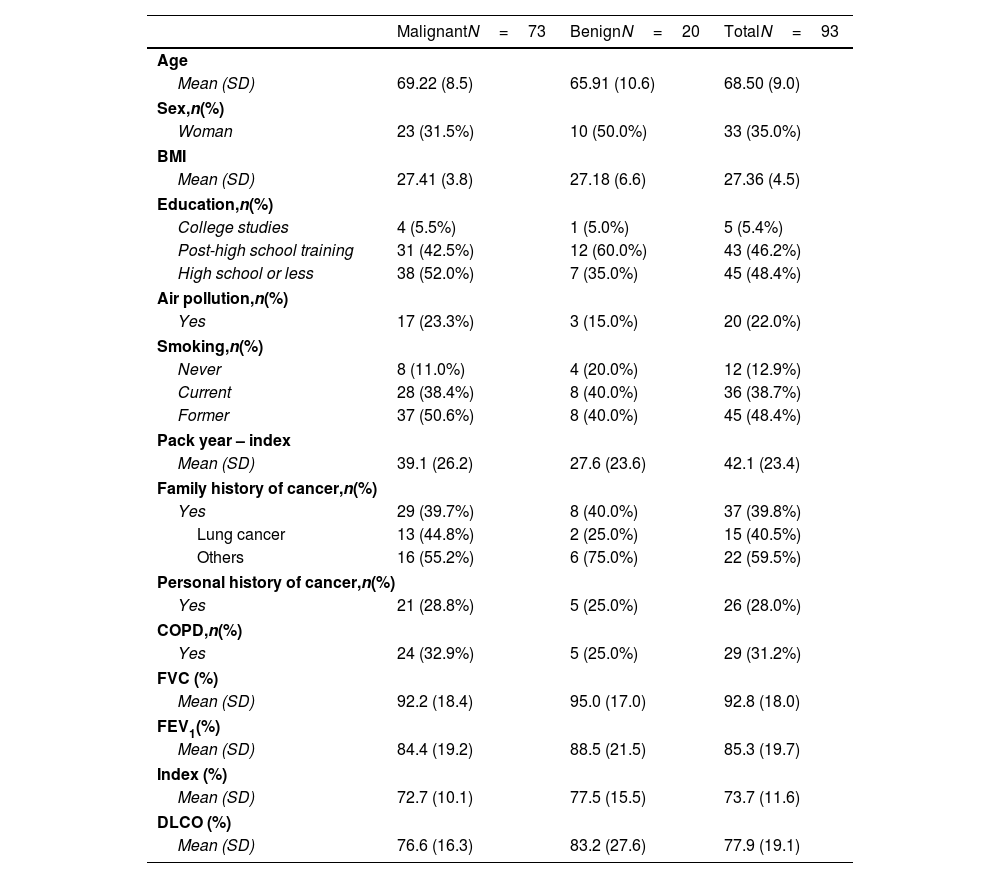
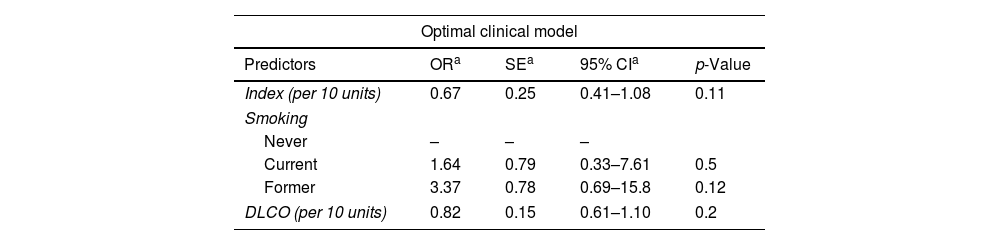
Methodology

Prospective cross-sectional study of 97 PNs from 93 patients. Clinical data included epidemiological risk factors and pulmonary function tests. The region of interest of each chest CT containing the PN was analysed. The radiomic model employed a pre-trained convolutional network to extract visual features. From these features, 500 with a positive standard deviation were chosen as inputs for an optimised neural network. The clinical model was estimated by a logistic regression model using clinical data. The malignancy probability from the clinical model was used as the best estimate of the pre-test probability of disease to update the malignancy probability of the radiomic model using a nomogram for Bayes’ theorem.

Results

The radiomic model had a positive predictive value (PPV) of 86%, an accuracy of 79% and an AUC of 0.67. The clinical model identified DLCO, obstruction index and smoking status as the most consistent clinical predictors associated with outcome. Integrating the clinical features into the deep-learning radiomic model achieves a PPV of 94%, an accuracy of 76% and an AUC of 0.80.

Conclusions

Incorporating clinical data into a deep-learning radiomic model improved PN malignancy assessment, boosting predictive performance. This study supports the potential of combined image-based and clinical features to improve LC diagnosis.

Keywords:
Pulmonary nodules
Lung cancer screening
Radiomics
Predictive model
Abbreviations:
AI
AUC
LC
LCS
LDCT
PN
BMI
COPD
FVC
FEV1
DLCO
PPV
NPV
Full Text
Introduction

Lung cancer (LC) remains a major health problem, causing the highest mortality in Europe and worldwide.1 These data are explained by more than 70% of cases diagnosed at an advanced stage with a low survival; therefore, early diagnosis is key because early-stage treatment improves LC prognosis.2 Recently, a shift has been occurring due to the increasingly expanded use of computed tomography across various settings, leading to a rise in the number of incidentally detected pulmonary nodules (PN). On the other hand, this shift is also attributed to the implementation of lung cancer screening (LCS). In both cases, the outcome is early-stage diagnosis. That's how the 2022 American Cancer Society annual report reveals a decline in the incidence of advanced-stage cancer, with a simultaneous annual increase of 4.5% in a localised stage primarily linked to the initiation of LCS in the US a decade ago.3

Despite the known advantages in reducing mortality due to LCS,4–6 not all PN detected are LC. In a systematic review, 21% of trial screens yielded a false positive result (range 1–42%) in baseline LDCT,6 requiring follow-up images or even biopsy. Thus, these false positives can cause potential harm to patients, and they can generate high costs for health services.7–9 Similarly, they occur with the increased incidental finding of PN, as many of these are benign and require close follow-up, which is similar to the approach taken with PN identified through LCS.10–13 In this context, whether the PN is detected incidentally or through LCS, it is crucial to identify high-risk cases and rule out those with low risk.14,15

Fortunately, applying artificial intelligence (AI) techniques to radiomics might make it possible to discriminate between benign and malignant PN.16 Radiomics is an emerging area based on the high-throughput mining of quantitative image features from medical images that allows data to be applied in clinical decision-making to improve diagnostics and prognostics. It is mainly applied to cancer research.17,18 Image analysis with a structured step workflow19 is used to extract complementary features from multiple views (the shape, intensity and texture of features, among other things) which encapsulate different aspects of the lesion. Machine learning is a subfield of AI that encompasses all approaches and allows computers to learn from various types of data. In contrast, deep learning is part of machine learning based on multi-layered artificial neural networks to solve highly complex problems.20,21 This has been applied in radiomics and is used to model such multi-view features to predict clinical outcomes.

The usefulness of radiomics in the early diagnosis of LC is promising.22,23 Although many of these studies yield favourable outcomes, most are based solely on imaging data. Incorporating clinical data related to LC can enhance these findings by improving their application in daily clinical practice, yet there are still few studies with this approach. Among these, Zhang et al., using retrospective data, developed a radiomic and deep learning model to predict the malignancy of PN, achieving an AUC of 0.819 (95% CI: 0.76–0.88).24 Employing a multi-omics approach could represent a significant advancement in applying AI models to the clinical prognosis of LC patients.25

The Radiolung project aims to design an algorithm based on a radiomic signature that, associated with clinical data, can accurately discriminate between LC and benign tumours.

MethodsDesign and recruitment

Prospective, cross-sectional, comparative, and experimental study investigating the radiomic signatures of malignant and benign resected PNs, along with clinical risk factors. Recruitment took place from December 2019 to September 2023 at a tertiary care hospital. The inclusion criteria were patients aged 35–85 years-old with a clearly identifiable PN detected incidentally by chest CT or in LCS that qualified for surgery according to a multidisciplinary tumour board. The exclusion criteria were a slice thickness greater than 2.5mm in the chest CT, a PN larger than 3cm in diameter, or lung metastasis. The patients underwent lobectomy, segmentectomy, or atypical resection according to thoracic surgery criteria.

In each case, clinical and demographic were selected. Pre-operative results of pulmonary function tests were obtained. Pre-surgery chest CT images, PN characteristics, and the pathological results of the lung tissue obtained during surgery were collected.

This study was performed in accordance with the principles of the Declaration of Helsinki. The research protocol was approved by the regional ethics committee (reference PI-19-169). All the patients gave their written informed consent.

Image data acquisition

Patients underwent multislice chest CT scans using regular radiation or low-dose radiation according to the protocols. Most of these scans were performed without intravenous contrast. Images were acquired with a GE Revolution scanner (General Electric Healthcare, Milwaukee, WI, USA), a SOMATOM Drive (Siemens Healthineers AG, Forchheim, Germany) and a Philips Incisive scanner (Philips Healthcare, Best, the Netherlands) equipped with 128mm×0.625mm, 128mm×0.6mm and 64mm×0.64mm detector collimation, respectively. They all used automatic tube voltage and automatic tube current modulation. Chest CT image reconstructions were performed on a 512×512 matrix using a high spatial frequency algorithm and thin slice thickness applying the lung window setting (WW: 1600 and WL: −600) for the lung series. All chest CTs were interpreted by thoracic radiologists with over 10 years of experience.

The images were extracted from the picture archiving and communication system (PACS) in the Digital Imaging and Communications in Medicine (DICOM) format and were anonymized to guarantee patient confidentiality. Subsequently, the anonymized DICOMs were uploaded to a website hosted at the Autonomous University of Barcelona (UAB) for processing by the Computer Vision Center (CVC) to construct the radiomic model.

Data analysis

The study analysis followed a three-step strategy. In the first step, a radiomic prediction model was fitted to estimate a PN's malignancy probability based on the chest CT image. In the second step, a clinical prediction model was fitted to estimate a patient's malignancy probability based on their clinical profile. In the third step, the malignancy probability predicted by the estimated clinical model was used as the best estimate of the pretest probability of disease to update the radiomic model's node malignancy probability using a nomogram for Bayes’ theorem.26

Deep radiomic model

An AI system designed to diagnose PN based on radiomic analysis of chest CT scans has the three main steps sketched in Fig. 1 (pipeline). These steps have the following goals:

  • 1.

    Nodule detection. The first step is to identify the position and volumetric region (volume of interest, VOI) in the CT scan that contain the lesion of interest.

  • 2.

    Nodule representation. Features are extracted by computing or using intensity values from the volume (3D) or slices (2D) of the VOI, thereby characterising the visual appearance of nodules. These features define a crucial representation space for the malignancy characterisation of the nodules. The representation space of nodules is given by visual features describing the content of textural volumes extracted from the intensity VOI. The textural volumes are given by 3D GLCM (Grey Level Co-occurrence Matrix) textural descriptors derived from co-occurrence matrices.27 The visual features describing the content of textural volumes are extracted using a pre-trained convolutional neural network and concatenated for each slice. Finally, most discriminant features were the input to a fully connected neural network for the classification of benign and malign slices.

  • 3.

    Nodule diagnosis. In this step, a fully connected neural network is trained to determine the values of the nodule representation space that best discriminate malignancy. Furthermore, throughout the nodule representation and diagnosis process, various methods are used, with the potential to optimise their hyperparameters.

Fig. 1.

Overview of the steps involved in the creation of the deep-radiomic model.

(0.4MB).

The probabilities of the deep radiomic model were calculated using a nodule k-fold (K=10) validation scheme in order to mitigate overfitting of the deep learning approach.

For more implementation details of deep-radiomic model see supplementary material.

Clinical model

A descriptive analysis of potential diagnostic factors for the diagnosis of PN malignancy was performed. The set of diagnostic factors included age, sex, educational level, body mass index (BMI), smoking status, living in an area with air pollution, family history of cancer, personal history of cancer, chronic obstructive pulmonary disease (COPD), and spirometric profile like forced vital capacity (FVC), forced expiratory volume in one second (FEV1), diffusing capacity for carbon monoxide (DLCO) and FEV1/FVC or obstruction index.

To proceed with the selection of variables according to the Akaike information criterion (AIC criteria), the initial dataset was bootstraped with repetition 2000 times,28 and a logistic regression model was fit in each sample. Malignancy diagnosis (yes/no) was used as the outcome. Variables that were retained in more than 70% of the models were candidates for the final model. The non-linear relationship between age and the log odd of the outcome was assessed with no relevant results. The final set of variables included in the model was then approved by a pulmonologist with more than 10 years of experience. Internal validation of the resulting model was performed on the whole cohort and was based on discrimination, calibration, and bootstrap validation.29

Discrimination was assessed by estimating the area under the receiver operating characteristic (ROC) curve (AUC). Calibration was assessed by the Brier score and graphically comparing the observed versus expected probabilities of malignancy diagnoses by deciles of predicted risk. Due to the imbalance in the malignancy distribution a precision recall curve was estimated and used to complement the model performance analysis. Bootstrap validation was performed to account for model overfitting and correct for optimism the model performance on the development data. Due to a lack of data, external validation was not performed.

Integrative model – Bayes update

The Bayes theorem underlies the Fagan nomogram.26 This method allowed us to update the probability that a patient had a condition of interest given the probability that the subject had the condition before the test was performed and the likelihood ratio of the test. In our study, we used the probability of the clinical model as the probability that the subject had the condition before testing the PN, and the likelihood ratio of the test was based on the deep radiomic model. The resulting probability, using the Fagan nomogram, estimates the probability that the PN is malignant based on the patient's clinical probability and the deep radiomic model test result. Therefore, given a positive result in the radiomic model, the final probability of lung nodule malignancy is the malignancy clinical probability of the patient multiplied by the positive likelihood ratio of the deep radiomic model. Given a negative result in the radiomic model, the final probability of malignancy is the malignancy clinical probability of the patient multiplied by the negative likelihood ratio of the deep radiomic model.

All analyses were conducted using Python and R software version 4.1.0.30

ResultsDemographic and clinical data

The demographic and clinical characteristics of the patients are presented in Table 1. The mean diameter of the PNs was 17.98mm (18.60mm in malignant, 15.76mm in benign) with a median of 18.00mm. 73 were malignant, and 20 were benign. In terms of the histological type of malignant PN, 57 were adenocarcinoma, and 15 were squamous cell carcinoma. In benign PN, the majority corresponded to fibrosis/inflammation processes (80%), with less frequency attributed to infectious causes such as aspergillosis and tuberculosis. In both benign and malignant nodules, over 50% were located in the upper lobes. The flowchart of patients and PN is in Fig. 2.

Table 1.

Demographic and clinical characteristics of the patients.

  MalignantN=73  BenignN=20  TotalN=93 
Age
Mean (SD)  69.22 (8.5)  65.91 (10.6)  68.50 (9.0) 
Sex,n(%)
Woman  23 (31.5%)  10 (50.0%)  33 (35.0%) 
BMI
Mean (SD)  27.41 (3.8)  27.18 (6.6)  27.36 (4.5) 
Education,n(%)
College studies  4 (5.5%)  1 (5.0%)  5 (5.4%) 
Post-high school training  31 (42.5%)  12 (60.0%)  43 (46.2%) 
High school or less  38 (52.0%)  7 (35.0%)  45 (48.4%) 
Air pollution,n(%)
Yes  17 (23.3%)  3 (15.0%)  20 (22.0%) 
Smoking,n(%)
Never  8 (11.0%)  4 (20.0%)  12 (12.9%) 
Current  28 (38.4%)  8 (40.0%)  36 (38.7%) 
Former  37 (50.6%)  8 (40.0%)  45 (48.4%) 
Pack year – index
Mean (SD)  39.1 (26.2)  27.6 (23.6)  42.1 (23.4) 
Family history of cancer,n(%)
Yes  29 (39.7%)  8 (40.0%)  37 (39.8%) 
Lung cancer  13 (44.8%)  2 (25.0%)  15 (40.5%) 
Others  16 (55.2%)  6 (75.0%)  22 (59.5%) 
Personal history of cancer,n(%)
Yes  21 (28.8%)  5 (25.0%)  26 (28.0%) 
COPD,n(%)
Yes  24 (32.9%)  5 (25.0%)  29 (31.2%) 
FVC (%)
Mean (SD)  92.2 (18.4)  95.0 (17.0)  92.8 (18.0) 
FEV1(%)
Mean (SD)  84.4 (19.2)  88.5 (21.5)  85.3 (19.7) 
Index (%)
Mean (SD)  72.7 (10.1)  77.5 (15.5)  73.7 (11.6) 
DLCO (%)
Mean (SD)  76.6 (16.3)  83.2 (27.6)  77.9 (19.1) 
Fig. 2.

Flowchart of patients and PN.

(0.24MB).
Deep radiomic model

This model includes data from 90 PN that met all the technical requirements for the analysis, 69 (77%) of which were malignant. The sensitivity, specificity, positive predictive value (PPV), and negative predictive value (NPV) were 87% (95% CI: 0.77–0.94), 52% (95% CI: 0.30–0.74), 86% (95% CI: 0.75–0.93) and 55% (95% CI: 0.32–0.77), respectively, with a brier score 0.16 (95% CI: 0.1–0.23), accuracy of 79% (95% CI: 0.59–0.79) and AUC of 0.67 (95% CI: 0.51–0.83) (Fig. 3).

Fig. 3.

ROC curve – deep radiomic model.

(0.07MB).
Clinical model

The model was carried out using the information of the 90 patients with complete cases (Fig. 4), 72 (80%) of which presented a malignant diagnosis. Based on the AIC and considering only variables selected more than 50% of the estimated models in the bootstrap samples, the optimal clinical model is displayed in Table 2.

Fig. 4.

Variables selected from the 2000 bootstrap model.

(0.15MB).
Table 2.

Optimal clinical model on 90 patients.

Optimal clinical model
Predictors  ORa  SEa  95% CIa  p-Value 
Index (per 10 units)  0.67  0.25  0.41–1.08  0.11 
Smoking
Never  –  –  –   
Current  1.64  0.79  0.33–7.61  0.5 
Former  3.37  0.78  0.69–15.8  0.12 
DLCO (per 10 units)  0.82  0.15  0.61–1.10  0.2 
a

OR=odds ratio, SE=standard error, CI=confidence interval.

In this clinical model, the sensitivity, specificity, PPV, and NPV were 86% (95% CI: 0.76–0.93), 61% (95% CI: 0.36–0.83), 90% (95% CI: 0.80–0.96) and 52% (95% CI: 0.30–0.74), respectively, with a brier score 0.14 (95% CI: 0.10–0.19), accuracy of 81% (95% CI: 0.71–0.89) and AUC of 0.71 (95% CI: 0.55–0.87)

Integrative model

The integrative model includes data from 89 PN that met all requirements for the radiomic and clinical model, 69 (78%) of which presented a malignant diagnosis. Integrating selected clinical features into a radiomic deep learning model exhibits a sensitivity, specificity, PPV and NPV of 74% (95% CI: 0.62–0.84), 85% (95% CI: 0.62–0.97), 94% (95% CI: 0.85–0.99) and 49% (95% CI: 0.31–0.66), respectively. The brier score is 0.14 (95% CI: 0.09–0.19), the accuracy is 76% (95% CI: 0.66–0.85), and the AUC is 0.80 (95% CI: 0.67–0.92) (Fig. 5). Fig. 6 plots the final predicted PN malignancy by risk decile against the observed incidence of PN malignancy in each decile. The convergence of the two curves indicates good model calibration. The precision-recall curve (supplemental fig. 5) rises sharply and plateaus at high precision with precision-recall AUC of 0.91. This suggests that the estimated model can achieve high precision (true positive rate) without sacrificing recall (sensitivity).

Fig. 5.

ROC curve – integrative model.

(0.05MB).
Fig. 6.

Model predicted PN malignancy against the observed incidence of PN malignancy by risk decile.

(0.08MB).
Discussion

Radiomics has revolutionised medical imaging, and there are currently many working groups dedicated to this research in different fields.18,31 Other AI techniques, such as deep learning, allow us to associate these radiomic characteristics with other data, such as clinical information. Regarding this integrative approach, few working groups are dedicated to LC and PN diagnosis using radiomics and clinical data together, and the retrospective study by Lui et al.32 stands out. They conducted an analysis utilising 20 radiomic features, in addition to age, gender, and PN location. Successfully, they developed a predictive model that achieved an AUC of 0.81 (95% CI: 0.75–0.87). Similar results were published in 2023 by Lin et al.33 With a similar approach, our study yields promising results, as the integration of selected clinical features with radiomic image data based on deep learning techniques can formulate a predictive model that significantly improve results compared to relying solely on image analysis, achieving a positive predictive value of 94% (95% CI: 0.85–0.99) and an AUC of 0.80 (95% CI: 0.67–0.92). It is worth noting that the accuracy showed a slight but non-significant decrease in the integrative model, which could be related to the imbalance in the number of benign and malignant cases in our cohort.

Other studies such as Marmon et al.34 and Kammer et al.35 have developed models based on blood biomarkers, clinical data, and radiomics with favourable results. However, it is important to note that these studies use blood biomarkers that are not specific to LC, which may add an additional cost without necessarily improving performance compared to models using only clinical and radiomic data. Furthermore, technically, they use classic machine learning hand-crafted features for radiomic descriptors without incorporating information from surrounding lung tissue. While these studies are relevant, our research stands out for its innovative deep learning approach and its ability to integrate multiple data sources.

Regarding validated predictive models based on clinical data, there are those designed for incidental PN such as the Mayo model,36 while others focus on LCS such as the Brock model.37 Please see the comparative table in the supplementary material. We have applied the Mayo model in our cohort and it exhibits similar performance in terms of PPV of 88% (95% CI: 0.75–0.95), but worst accuracy 63% (95% CI: 0.52–0.74), and AUC of 0.54 (95% CI: 0.36–0.72) (see supplemental material).

A strength of this study is that it employs prospective patient data for individuals who have undergone PN surgery, allowing for the collection of clinical data, chest CT images and histology. Another point to highlight is the novelty of this exploratory study, as it tests various clinical characteristics to identify the most representative ones for association with a deep radiomic model. This emphasizes the importance of integrating tools from daily medical practice with new technologies to enable early cancer diagnosis. Finally, we have compared our model with a conventional and validated clinical model such as the Mayo model, allowing us to demonstrate its validity in our cohort.

As for the limitations of this study, the most significant one is the need to expand the number of cases to improve both the clinical and radiomic models. Therefore, we are considering making the next study multicentric in the upcoming year to validate our exploratory analysis. Another limitation is the low number of benign cases, as these are real-life cases involving PN that have undergone surgery, which are inherently more diagnostically challenging. On the flip side, this situation contributes to the model training to detect suspicious malignancy cases of PN that ultimately prove benign.

Radiomics and AI models focused on LC are evolving across different phases, encompassing aspects such as PN management, diagnosis, treatment, and relapse of LC.38,39 Integrative models with clinical data will be crucial to optimise their effectiveness. These advancements will positively impact patients, particularly in managing PN, because these models will aid in more accurately predicting the likelihood of malignancy, thereby avoiding unnecessary follow-ups, biopsies or surgeries. This situation not only reduces patient anxiety but also minimises potential harm, decreases waiting lists and reduces healthcare system costs.

In conclusion, we firmly believe that this integrative model, combining clinical data and radiomics through deep learning, can aid in diagnosing and managing PN. Although external validation is necessary in a subsequent phase, in the near future it may be directly useful in LCS programmes, thus optimising the early detection of LC and bringing technological advances closer to clinical practice.

Funding

This project is supported by the Ministerio de Economía, Industria y Competitividad, Gobierno de España grant number PID 2021-126776OB-C21; Barcelona Respiratory Network (BRN) Fundació Ramon Pla i Armengol; “Clinical project” grant, Fundació Acadèmia Ciències Mèdiques de Catalunya i de Balears; “Talents” grant 2020, Fundació La Pedrera and Hospital Universitari Germans Trias i Pujol; Lung Ambition Alliance Grant; and the JMC Legacy Research Fund of Germans Trias i Pujol University Hospital.

Financial/non-financial disclosures

The authors declare not to have any conflicts of interest that may be considered to influence directly or indirectly the content of the manuscript.

Authors’ contributions

Sonia Baeza: conceptualization, methodology, data curation, formal analysis, validation, writing-original draft, writing-review and editing, visualisation. Debora Gil: conceptualization, methodology, software, formal analysis, validation, writing-review and editing, supervision. Carles Sanchez: methodology, software, data curation, formal analysis, validation, writing-review and editing. Guillermo Torres: methodology, software, data curation, formal analysis, validation, writing-review and editing. Cristian Tebé: validation, formal analysis, writing-review and editing. João Carmezim: validation, formal analysis, writing-review and editing. Ignasi Guasch: methodology, writing-review and editing. Isabel Nogueira: methodology, writing-review and editing. Samuel Garcia-Reina: methodology, writing-review and editing. Carlos Matínez-Barenys: methodology, writing-review and editing. Jose Luis Mate: methodology, writing-review and editing. Felipe Andreo: conceptualization, writing-review and editing. Antoni Rosell: conceptualization, methodology, formal analysis, writing-review and editing, supervision.

Artificial intelligence involvement

The text is original, and no artificial intelligence techniques have been used to write its content.

Acknowledgements

We thank Adela González, our nurse navigator, and Laia Ruiz, a UAB medical student, for their contribution and support.

Appendix A
Supplementary data

The followings are the supplementary data to this article:

References
[1]
H. Sung, J. Ferlay, R.L. Siegel, M. Laversanne, I. Soerjomataram, A. Jemal, et al.
Global cancer statistics 2020: GLOBOCAN estimates of incidence and mortality worldwide for 36 cancers in 185 countries.
CA Cancer J Clin, 71 (2021), pp. 209-249
[2]
P. Goldstraw, K. Chansky, J. Crowley, R. Rami-Porta, H. Asamura, W.E.E. Eberhardt, et al.
The IASLC lung cancer staging project: proposals for revision of the TNM stage groupings in the forthcoming (eighth) edition of the TNM Classification for lung cancer.
J Thorac Oncol, 11 (2016), pp. 39-51
[3]
R.L. Siegel, K.D. Miller, H.E. Fuchs, A. Jemal.
Cancer statistics, 2022.
CA Cancer J Clin, 72 (2022), pp. 7-33
[4]
D.R. Aberle, A.M. Adams, C.D. Berg, W.C. Black, J.D. Clapp, R.M. Fagerstrom, et al.
Reduced lung-cancer mortality with low-dose computed tomographic screening.
N Engl J Med, 365 (2011), pp. 395-409
[5]
H.J. De Koning, C.M. Van der Aalst, P.A. De Jong, E.T. Scholten, K. Nackaerts, M.A. Heuvelmans, et al.
Reduced lung-cancer mortality with volume ct screening in a randomized trial.
N Engl J Med, 382 (2020), pp. 503-513
[6]
A. Bonney, R. Malouf, C. Marchal, D. Manners, K.M. Fong, H.M. Marshall, et al.
Impact of low-dose computed tomography (LDCT) screening on lung cancer-related mortality.
Cochrane Database Syst Rev, 8 (2022), pp. CD013829
[7]
J.L. Mulshine, T.A. D’Amico.
Issues with implementing a high-quality lung cancer screening program.
CA Cancer J Clin, 64 (2014), pp. 351-363
[8]
P.J. Mazzone.
Obstacles to and solutions for a successful lung cancer screening program.
Semin Respir Crit Care Med, 37 (2016), pp. 659-669
[9]
G.X. Wang, T.P. Baggett, P.V. Pandharipande, E.R. Park, F.J. Fintelmann, S. Percac-Lima, et al.
Barriers to lung cancer screening engagement from the patient and provider perspective.
Radiology, 290 (2019), pp. 278-287
[10]
M.K. Gould, T. Tang, I.L.A. Liu, J. Lee, C. Zheng, K.N. Danforth, et al.
Recent trends in the identification of incidental pulmonary nodules.
Am J Respir Crit Care Med, 192 (2015), pp. 1208-1214
[11]
A.R. Larici, A. Farchione, P. Franchi, M. Ciliberto, G. Cicchetti, L. Calandriello, et al.
Lung nodules: size still matters.
Eur Respir Rev, 26 (2017), pp. 170025
[12]
P.J. Mazzone, L. Lam.
Evaluating the patient with a pulmonary nodule: a review.
JAMA, 327 (2022), pp. 264-273
[13]
P. Karius, A. Lembcke, F.C. Sokolowski, I.D.P. Gandara, A. Rodríguez, B. Hamm, et al.
Extracardiac findings on coronary computed tomography angiography in patients without significant coronary artery disease.
Eur Radiol, 29 (2019), pp. 1714-1723
[14]
A. McWilliams, M.C. Tammemagi, J.R. Mayo, H. Roberts, G. Liu, K. Soghrati, et al.
Probability of cancer in pulmonary nodules detected on first screening CT.
N Engl J Med, 369 (2013), pp. 910-919
[15]
M. Simon, K. Zukotynski, D.M. Naeger.
Pulmonary nodules as incidental findings.
CMAJ, 190 (2018), pp. E167
[16]
F. Binczyk, W. Prazuch, P. Bozek, J. Polanska.
Radiomics and artificial intelligence in lung cancer screening.
Transl Lung Cancer Res, 10 (2021), pp. 1186-1199
[17]
P. Lambin, E. Rios-Velazquez, R. Leijenaar, S. Carvalho, R.G.P.M. van Stiphout, P. Granton, et al.
Radiomics: extracting more information from medical images using advanced feature analysis.
Eur J Cancer, 48 (2012), pp. 441-446
[18]
P. Lambin, R.T.H. Leijenaar, T.M. Deist, J. Peerlings, E.E.C. de Jong, J. van Timmeren, et al.
Radiomics: the bridge between medical imaging and personalized medicine.
Nat Rev Clin Oncol, 14 (2017), pp. 749-762
[19]
H.J.W.L. Aerts.
The potential of radiomic-based phenotyping in precision medicine.
[20]
A.L. Samuel.
Some studies in machine learning using the game of checkers.
IBM J Res Dev, 3 (1959), pp. 210-229
[21]
J.-G. Lee, S. Jun, Y.-W. Cho, H. Lee, G.B. Kim, J.B. Seo, et al.
Deep learning in medical imaging: general overview.
Korean J Radiol, 18 (2017), pp. 570-584
[22]
B. Chen, L. Yang, R. Zhang, W. Luo, W. Li.
Radiomics: an overview in lung cancer management—a narrative review.
Ann Transl Med, 8 (2020), pp. 1191
[23]
Y.-J. Wu, F.-Z. Wu, S.-C. Yang, E.-K. Tang, C.-H. Liang.
Radiomics in early lung cancer diagnosis: from diagnosis to clinical decision support and education.
Diagnostics, 12 (2022), pp. 1064
[24]
R. Zhang, Y. Wei, F. Shi, J. Ren, Q. Zhou, W. Li, et al.
The diagnostic and prognostic value of radiomics and deep learning technologies for patients with solid pulmonary nodules in chest CT images.
BMC Cancer, 22 (2022), pp. 1118
[25]
J. Li, J. Wu, Z. Zhao, Q. Zhang, J. Shao, C. Wang, et al.
Artificial intelligence-assisted decision making for prognosis and drug efficacy prediction in lung cancer patients: a narrative review.
J Thorac Dis, 13 (2021), pp. 7021-7033
[26]
T.J. Fagan.
Nomogram for Bayes's theorem.
N Engl J Med, 293 (1975), pp. 257
[27]
R.M. Haralick, K. Shanmugam, I. Dinstein.
Textural features for image classification.
IEEE Trans Syst Man Cybern, SMC-3 (1973), pp. 610-621
[28]
P.C. Austin, J.V. Tu.
Bootstrap methods for developing predictive models.
Am Stat, 58 (2004), pp. 131-137
[29]
G.S. Collins, J.B. Reitsma, D.G. Altman, K.G.M. Moons.
Transparent reporting of a multivariable prediction model for individual prognosis or diagnosis (TRIPOD): the TRIPOD statement.
BMJ, 350 (2015), pp. g7594
[30]
The Comprehensive R Archive Network, 2024. https://Cran.r-ProjectOrg [accessed 01.3.24].
[31]
A.-N. Frix, F. Cousin, T. Refaee, F. Bottari, A. Vaidyanathan, C. Desir, et al.
Radiomics in lung diseases imaging: state-of-the-art for clinicians.
J Pers Med, 11 (2021), pp. 602
[32]
A. Liu, Z. Wang, Y. Yang, J. Wang, X. Dai, L. Wang, et al.
Preoperative diagnosis of malignant pulmonary nodules in lung cancer screening with a radiomics nomogram.
Cancer Commun, 40 (2020), pp. 16-24
[33]
R. Lin, Y. Zheng, F. Lv, B. Fu, W. Li, Z. Liang, et al.
A combined non-enhanced CT radiomics and clinical variable machine learning model for differentiating benign and malignant sub-centimeter pulmonary solid nodules.
Med Phys, 50 (2023), pp. 2835-2843
[34]
H.N. Marmor, L. Jackson, S. Gawel, M. Kammer, P.P. Massion, E.L. Grogan, et al.
Improving malignancy risk prediction of indeterminate pulmonary nodules with imaging features and biomarkers.
Clin Chim Acta, 534 (2022), pp. 106-114
[35]
M.N. Kammer, D.A. Lakhani, A.B. Balar, S.L. Antic, A.K. Kussrow, R.L. Webster, et al.
Integrated biomarkers for the management of indeterminate pulmonary nodules.
Am J Respir Crit Care Med, 204 (2021), pp. 1306-1316
[36]
S.J. Swensen.
The probability of malignancy in solitary pulmonary nodules.
[37]
A. McWilliams, M.C. Tammemagi, J.R. Mayo, H. Roberts, G. Liu, K. Soghrati, et al.
Probability of cancer in pulmonary nodules detected on first screening CT.
N Engl J Med, 369 (2013), pp. 910-919
[38]
F. Pan, L. Feng, B. Liu, Y. Hu, Q. Wang.
Application of radiomics in diagnosis and treatment of lung cancer.
Front Pharmacol, (2023), pp. 14
[39]
A. Khawaja, B.J. Bartholmai, S. Rajagopalan, R.A. Karwoski, C. Varghese, F. Maldonado, et al.
Do we need to see to believe? Radiomics for lung nodule classification and lung cancer risk stratification.
J Thorac Dis, 12 (2020), pp. 3303-3316
Copyright © 2024. SEPAR
Archivos de Bronconeumología
Article options
Tools

Are you a health professional able to prescribe or dispense drugs?