


Predicting the response to pulmonary rehabilitation (PR) could be valuable in defining admission priorities. We aimed to investigate whether the response of individuals recovering from a COPD exacerbation (ECOPD) could be forecasted using machine learning approaches.
MethodThis multicenter, retrospective study recorded data on anthropometrics, demographics, physiological characteristics, post-PR changes in six-minute walking distance test (6MWT), Medical Research Council scale for dyspnea (MRC), Barthel Index dyspnea (BId), COPD assessment test (CAT) and proportion of participants reaching the minimal clinically important difference (MCID). The ability of multivariate approaches (linear regression, quantile regression, regression trees, and conditional inference trees) in predicting changes in each outcome measure has been assessed.
ResultsIndividuals with lower baseline 6MWT, as well as those with less severe airway obstruction or admitted from acute care hospitals, exhibited greater improvements in 6MWT, whereas older as well as more dyspnoeic individuals had a lower forecasted improvement. Individuals with more severe CAT and dyspnea, and lower 6MWT had a greater potential improvement in CAT. More dyspnoeic individuals were also more likely to show improvement in BId and MRC. The Mean Absolute Error estimates of change prediction were 44.70m, 3.22 points, 5.35 points, and 0.32 points for 6MWT, CAT, BId, and MRC respectively. Sensitivity and specificity in discriminating individuals reaching the MCID of outcomes ranged from 61.78% to 98.99% and from 14.00% to 71.20%, respectively.
ConclusionWhile the assessed models were not entirely satisfactory, predictive equations derived from clinical practice data might help in forecasting the response to PR in individuals recovering from an ECOPD. Future larger studies will be essential to confirm the methodology, variables, and utility.

Pulmonary rehabilitation (PR) is a recognized component of management of chronic obstructive pulmonary disease (COPD). It improves dyspnea, fatigue, exercise capacity, and health-related quality of life (HRQL). Guidelines recommend PR for individuals experiencing persistent breathlessness and/or exercise limitation with impaired HRQL.1,2
Exacerbations of COPD (ECOPD) have effects on lung function, new ECOPD, mortality and on economic and symptom burden, HRQL, exercise capacity, and nutritional status.3,4 Early PR following an ECOPD is associated to reduced prevalence of new ECOPD, longer survival, and cost-effectiveness.5 Unfortunately, there are barriers to PR programs, such as a high number of candidates, transportation, costs, and geographical obstacles.6 To improve access to PR, governments should increase resources and quality of services, and practitioners should explore modalities such as personalization and telerehabilitation.7,8 An additional approach might involve identifying characteristics of potential responders to optimize resources.
Machine learning (ML), a subfield of artificial intelligence (AI), consists of algorithms capable of learning and improving from experience, aiming to classify individual conditions or forecast outcomes when applied to the medical context and has been widely applied in clinical research.9–11 Machine learning has been employed in early diagnosis of ECOPD.12–14
This large, multicentre, retrospective study aimed to explore the feasibility of integrating information from clinical practice to predict individual-level post-PR responses in commonly used outcomes of PR by statistical and ML methods.
Material and methodsThis study analyzed data from hospital medical records of individuals recovering from ECOPD, admitted to an in-hospital PR program and was approved by the Istituti Clinici Scientifici (ICS) Maugeri Ethics Committee (2555 CE 8 June 2021). As a retrospective study, participants had not provided any specific written informed consent, however, at admission to hospitals, they had given – in advance – informed consent for the scientific use of their data. As a retrospective analysis, the study was not registered.
ParticipantsThe study was conducted on data from individuals recovering from an ECOPD, either cared for in acute hospitals and transferred to Rehabilitation Hospitals or cared for at home by their general practitioners [GP], and admitted after an out-patient clinic visit, between July, 1st, 2018 to December, 31st, 2021 to hospitals of the network previously described.15 These hospitals share common indications, evaluation, diagnostic and management tools and protocols for PR. During the pandemic (March 2020–December 2021), only participants with negative swab tests were admitted. It's worth noting that this study utilized the same dataset analyzed and published elsewhere.15
The study included data from individuals with:
- -
Diagnosis of COPD according to the GOLD guidelines.2
- -
Persistent breathlessness and/or exercise limitation within the previous 30 days after an ECOPD managed in acute care hospitals or within the previous 4 weeks after an ECOPD managed at home by the GP.16
- -
Present stable conditions, defined as absence of acute worsening in symptoms (i.e. no change in dyspnea, cough, and/or sputum beyond the day-to-day variability) that would have required a change in management compared to the conditions reported at home or at discharge from the referring acute care hospital.16
- -
Availability of data on lung function and paired pre and post-PR data of outcome measures.
- -
Participating in at least 12 PR sessions, a threshold chosen according to our previous published experience.17
Exclusion criteria from PR had been: severe comorbidities such as oncological, neurological disorders, heart failure, or recent (less than 4 months) acute ischemic cardiovascular diseases with an unstable status and individuals unable or refusing to perform PR.
MeasurementsThe following data were recorded at admission: demographics, anthropometrics, history of ECOPD in previous 12 months, Comorbidity Index of the Cumulative Illness Rating Scale (CIRS), BMI – airflow obstruction – dyspnea, and exercise capacity (BODE) index, provenience (hospital or home), length of rehabilitation hospital stay (LoS), occurrence of chronic respiratory failure (CRF), distribution in GOLD stages, drug therapy in stable state.
Before the program the following assessments had been performed:
- -
Forced expiratory volumes according to standards.18
- -
Functional disability by the Barthel index (BI).19
Before and after the program, the following outcome measures had been assessed:
- -
Six-minute walking distance test (6MWT).20,21 The minimal clinically important difference (MCID) has been reported as an improvement by at least 30m.20
- -
Dyspnea by the Medical Research Council (MRC) scale.22 A one-point reduction is considered equivalent to MCID.23
- -
Dyspnea by the Barthel Index dyspnea (BId). The MCID has been defined as a 9-point reduction for individuals without and as a 12-point reduction for individuals with CRF, respectively.24
- -
COPD assessment test (CAT). A two-point reduction in score has been reported as the MCID.25
Our program is supervised by multidisciplinary teams of trained and experienced chest physicians, nurses, physical therapists, dieticians, and psychologists full-time dedicated to PR. It starts within 2 days from admission, after baseline evaluations and includes daily supervised sessions (6 weekly days) of cycle training according to Maltais et al.,26 until performing 30min of continuous cycling at 50–70% of maximal load, (calculated on baseline 6MWT according to Luxton et al.27). Workload was increased by 5 Watts when subjects scored their dyspnea or leg fatigue as <3 on a 10-point Borg Scale, remained unchanged if score was 4 or 5 and was reduced for scores of >5. Pulse oximetry, arterial blood pressure, and heart rate are monitored during sessions.
The program also includes optimization of medications, education, nutritional programs, and psychosocial counseling when appropriate, abdominal, upper, and lower limb muscle activities lifting weights progressively. The duration of daily activities is 2–3h. The program is performed in Gymn Room with full availability of safety tools (e.g. CPR).
During pandemic, protective measures were adopted, such as personal protective equipment, distance among individuals not less than 2m, disinfection of materials, frequent air changes, execution of a swab at first harmful signs.
Statistical and ML analysesQuantitative variable distribution is described as median (25th, 75th percentiles) since most of them deviated from the normality assumptions, as determined by visual inspection of histograms. Categorical variable distribution is described as absolute and relative (%) frequencies. There were no missing values in the data. The whole dataset was randomly split into a training (70% of the whole dataset) and a test set (30%). Statistical and ML methods for regression (linear regression, quantile regression [quantile=0.5], regression trees, and conditional inference trees) were trained to predict quantitative pre to post PR changes in outcomes and tested as described in the Supplementary material – Supplementary Methods section. Post PR changes in outcomes were computed as value at discharge – value at admission and were dichotomized based on the corresponding MCID. Predictive performances were expressed as mean absolute error (MAE), sensitivity, specificity, positive predictive value (PPV) and negative predictive value (NPV) (Supplementary material – Supplementary Methods). Significance level was set to α=0.05. Statistical and ML analyses were performed by the R software tool version 4.2.2 (www.r-project.org).
ResultsOut of 5741 individuals admitted with breathlessness and/or exercise limitation after an ECOPD, data from 4582 individuals were excluded. Causes of exclusion were: 4142 lacking lung function data or with unconfirmed COPD; 293 lacking pre and/or post PR data of outcomes, 28 had severe comorbidities, 89 unable to perform PR, 12 transferred to an acute care hospital or deceased and 18 performing less than 12 sessions.15
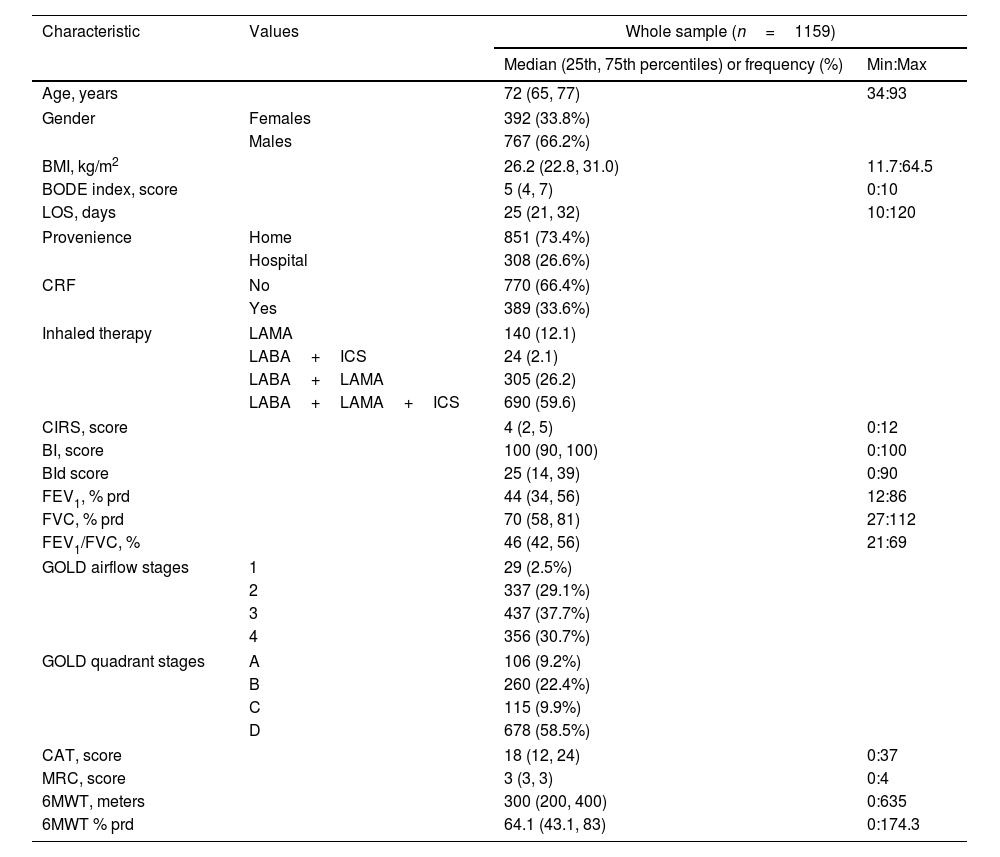
Participants’ characteristicsCharacteristics of 1159 individuals included are in Table 1.15 The majority of participants were males, were admitted from home, used triple (Long acting muscarinic antagonists+Long acting beta agonists+inhaled corticosteroids: LAMA+LABA+ICS) inhaled therapy and were included in most severe GOLD stages (1 and 2 or C and D) but did not suffer from CRF.
Baseline participants’ characteristics.23
| Characteristic | Values | Whole sample (n=1159) | |
|---|---|---|---|
| Median (25th, 75th percentiles) or frequency (%) | Min:Max | ||
| Age, years | 72 (65, 77) | 34:93 | |
| Gender | Females | 392 (33.8%) | |
| Males | 767 (66.2%) | ||
| BMI, kg/m2 | 26.2 (22.8, 31.0) | 11.7:64.5 | |
| BODE index, score | 5 (4, 7) | 0:10 | |
| LOS, days | 25 (21, 32) | 10:120 | |
| Provenience | Home | 851 (73.4%) | |
| Hospital | 308 (26.6%) | ||
| CRF | No | 770 (66.4%) | |
| Yes | 389 (33.6%) | ||
| Inhaled therapy | LAMA | 140 (12.1) | |
| LABA+ICS | 24 (2.1) | ||
| LABA+LAMA | 305 (26.2) | ||
| LABA+LAMA+ICS | 690 (59.6) | ||
| CIRS, score | 4 (2, 5) | 0:12 | |
| BI, score | 100 (90, 100) | 0:100 | |
| BId score | 25 (14, 39) | 0:90 | |
| FEV1, % prd | 44 (34, 56) | 12:86 | |
| FVC, % prd | 70 (58, 81) | 27:112 | |
| FEV1/FVC, % | 46 (42, 56) | 21:69 | |
| GOLD airflow stages | 1 | 29 (2.5%) | |
| 2 | 337 (29.1%) | ||
| 3 | 437 (37.7%) | ||
| 4 | 356 (30.7%) | ||
| GOLD quadrant stages | A | 106 (9.2%) | |
| B | 260 (22.4%) | ||
| C | 115 (9.9%) | ||
| D | 678 (58.5%) | ||
| CAT, score | 18 (12, 24) | 0:37 | |
| MRC, score | 3 (3, 3) | 0:4 | |
| 6MWT, meters | 300 (200, 400) | 0:635 | |
| 6MWT % prd | 64.1 (43.1, 83) | 0:174.3 | |
Legend: Categorical variables distribution is described as absolute and relative frequency (%), quantitative variables distribution by median (25th, 75th percentiles), minimum and maximum values (Min:Max).
Abbreviations. BMI: Body Mass Index; BODE: body-mass index, airflow obstruction, dyspnea, and exercise capacity index; LoS: length of stay; CRF: chronic respiratory failure; LAMA: long acting muscarinic antagonist; LABA: long acting beta agonist; ICS: inhaled corticosteroids; CIRS: Comorbidity Index of Cumulative Illness Rating Scale; BI: Barthel Index; BId: Barthel Index dyspnea; FEV1: forced expiratory volume at one second; FVC: forced vital capacity; prd: predicted; GOLD: Global Initiative for Obstructive Lung Disease; CAT: COPD assessment test; MRC: Medical Research Council; 6MWT: six-minute walking distance test.
Performances of ML methods in predicting post-PR changes in outcome measures using values at admission of explanatory variables (reported in Supplementary Table 1) were assessed and compared on training set data (n=811) as described in Supplementary material. The evaluated approaches showed similar median prediction error estimates (Supplementary material – Supplementary Fig. 1).
Quantile regression coupled with a backward features selection approach based on statistical significance (QR-p) was selected as the most suitable method to predict changes (Supplementary material – Supplementary Fig. 2).
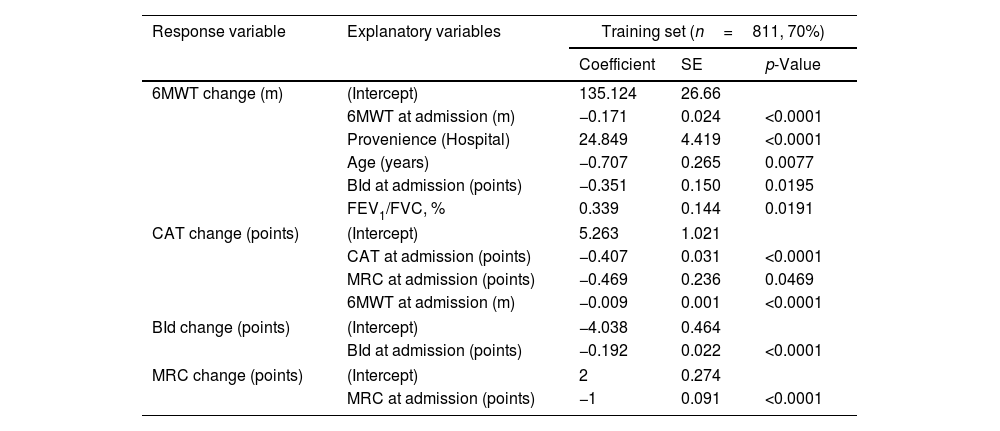
Regression coefficients estimated by the four outcome-specific multivariate regressions on the whole training set using post-PR changes in outcomes are reported in Table 2.
Quantile regression models predicting 6MWT, CAT, BId, and MRC change values.
| Response variable | Explanatory variables | Training set (n=811, 70%) | ||
|---|---|---|---|---|
| Coefficient | SE | p-Value | ||
| 6MWT change (m) | (Intercept) | 135.124 | 26.66 | |
| 6MWT at admission (m) | −0.171 | 0.024 | <0.0001 | |
| Provenience (Hospital) | 24.849 | 4.419 | <0.0001 | |
| Age (years) | −0.707 | 0.265 | 0.0077 | |
| BId at admission (points) | −0.351 | 0.150 | 0.0195 | |
| FEV1/FVC, % | 0.339 | 0.144 | 0.0191 | |
| CAT change (points) | (Intercept) | 5.263 | 1.021 | |
| CAT at admission (points) | −0.407 | 0.031 | <0.0001 | |
| MRC at admission (points) | −0.469 | 0.236 | 0.0469 | |
| 6MWT at admission (m) | −0.009 | 0.001 | <0.0001 | |
| BId change (points) | (Intercept) | −4.038 | 0.464 | |
| BId at admission (points) | −0.192 | 0.022 | <0.0001 | |
| MRC change (points) | (Intercept) | 2 | 0.274 | |
| MRC at admission (points) | −1 | 0.091 | <0.0001 | |
Legend. Response variable=response variable in each quantile regression model; Explanatory variables=independent variables measured at admission selected as informative with respect to each dependent variable by the backward features selection approach; Coefficient=quantile regression coefficient corresponding to each explanatory variable; SE=standard error corresponding to the regression coefficients; p-value=p-value corresponding to the regression coefficients. As an example, regression coefficients can be used to predict 6MWT change for a patient characterized by 6MWT at admission=192m, provenience=hospital, age=59 years, BId=35 points and FEV1/FVC=50% by the following formula: 135.124 [Intercept]−0.171×192 [6MWT at admission=192m]+24.849×1 [Provenience=Hospital]−0.707×59 [Age=59 years]−0.351×35 [BId=35 points]+0.339×50 [FEV1/FVC=50%]=∼+90m. CAT, BId, and MRC change values can be predicted analogously by the corresponding coefficients and variables. BId: Barthel Index dyspnea; CAT: COPD assessment test; MRC: Medical Research Council; 6MWT: six-minute walking distance test; FEV1: forced expiratory volume at one second; FVC: forced vital capacity; m: meters.
Multivariate regression allowed estimating a post-PR 0.17m reduction in median 6MWT change for every meter of 6MWT at admission (p-value<0.0001). Similarly, for every year increase in age and every point in admission BId, we expected a reduction in median post PR 6MWT change by −0.71 and −0.35m respectively (p<0.05). On the opposite, for each unit FEV1/FVC, % a 0.34-m increase in post-PR median 6MWT change was predicted (p=0.0191). Also, individuals from hospitals showed a 24.85-m increase in median post-PR change in 6MWT compared to individuals from home (p-value<0.0001).
The corresponding equation to be used to predict 6MWT post PR change is the following: 6MWT post PR change (meters)=135.124−0.171×6MWT at admission (m)+24.849×Provenience (Hospital=1, Home=0)−0.707×Age (years)−0.351×BId at admission (points)+0.339×FEV1/FVC %.
Taken together, these results indicate that the higher is the baseline exercise limitation, the higher is the improvement. Aged as well as dyspnoeic individuals share a lower predicted improvement, while individuals with less severe airway obstruction as well as those admitted from hospitals have larger potential improvements in exercise capacity. Multivariate explainability analyses identified 6MWT at admission (meters) as the strongest predictor of post-PR changes in 6MWT, followed by provenience from the hospital, age, BId, and FEV1/FVC, % at admission.
Prediction of changes in CATEach point of CAT and MRC and each meter of 6MWT at admission correspond to a decrease in the post-program median change in CAT by −0.41, −0.47, and −0.01 points respectively (p<0.05, Table 2).
The equation is the following: CAT post PR change (points)=5.263−0.407 * CAT at admission (points)−0.469*MRC at admission (points)−0.009*6MWT at admission (m).
Thus, individuals with more disease impact, more dyspnea, and more exercise limitation have a greater potential improvement in CAT. Multivariate explainability analyses revealed that CAT at admission was the strongest predictor of post-PR changes in CAT, followed by 6MWT and MRC at admission.
Prediction of changes in BId and MRCSimilarly, each point increase in BId and MRC at admission corresponds to a post-PR decrease by −0.19 and −1 points in median BId and MRC, respectively (p-value<0.0001, Table 2).
The corresponding equations are the following:
- a)
BId post PR change (points)=−4.038−0.192*BId at admission (points)
- b)
MRC post PR change (points)=2−1*MRC at admission (points)
Individuals with more severe dyspnea during Activity daily life (ADL) at admission are more prone to improve.
Predicting quantitative outcomes after PRThe ability of the four regression models to correctly predict post-PR changes in outcomes was then assessed on the independent test set data (n=348). Mean absolute error estimates of the four models were 44.70m, 3.22 points, 5.35 points, and 0.32 points for 6MWT, CAT, BId and MRC.
Fig. 1 shows remarkable discrepancies between predicted and observed post PR changes in outcomes, especially for low and high observed outcome distribution values, particularly for 6MWT and BId. In detail, in comparison to the observed post-PR changes in 6MWT ranging between −243 and +348m, the spectrum of predicted values of change in 6MWT is narrower, ranging between −8 and +139m. Similarly, observed changes in BId ranged between −68 and +11 points, whereas predicted changes ranged between −21 and −4 points. Post-PR changes in CAT ranged between −27 and +4 points, as compared to predicted values between −15 and +1 points. Predicted post-PR changes in MRC ranged between −3 and +1 points, whereas observed changes ranged between −2 and +2 points.

Comparison between observed and predicted outcome variables change on the test set. Legend. Black dots represent pointwise predictions while gray lines represent the corresponding 95% confidence intervals; diagonal dashed lines represent the theoretical condition of perfect agreement between observed and predicted values. Abbreviations. 6MWT: six-minute walking distance test; CAT: COPD assessment test; BId: Barthel Index dyspnea; MRC: Medical Research Council; m: meters.
Fig. 2 shows MAE and outcome changes by five intervals characterized by approximately equal frequency of participants (quintiles) based on outcome variables distribution at admission. Prediction error tends to be higher for participants with lower 6MWT, as well as higher CAT and BId values at admission, with these subsets of participants characterized by the largest median post-PR changes.
 by quintile of outcome variables distribution at admission (6MWT, CAT, and BId) or by MRC value characterizing the evaluated machine learning methods. MRC changes have been not analyzed by quintiles of MRC at admission but by pooling values at admission between 0 and 2 to define approximately balanced intervals. The three boxplots in panels E–H describe the outcomes’ change between admission and discharge distribution by quintile of outcome variables distribution at admission. Each boxplot describes from bottom to top: the lowest non-outlier value/minimum value; 25th percentile; median value; 75th percentile and the highest non-outlier value/maximum value; outliers are depicted as dots. The black continuous horizontal line corresponds to the condition of no change between admission and discharge; the black dashed horizontal line corresponds to the MCID value for each outcome variable and gray-shaded areas correspond to the condition of MCID achievement. Abbreviations. 6MWT: six-minute walking distance test; CAT: COPD assessment test; BId: Barthel Index dyspnea; MRC: Medical Research Council; m: meters; CRF: chronic respiratory failure.")
Prediction error and outcome change from admission by intervals of outcome variables at admission. Legend. The three lines plots in panels A–D describe graphically the Mean Absolute Error (MAE) by quintile of outcome variables distribution at admission (6MWT, CAT, and BId) or by MRC value characterizing the evaluated machine learning methods. MRC changes have been not analyzed by quintiles of MRC at admission but by pooling values at admission between 0 and 2 to define approximately balanced intervals. The three boxplots in panels E–H describe the outcomes’ change between admission and discharge distribution by quintile of outcome variables distribution at admission. Each boxplot describes from bottom to top: the lowest non-outlier value/minimum value; 25th percentile; median value; 75th percentile and the highest non-outlier value/maximum value; outliers are depicted as dots. The black continuous horizontal line corresponds to the condition of no change between admission and discharge; the black dashed horizontal line corresponds to the MCID value for each outcome variable and gray-shaded areas correspond to the condition of MCID achievement. Abbreviations. 6MWT: six-minute walking distance test; CAT: COPD assessment test; BId: Barthel Index dyspnea; MRC: Medical Research Council; m: meters; CRF: chronic respiratory failure.
In detail, MAE characterizing quantile regression predicting 6MWT at discharge was 67.59m in individuals with admission 6MWT<173m (median 6MWT change=+92.5m) whereas 30.47m in those with admission 6MWT between 423 and 600m (median 6MWT change=+25.5m) (Fig. 2A and E).
When predicting CAT at discharge, MAE was 2.11 points in individuals with admission CAT<11 (median CAT change=−2.5 points), increasing up to 4.98 points in those with CAT ranging from 25 to 35 (median CAT change=−10 points) (Fig. 2B and F).
Similarly, MAE was 3.01 points in people with admission BId<13 (median BId change=−3 points), increasing up to 10.35 points in those with admission BId ranging from 43 to 89 (median BId change=−12 points) (Fig. 2C and G).
No interpretable trend in MAE was observed when analyzing predictions for MRC (Fig. 2D and H).
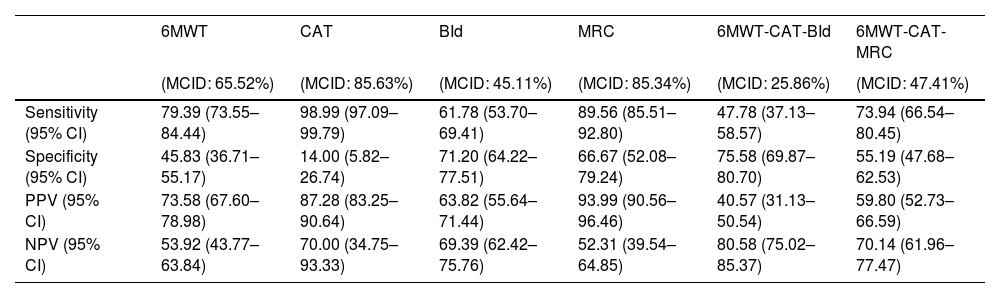
Predicting the reaching of MCID after PRPost PR changes in outcomes have been discretized into binary values, indicating whether a participant reached the MCID or not. Performances in discriminating participants reaching from those not reaching MCID for the four outcomes are depicted in Table 3 and show sensitivity ranging from 61.78% to 98.99%, PPV ranging from 63.82% to 93.99%, specificity ranging from 14.00% to 71.20% and NPV ranging from 52.31% to 70.00%. The ability of quantitative predictions of post-PR changes to correctly identify participants reaching the MCID for the combination of outcomes was also assessed (Table 3).
Performances in identifying patients reaching MCID for single and combined outcome variables on the test set.
| 6MWT | CAT | BId | MRC | 6MWT-CAT-BId | 6MWT-CAT-MRC | |
|---|---|---|---|---|---|---|
| (MCID: 65.52%) | (MCID: 85.63%) | (MCID: 45.11%) | (MCID: 85.34%) | (MCID: 25.86%) | (MCID: 47.41%) | |
| Sensitivity (95% CI) | 79.39 (73.55–84.44) | 98.99 (97.09–99.79) | 61.78 (53.70–69.41) | 89.56 (85.51–92.80) | 47.78 (37.13–58.57) | 73.94 (66.54–80.45) |
| Specificity (95% CI) | 45.83 (36.71–55.17) | 14.00 (5.82–26.74) | 71.20 (64.22–77.51) | 66.67 (52.08–79.24) | 75.58 (69.87–80.70) | 55.19 (47.68–62.53) |
| PPV (95% CI) | 73.58 (67.60–78.98) | 87.28 (83.25–90.64) | 63.82 (55.64–71.44) | 93.99 (90.56–96.46) | 40.57 (31.13–50.54) | 59.80 (52.73–66.59) |
| NPV (95% CI) | 53.92 (43.77–63.84) | 70.00 (34.75–93.33) | 69.39 (62.42–75.76) | 52.31 (39.54–64.85) | 80.58 (75.02–85.37) | 70.14 (61.96–77.47) |
Legend. Point estimate (95% confidence interval) of Sensitivity, Specificity, Positive Predictive Value (PPV), and Negative Predictive Value (NPV) on the independent test set are reported for 6MWT, CAT, BId, MRC, and for the combination of 6MWT-CAT-BId and 6MWT-CAT-MRC outcomes. Percentages within brackets in the title line correspond to the frequency of patients reaching MCID for the outcomes. Abbreviations. 6MWT: six-minute walking distance test; CAT: COPD assessment test; BId: Barthel Index dyspnea; MRC: Medical Research Council; MCID: minimal clinically important difference.
Sensitivity, PPV, specificity and NPV in predicting the combined 6MWT-CAT-BId outcomes were 47.78%, 59.80%, 75.58%, and 80.58% respectively, with a 25.86% proportion of participants reaching MCID for 6MWT, CAT, and BId.
Sensitivity, PPV, specificity, and NPV in predicting the combined 6MWT-CAT-MRC outcome were 73.94%, 59.8%, 55.19% and 70.14% respectively, with a 47.41% proportion of participants reaching MCID for 6MWT, CAT, and MRC.
These results suggest a better capacity to accurately discriminate between individuals reaching or not the MCID of MRC as compared to BId. Consequently, there is a higher probability of correctly detecting individuals reaching the MCID for the combined 6MWT-CAT-MRC concerning the 6MWT-CAT-BId outcome.
DiscussionOur large, multicentric, retrospective study explored multivariate approaches to predict the responses of common outcomes to an in-hospital PR program in individuals recovering from an ECOPD. The response was assessed using simple and interpretable equations to predict quantitative changes in outcomes and, indirectly, the individual level of capability to reach the MCID. Results confirm that individuals with worse baseline conditions are better responders to PR. Despite assessed models not reaching sufficiently high predictive performances to be recommended as a “screening” tool in a clinical setting, our study suggests a potential methodology to predict the response to define priority criteria for admission to PR.15
Machine learning offers the possibility to predict clinical outcomes of interest by interpreting heterogeneous data sources.9 However, the predictions obtained in our study demonstrated poor performances deserving a comment. This result might be due to at least three factors: (1) heterogeneity of participants’ condition, corresponding to different probabilities of successful PR; (2) potential incomplete information provided by the set of variables commonly collected at admission; (3) limited spectrum of ML methods tested. Only ML methods generating decisional rules (i.e., tree-like algorithms) or models that can be easily interpreted as regression equations (i.e., linear and quantile regression methods) were evaluated, to generate rules easily implementable and interpretable in daily clinical practice. More complex and promising models (e.g., Random Forests, Support Vector Machines, and Neural Networks) were not tested in our study and we cannot exclude that using different approaches the performance in prediction might be higher.
In an era where health economic resources are shrinking, and there is a growing recognition of the need for appropriateness and personalization of care, the development of prediction models becomes crucial. Tailoring programs and optimizing resources for individuals with higher probabilities of success are essential considerations.28,29 In addition, the effectiveness of PR, as shown in our study (at least for the assessed program), is related to the characteristics of candidates. Prediction models might assist clinicians in defining the priority of PR prescription based on objective and measurable parameters of the disease. The development of a dedicated equation tool could provide specialists, GPs, and healthcare providers with a common language for both clinical and administrative purposes, enabling them to prioritize PR access.
While we did not evaluate physical activity,30 the outcome measures assessed in this study (dyspnea, exercise capacity, disease impact) target the goals of PR with evidence of effectiveness. These measures are not only widely accepted for PR but are also recommended in an outcome set for clinical trials evaluating the management of ECOPD.31,32
We assessed responses in physiological outcomes, just a component of program success and used the MCID to define responders. Our findings suggest that baseline presentation should be considered when assessing the efficacy of PR. However, the clinical significance of the variation underpinning MCID is yet to be determined.33 In most studies, responders have been defined as individuals showing a meaningful response in one specific outcome such as exercise capacity.34 Nevertheless, response in one particular dimension does not guarantee to be a responder in another one. Multidimensional response outcomes have been proposed.35,36
Our study focused on individuals after an ECOPD confirming the short terms benefits of PR, including the proportion of responders.15 Despite relevant improvements in management, the natural course of ECOPD remains unchanged with effects beyond lung function, highlighting the importance of PR.5
We defined 12 sessions as the minimum attendance rate for program completion based on our previous report: a shorter (10–12 sessions) in-patient program resulted in improvement in exercise tolerance and symptoms similar to a longer out-patient program.17 Data of individuals excluded due to transfer to an acute hospital or death or performing less than 12 sessions, were too few for any further analysis. The retrospective design prevented any assessment of causes of the negligible number of individuals not completing the program. Lack of motivation would have been improbable in individuals admitted to hospitals specialized in PR. The in-hospital program excludes lack of accessibility among the causes of non-completion.
LimitationsThe prediction models of different issues in PR have been addressed also in a few prospective studies.37,38 The main limitations of our study are related to its retrospective design. However, in addition to the relatively new approach of analysis, our study represents a real-life condition, and its results are supported by the large sample size at a time when even randomized controlled trials are being questioned.39
A control population not performing PR would have clarified whether any improvement would have been (also) time-dependent. However, given recognized benefits and mission of our hospitals, not performing PR would have been unaethical.
ConclusionsWhile assessed models did not achieve complete satisfaction, information from clinical practice and predictive equations might help in predicting response to PR in individuals recovering from an ECOPD. Larger studies should confirm methodology, variables, and utility. Therefore our study should be interpreted as preliminary, offering potential hypotheses for future research rather than providing a ready-to-use “screening” clinical tool.
Authors’ contributionsMV and NA conceived and designed the study. MV, AM, and NA contributed to the writing of the manuscript. AM performed formal analysis and visualization. MV, AS, PC, AC, and RM were responsible for investigations. MV, AM, MP, and NA participated in the analysis and discussion of the data. All the authors revised the article critically and approved the final version.
Data availability statementData are available from the corresponding author upon reasonable request.
Funding sourcesThis research did not receive any specific grant from funding agencies in the public, commercial, or not-for-profit sectors.
Conflict of interestThe authors declare they have no conflict of interest.
The authors thank the Maugeri Respiratory Network for data collection/evaluation and Adriana Olivares and Laura Comini for their technical assistance and editing.
This work was supported by the “Ricerca Corrente” Funding scheme of the Ministry of Health, Italy
The following are the supplementary data to this article:


