The quality of life (QoL) in patients with chronic obstructive pulmonary disease (COPD), a condition largely caused by smoking, is usually adversely affected.1 Associated comorbidities contribute to disease severity and lead to poorer QoL.1 Over the last 15 years, awareness of nasal inflammation in COPD has increased,2 and the estimated prevalence of upper airway symptoms vary from 40% to 88%.3–6 The presence of upper airway symptoms negatively affects the already poor QoL.5–9
The aim of this study is to determine the incidence of upper airway symptoms in patients with COPD and its impact on QoL. Newly referred symptomatic smokers over 35 years of age with COPD according to the Global Initiative for Chronic Obstructive Lung Disease guidelines1 were included. The incidence of upper airway symptoms was assessed on the basis of the Allergic Rhinitis and its Impact on Asthma10 workshop report. The study variables were: respiratory symptoms, upper airway symptoms, spirometry with reversibility, peripheral blood eosinophil count, and computed tomography of paranasal sinuses (CT-PNS). CT-PNS was scored in accordance with the Lund-Mackay staging system.11 QoL in patients with upper airway symptoms was assessed using the St. George's Respiratory Questionnaire (SGRQ)12 and Sino Nasal Outcome Test-22 (SNOT-22) questionnaire.13 Patients were divided into 2 groups: Group 1, COPD with upper airway symptoms; and Group 2, COPD without upper airway symptoms (controls). Radiological sinusitis was defined in accordance with the European Position Paper on Rhinosinusitis and Nasal Polyps 2012 criteria14 along with CT-PNS findings. All patients gave their informed, written consent. The study was approved by the institutional research ethics committee. Data were analyzed using SPSS (version 11.5, SPSS, Inc., Chicago, IL). Chi-Square, Student's t-test and Pearson's correlation test were used for data analysis. A significance level of P<.05 was accepted for all analysis.
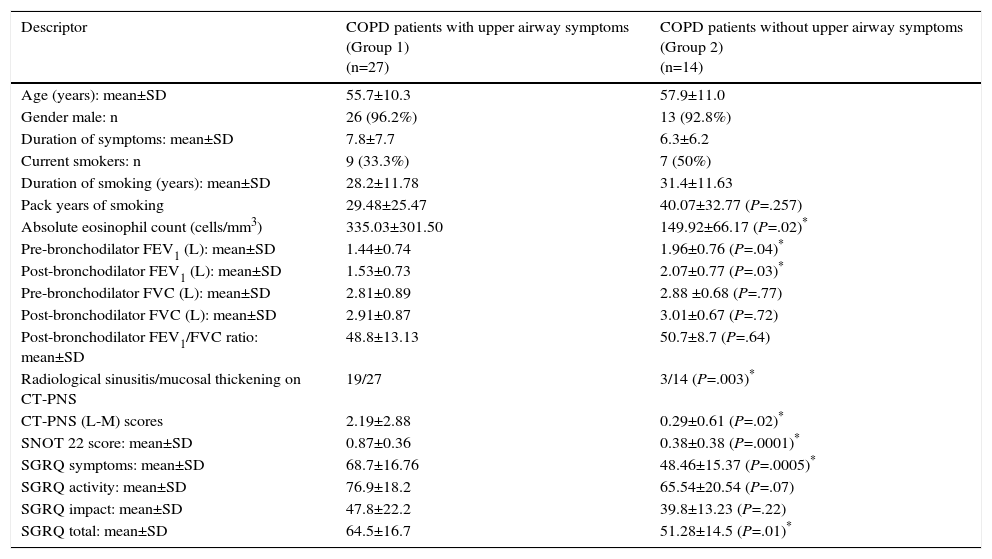
Nearly two-thirds (27/41; 65.9%) of patients with COPD had upper airway symptoms (Group 1). These patients presented with higher peripheral blood eosinophilia, more severe lower airway obstruction, and an increased incidence of sinusitis on CT-PNS. They also reported a significantly poorer QoL on the SGRQ and SNOT-22 questionnaires (Table 1).
Patient Demographics, Baseline Characteristics and Quality of Life Scores.
| Descriptor | COPD patients with upper airway symptoms (Group 1) (n=27) | COPD patients without upper airway symptoms (Group 2) (n=14) |
|---|---|---|
| Age (years): mean±SD | 55.7±10.3 | 57.9±11.0 |
| Gender male: n | 26 (96.2%) | 13 (92.8%) |
| Duration of symptoms: mean±SD | 7.8±7.7 | 6.3±6.2 |
| Current smokers: n | 9 (33.3%) | 7 (50%) |
| Duration of smoking (years): mean±SD | 28.2±11.78 | 31.4±11.63 |
| Pack years of smoking | 29.48±25.47 | 40.07±32.77 (P=.257) |
| Absolute eosinophil count (cells/mm3) | 335.03±301.50 | 149.92±66.17 (P=.02)* |
| Pre-bronchodilator FEV1 (L): mean±SD | 1.44±0.74 | 1.96±0.76 (P=.04)* |
| Post-bronchodilator FEV1 (L): mean±SD | 1.53±0.73 | 2.07±0.77 (P=.03)* |
| Pre-bronchodilator FVC (L): mean±SD | 2.81±0.89 | 2.88 ±0.68 (P=.77) |
| Post-bronchodilator FVC (L): mean±SD | 2.91±0.87 | 3.01±0.67 (P=.72) |
| Post-bronchodilator FEV1/FVC ratio: mean±SD | 48.8±13.13 | 50.7±8.7 (P=.64) |
| Radiological sinusitis/mucosal thickening on CT-PNS | 19/27 | 3/14 (P=.003)* |
| CT-PNS (L-M) scores | 2.19±2.88 | 0.29±0.61 (P=.02)* |
| SNOT 22 score: mean±SD | 0.87±0.36 | 0.38±0.38 (P=.0001)* |
| SGRQ symptoms: mean±SD | 68.7±16.76 | 48.46±15.37 (P=.0005)* |
| SGRQ activity: mean±SD | 76.9±18.2 | 65.54±20.54 (P=.07) |
| SGRQ impact: mean±SD | 47.8±22.2 | 39.8±13.23 (P=.22) |
| SGRQ total: mean±SD | 64.5±16.7 | 51.28±14.5 (P=.01)* |
COPD: chronic obstructive pulmonary disease; FEV1: forced expiratory volume in one second; FVC: forced vital capacity; L: liters; L-M: Lund-Mackay; SD: standard deviation; SGRQ: St. George's Respiratory Questionnaire; SNOT-22: Sino Nasal Outcome Test-22.
In Group 1, patients with radiological sinusitis, moderate positive correlation was observed between CT-PNS (Lund-Mackay) and SNOT-22 QoL scores (r=0.58; P=.009). Furthermore, a positive correlation was observed between nasal symptoms based on SNOT-22 and more general SGRQ scores in these patients (r=0.41; P=.03).
The incidence of upper airway symptoms in different studies ranges from 40% to 88%.3–6 Three-quarters of the 61 patients with moderate-to-severe COPD from the East London COPD (ELCOPD) study cohort presented at least 1 nasal symptom.4 An inverse relationship was established between nasal patency in COPD and severity of airflow obstruction.15 In our series, patients with upper airway symptoms also presented with more severe lower airway obstruction.
Radiological sinusitis was documented in 19/27 (70.4%) Group 1 patients. QoL scores were consistent with findings from other studies.3,6–8 The ELCOPD study3 reported a mean SNOT-20 score of 1.24, showing that nasal symptoms impaired QoL. The higher symptom, total SGRQ and SNOT-22 scores showed significantly poorer QoL in Group 1 patients, highlighting the adverse impact of upper airway symptoms in patients with COPD. A positive correlation was observed between SNOT-22 and total SGRQ scores in Group 1 patients, indicating a negative impact on overall QoL. In the 19 patients with sinusitis on CT-PNS in Group 1, CT-PNS scores showed a moderately strong positive correlation with SNOT-22 scores, which is consistent with a previous study.8 The small sample size in our study was a limitation.
This study highlights the incidence and significant impact of upper airway symptoms on QoL in patients with COPD. It is therefore imperative to determine upper airway involvement in patients with COPD, as this may lead to suboptimal control of the disease.
FundingThis study was funded by the Vallabhbhai Patel Chest Institute, University of Delhi, Delhi.


