Journal Information
Share
Share
Download PDF
More article options
Visits
250
Original Article
Full text access
Available online 17 December 2024
Evaluation of the Effectiveness of Global Tuberculosis Control Strategies at Different Stages and Analysis of Risk Factors: Findings From the Global Burden of Disease 2021
Visits
250
Jinyi Wua,b, Pei Xiaoc, Yue Zhangd, Peng Penga,
Corresponding author
pengpengwg@126.com

Corresponding author.
a Department of Public Health, Wuhan Fourth Hospital, Wuhan 430030, Hubei, China
b School of Public Health, Fudan University, Shanghai 200030, China
c Center for Non-communicable Disease Management, Beijing Children's Hospital, Capital Medical University, National Center for Children's Health, Beijing 100045, China
d School of Public Health, Shanxi Medical University, Key Laboratory of Coal Environmental Pathogenicity and Prevention, Ministry Education, Taiyuan 030001, Shanxi, China
This item has received
Article information
Abstract
Full Text
Bibliography
Download PDF
Statistics
Figures (12)
Show moreShow less
Tables (2)
Table 1. Different Disease Burden of TB Progress Indicators. Disease Burden of TB Under Different WHO Control Strategies.
Table 2. Main Risk Factors Annual Average Percent Change for ASDR.
Show moreShow less
Additional material (2)
Abstract
Background

The purpose of this study was to analyze the prevention and control effects of the three-phase global tuberculosis control strategy, and analyze the influencing factors.

Methods

We collected age-standardized incidence, prevalence, and mortality (ASIR, ASPR, and ASDR) data from the Global Burden of Disease Study (GBD 2021) database. Annual percentage change (AAPC) of ASIR, ASPR and ASDR were analyzed by Joinpoint regression. Correlation and decomposition analyses explored related epidemiological factors.

Results

At the global level, in the first phase Directly-Observed Treatment Strategy (DOTS), the annual reduction in incidence was 1.18%, and prevalence was 0.71%. In the second phase Stop TB, the cumulative mortality decrease was 56.44% which met the desired goal. However, the cumulative decrease of prevalence was only 20.45%. In the third phase End TB, annual rate of reduction in mortality was 3.33%, while the annual rate of reduction in incidence was 1.14%. ASPR showed a large decrease in both low socio-demographic index (SDI) and high SDI regions, the decrease in medium SDI region was small, which might be dominated by demographic factors at the DOTS stage, changed to epidemiologic in the Stop TB stage and to aging factors in the End TB stage.

Conclusion

The control of TB morbidity and mortality had a great achievement in all the 3 different phases of the TB control strategy, and a concerted global effort is still needed in phase 3 to reach the END TB goal. TB prevalence control needs to be emphasized, especially in the middle and high SDI areas.

Keywords:
Global TB control strategies
Tuberculosis
Risk factors
GBD 2021
Prevention strategy
Abbreviations:
TB
ASDR
ASIR
ADPR
GBD
AAPC
APC
SDG
WHO
SDI
DOTS
BMI
Full Text
Introduction

Tuberculosis (TB) remains one of the world's greatest threats.1 The World Health Organization's Global Tuberculosis Report 2023 estimated that there were 10.6million new cases of TB globally in 2022, with an incidence of 133 per 100,000, and a 3.9% increase of incidence between 2020 and 2022.2 Furthermore, epidemics of novel coronavirus infections have a much greater impact on TB mortality than HIV/AIDS.3

Looking back at the history of global targets for TB, in 1991, the World Health Assembly set a global target for the year 2000: a model-based setting to reduce prevalence and incidence by 5–10% per year.4 This phase of the strategy, known as DOTS (Directly-Observed Treatment Strategy), centered on providing free treatment for sputum-smear-positive TB patients and using an intensive period of supervised management of the treatment after an initial positive smear.5 Subsequently, in 2006 WHO proposed the Stop TB strategy, which aimed to reduce the prevalence of TB and the mortality rate of TB by half from the 1990 level by 2015.6,7 This strategy significantly expanded the scope of TB prevention and control, not only targeting highly contagious TB, but also strengthening the rigorous management and prevention of non-contagious TB.8,9 Also in 2014, the 67th World Health Assembly endorsed the WHO END TB strategy and the Sustainable Development Goals (SDGs), which is a strategy for eliminating TB, with a focus on the prevention and the treatment of TB.10,11 The common aim was to reduce TB deaths by 95% between 2015 and 2035, reduce new TB cases by 90%, and the annual reduction should be at least 7%.12–14 The scope of prevention and control of this stage extends beyond pulmonary TB to include extra pulmonary TB, close contacts of TB, and latent infections in high-risk groups, achieving broader coverage.15,16

Although WHO regularly releases global TB reports, so far, limited study based on GBD data analyzed and evaluated TB prevention and control strategies with its risk factors at different stages, the possible influencing factors at different stages. Analyzing the evaluation of the effectiveness of TB prevention and control in different stages and summarizing the experience has theoretical and practical significance for the optimization of future actions. Therefore, we conducted this study.

MethodsOverview of GBD and World Bank

GBD 2021 combines a variety of data sources, including censuses, household surveys, civil registration and vital statistics, disease registries, health service use, air pollution monitoring, satellite imagery, disease notifications, and other sources, each of which is assigned an unique identifier and included in the Global Health Data Exchange database (GHDx).2,17,18

GBD2021 is the latest version of the regularly updated GBD series, which uses available data to assess health losses due to 369 diseases, injuries, risk factors, impairments, and causes of death by age and sex in 204 countries or territories. The GBD employs a comprehensive Meta-regression framework to deal with the scarcity and heterogeneity of the data, which provides multiple, interrelated indicators to measure the burden of disease, including incidence, prevalence, mortality.

Meta-regression analysis-Bayesian, regularized, and pruned models were used to adjust for uncertainty and prune outliers from the included datasets, and DisMod-MMR 2.1 was used to ensure consistency between parameters. Sex ratios derived from meta-analysis of available sex-specific data from other TB datasets using the meta-regression tool MRTool (0.0.1.4). GBD data sources were aggregated by the University of Washington Institute for Health Metrics and Evaluation. In addition, informed consent waivers were reviewed and approved by the University of Washington Institutional Review Board.

Data Extraction

The data used in this study came from the GBD 2021 study (https://vizhub.healthdata.org/gbd-results/). The metrics downloaded were age-standardized incidence, prevalence, and mortality rate (ASIR, ASPR, ASDR). At the same time, we downloaded socio-demographic index (SDI) and demographic data for 204 countries globally from 1990 to 2021.

Analysis of Temporal Trends

In this study, we calculated ASPR for the global burden of TB. Trends in the burden of disease from 1990 to 2021 were assessed using annual average percentage change (AAPC), which was calculated by the Joinpoint regression program (version 4.9.0.0, March 2021). We make a world map for 204 countries to visualize global TB incidence, prevalence, and deaths (and 95% uncertainty intervals (UIs)) and the corresponding AAPCs under different strategies. The 95% UI was calculated by taking 1000 draws from the posterior distribution of each quantity, using 2.5 and 97.5 ordered draws from the uncertainty distribution.

Analysis of Risk Factor

To analyze the risk factors for changes in TB under different prevention and control strategies. We performed SDI correlation and decomposition analysis. In the analysis of SDI correlation, we analyzed ASIR, ASPR, ASDR and SDI separately for scatter trend correlation. In the decomposition analysis, we analyzed the 3 key indicators at different stages to determine the relative contribution of population growth, population aging, and demographically unrelated prevalence changes to changes in the number of cases. In addition, we analyzed 4 lifestyle factors related with TB, including tobacco, alcohol, physical activity and high body mass index.

ResultsGlobal Burden and Specific Period Trend Analysis

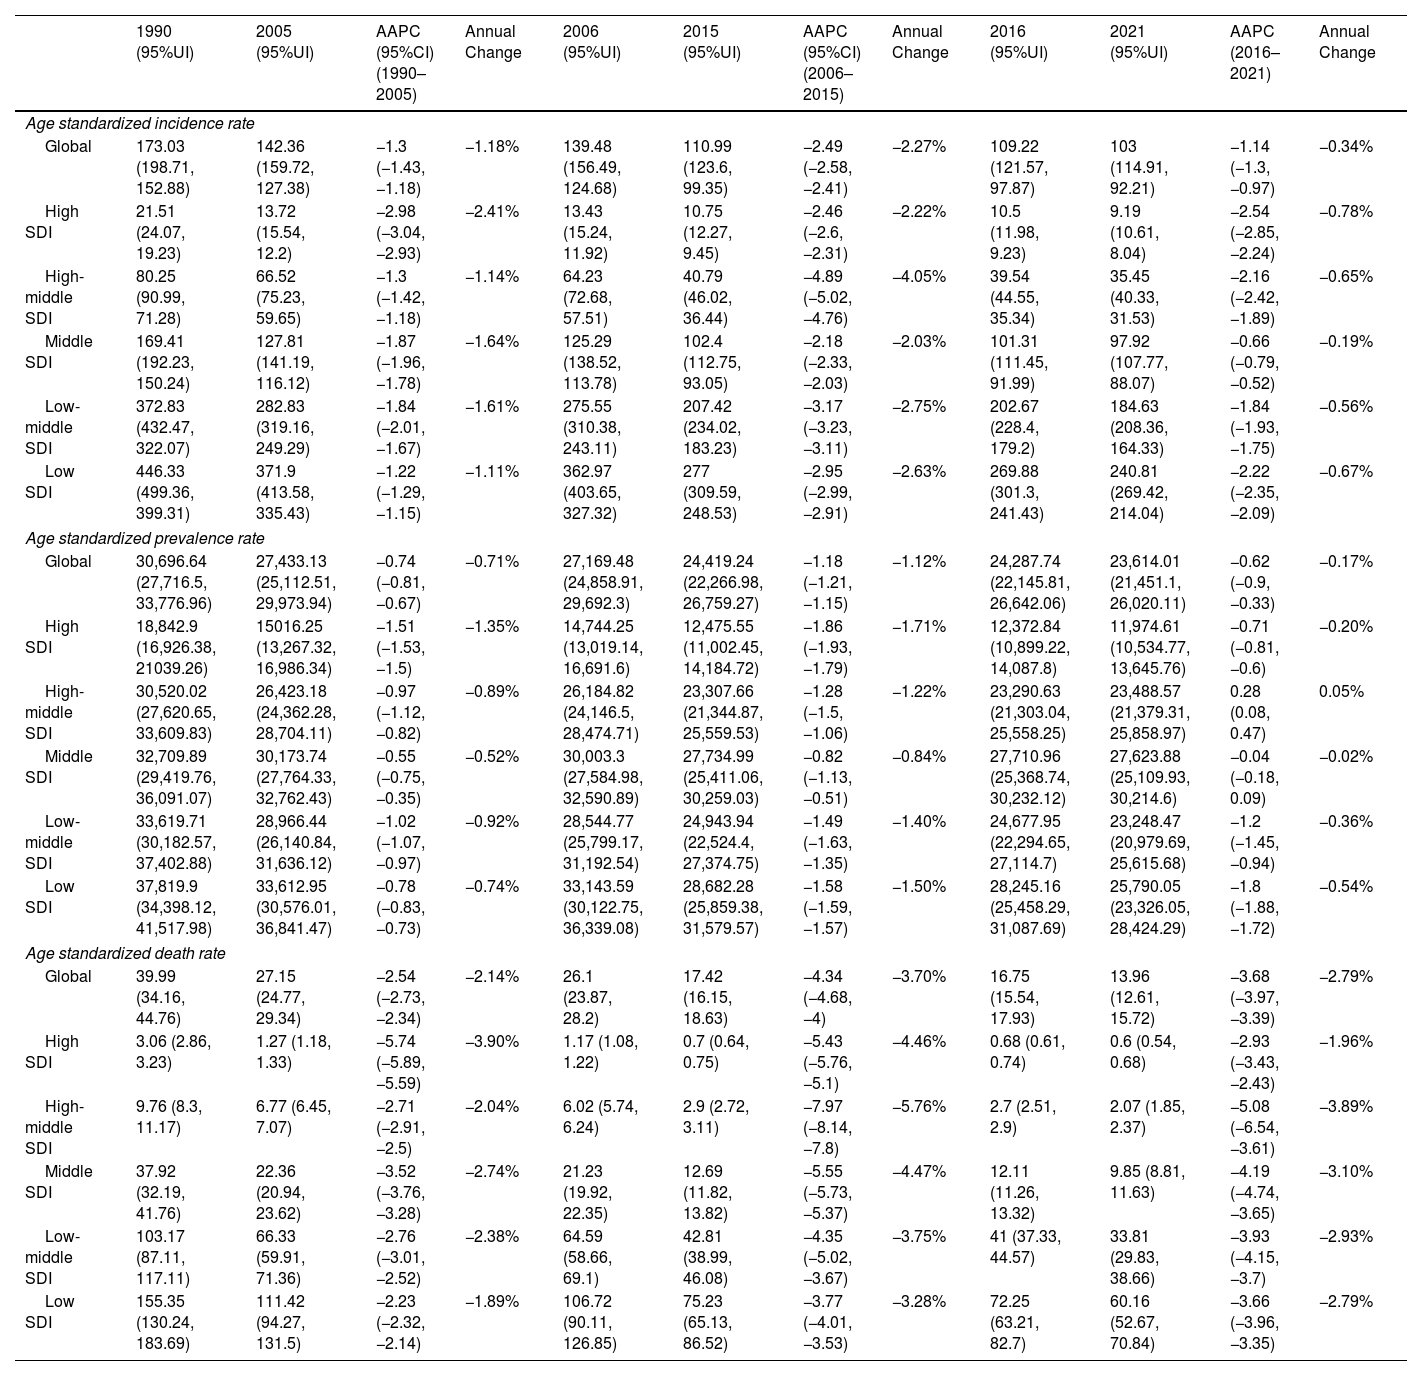
Table 1 demonstrates the AAPC and annual change in incidence, prevalence and mortality under three different control strategies. At the global level, the first phase DOTS, with the goal of reducing prevalence and incidence by 5–10% per year, shows from the results that the annual reduction in incidence in the first phase was 1.18%, and in prevalence was 0.71%. In the second phase Stop TB, the proposed goal was to reduce the prevalence and mortality rate of tuberculosis by 1/2 from the 1990 level by the year 2015. Fortunately, the mortality rate decreased from 39.99 (34.16, 44.76) to 17.42 (16.15, 18.63), a cumulative reduction of 56.44% which met the desired goal. However, the prevalence decreased from 173.03 (198.71, 152.88) to 110.99 (123.6, 99.35) with a cumulative decrease of 20.45%, which is 30% short of the desired goal. In the third phase End TB, the goal is to reduce TB mortality by 95% and new cases by 90% between 2015 and 2035, and the annual rate reduction should be 7%. The results showed that the annual rate of reduction in mortality from 2016–2021 was 3.33%, while the annual rate of reduction in incidence was 1.14%. There is a large gap from the expected target.

Table 1.

Different Disease Burden of TB Progress Indicators. Disease Burden of TB Under Different WHO Control Strategies.

  1990 (95%UI)  2005 (95%UI)  AAPC (95%CI)(1990–2005)  Annual Change  2006 (95%UI)  2015 (95%UI)  AAPC (95%CI)(2006–2015)  Annual Change  2016 (95%UI)  2021 (95%UI)  AAPC (2016–2021)  Annual Change 
Age standardized incidence rate
Global  173.03 (198.71, 152.88)  142.36 (159.72, 127.38)  −1.3 (−1.43, −1.18)  −1.18%  139.48 (156.49, 124.68)  110.99 (123.6, 99.35)  −2.49 (−2.58, −2.41)  −2.27%  109.22 (121.57, 97.87)  103 (114.91, 92.21)  −1.14 (−1.3, −0.97)  −0.34% 
High SDI  21.51 (24.07, 19.23)  13.72 (15.54, 12.2)  −2.98 (−3.04, −2.93)  −2.41%  13.43 (15.24, 11.92)  10.75 (12.27, 9.45)  −2.46 (−2.6, −2.31)  −2.22%  10.5 (11.98, 9.23)  9.19 (10.61, 8.04)  −2.54 (−2.85, −2.24)  −0.78% 
High-middle SDI  80.25 (90.99, 71.28)  66.52 (75.23, 59.65)  −1.3 (−1.42, −1.18)  −1.14%  64.23 (72.68, 57.51)  40.79 (46.02, 36.44)  −4.89 (−5.02, −4.76)  −4.05%  39.54 (44.55, 35.34)  35.45 (40.33, 31.53)  −2.16 (−2.42, −1.89)  −0.65% 
Middle SDI  169.41 (192.23, 150.24)  127.81 (141.19, 116.12)  −1.87 (−1.96, −1.78)  −1.64%  125.29 (138.52, 113.78)  102.4 (112.75, 93.05)  −2.18 (−2.33, −2.03)  −2.03%  101.31 (111.45, 91.99)  97.92 (107.77, 88.07)  −0.66 (−0.79, −0.52)  −0.19% 
Low-middle SDI  372.83 (432.47, 322.07)  282.83 (319.16, 249.29)  −1.84 (−2.01, −1.67)  −1.61%  275.55 (310.38, 243.11)  207.42 (234.02, 183.23)  −3.17 (−3.23, −3.11)  −2.75%  202.67 (228.4, 179.2)  184.63 (208.36, 164.33)  −1.84 (−1.93, −1.75)  −0.56% 
Low SDI  446.33 (499.36, 399.31)  371.9 (413.58, 335.43)  −1.22 (−1.29, −1.15)  −1.11%  362.97 (403.65, 327.32)  277 (309.59, 248.53)  −2.95 (−2.99, −2.91)  −2.63%  269.88 (301.3, 241.43)  240.81 (269.42, 214.04)  −2.22 (−2.35, −2.09)  −0.67% 
Age standardized prevalence rate
Global  30,696.64 (27,716.5, 33,776.96)  27,433.13 (25,112.51, 29,973.94)  −0.74 (−0.81, −0.67)  −0.71%  27,169.48 (24,858.91, 29,692.3)  24,419.24 (22,266.98, 26,759.27)  −1.18 (−1.21, −1.15)  −1.12%  24,287.74 (22,145.81, 26,642.06)  23,614.01 (21,451.1, 26,020.11)  −0.62 (−0.9, −0.33)  −0.17% 
High SDI  18,842.9 (16,926.38, 21039.26)  15016.25 (13,267.32, 16,986.34)  −1.51 (−1.53, −1.5)  −1.35%  14,744.25 (13,019.14, 16,691.6)  12,475.55 (11,002.45, 14,184.72)  −1.86 (−1.93, −1.79)  −1.71%  12,372.84 (10,899.22, 14,087.8)  11,974.61 (10,534.77, 13,645.76)  −0.71 (−0.81, −0.6)  −0.20% 
High-middle SDI  30,520.02 (27,620.65, 33,609.83)  26,423.18 (24,362.28, 28,704.11)  −0.97 (−1.12, −0.82)  −0.89%  26,184.82 (24,146.5, 28,474.71)  23,307.66 (21,344.87, 25,559.53)  −1.28 (−1.5, −1.06)  −1.22%  23,290.63 (21,303.04, 25,558.25)  23,488.57 (21,379.31, 25,858.97)  0.28 (0.08, 0.47)  0.05% 
Middle SDI  32,709.89 (29,419.76, 36,091.07)  30,173.74 (27,764.33, 32,762.43)  −0.55 (−0.75, −0.35)  −0.52%  30,003.3 (27,584.98, 32,590.89)  27,734.99 (25,411.06, 30,259.03)  −0.82 (−1.13, −0.51)  −0.84%  27,710.96 (25,368.74, 30,232.12)  27,623.88 (25,109.93, 30,214.6)  −0.04 (−0.18, 0.09)  −0.02% 
Low-middle SDI  33,619.71 (30,182.57, 37,402.88)  28,966.44 (26,140.84, 31,636.12)  −1.02 (−1.07, −0.97)  −0.92%  28,544.77 (25,799.17, 31,192.54)  24,943.94 (22,524.4, 27,374.75)  −1.49 (−1.63, −1.35)  −1.40%  24,677.95 (22,294.65, 27,114.7)  23,248.47 (20,979.69, 25,615.68)  −1.2 (−1.45, −0.94)  −0.36% 
Low SDI  37,819.9 (34,398.12, 41,517.98)  33,612.95 (30,576.01, 36,841.47)  −0.78 (−0.83, −0.73)  −0.74%  33,143.59 (30,122.75, 36,339.08)  28,682.28 (25,859.38, 31,579.57)  −1.58 (−1.59, −1.57)  −1.50%  28,245.16 (25,458.29, 31,087.69)  25,790.05 (23,326.05, 28,424.29)  −1.8 (−1.88, −1.72)  −0.54% 
Age standardized death rate
Global  39.99 (34.16, 44.76)  27.15 (24.77, 29.34)  −2.54 (−2.73, −2.34)  −2.14%  26.1 (23.87, 28.2)  17.42 (16.15, 18.63)  −4.34 (−4.68, −4)  −3.70%  16.75 (15.54, 17.93)  13.96 (12.61, 15.72)  −3.68 (−3.97, −3.39)  −2.79% 
High SDI  3.06 (2.86, 3.23)  1.27 (1.18, 1.33)  −5.74 (−5.89, −5.59)  −3.90%  1.17 (1.08, 1.22)  0.7 (0.64, 0.75)  −5.43 (−5.76, −5.1)  −4.46%  0.68 (0.61, 0.74)  0.6 (0.54, 0.68)  −2.93 (−3.43, −2.43)  −1.96% 
High-middle SDI  9.76 (8.3, 11.17)  6.77 (6.45, 7.07)  −2.71 (−2.91, −2.5)  −2.04%  6.02 (5.74, 6.24)  2.9 (2.72, 3.11)  −7.97 (−8.14, −7.8)  −5.76%  2.7 (2.51, 2.9)  2.07 (1.85, 2.37)  −5.08 (−6.54, −3.61)  −3.89% 
Middle SDI  37.92 (32.19, 41.76)  22.36 (20.94, 23.62)  −3.52 (−3.76, −3.28)  −2.74%  21.23 (19.92, 22.35)  12.69 (11.82, 13.82)  −5.55 (−5.73, −5.37)  −4.47%  12.11 (11.26, 13.32)  9.85 (8.81, 11.63)  −4.19 (−4.74, −3.65)  −3.10% 
Low-middle SDI  103.17 (87.11, 117.11)  66.33 (59.91, 71.36)  −2.76 (−3.01, −2.52)  −2.38%  64.59 (58.66, 69.1)  42.81 (38.99, 46.08)  −4.35 (−5.02, −3.67)  −3.75%  41 (37.33, 44.57)  33.81 (29.83, 38.66)  −3.93 (−4.15, −3.7)  −2.93% 
Low SDI  155.35 (130.24, 183.69)  111.42 (94.27, 131.5)  −2.23 (−2.32, −2.14)  −1.89%  106.72 (90.11, 126.85)  75.23 (65.13, 86.52)  −3.77 (−4.01, −3.53)  −3.28%  72.25 (63.21, 82.7)  60.16 (52.67, 70.84)  −3.66 (−3.96, −3.35)  −2.79% 

At the GBD region level, ASPR increased in only 3 regions (Central Sub-Saharan Africa. High-income North America and Oceania), with 18 other regions experiencing annual declines ranging from 0.28% to 2.25%. In the second phase of the ASPR only 1 region, Oceania, rose and only 1 region met the target high-income Asia Pacific had a cumulative decline of −50.91%, while Andean Latin America and Central Europe had cumulative declines of −49.25% and −48.56% respectively (Supplementary Table 1).

At the country level, of the 204 countries in Phase I, there were 14 countries experienced an increase in ASPR, and 190 countries experienced annual reductions ranging from 0 to 3.3%. No country reached the set target in the first phase, although a number of countries approached the 5% annual reduction rate. In Phase II, the cumulative change in ASPR was up in 12 countries, with the remaining 192 countries experiencing cumulative reductions ranging from 0.15% to 64.3%, and 16 countries reaching 50% cumulative reductions (Supplementary Table 2).

Fig. 1 shows that number of regions with ASPR>30,000/100,000 population reduced globally, but the decline is not obvious in 2021 compared to 2019. In contrast, ASIR and ASDR, declined in most regions in 2021 compared to 2019 (Supplementary Figs. 1 and 2). Based on the results in Supplementary Fig. 1, we find that between 1990 and 2021, TB ASIR and ASDR declined faster in high, high-moderate, and moderate SDI regions than globally. But, the decline in TB ASPR of the high SDI regions is only higher than the global, and lower or close to the global decline in the other regions.

Fig. 1.

A: ASPR of TB in 1990; B: ASPR of TB in 2019; C: ASPR of TB in 2021. TB: tuberculosis. ASPR: age standardized prevalence rate.

(0.54MB).

The change in ASIR under different strategies is shown in Supplementary Fig. 4, with sub-Saharan Africa, Eastern Europe, and Northern Asia seeing a rise in ASIR during the DOTS phase. Interestingly, however, in the STOP TB phase, Eastern Europe and North Asia show the lowest magnitude of decrease in ASIR. Surprisingly, in the END TB phase, North America shows a significant rise. Overall, North Asia went from a rise in ASDR control in the first stage to a sustained decline in the second and third stages. While North America went from a decline in the first stage, to a decrease in the rate of decline in the second stage, to a rise in the third stage.

The phase changes of ASDR have similarities with ASIR (Supplementary Fig. 5), with Eastern Europe and North Asia showing the most growth in the DOTS phase, and in the STOP TB phase, Eastern Europe and North Asia show a significant decline in ASDR. And in the END TB stage, North America showed an increase in ASDR.

Because of the relatively poor control of ASPR, we focus our analysis on ASPR. Fig. 2 shows that during the DOTS strategy phase, the vast majority of countries experienced a decline in ASPR and most AAPCs were at −2.9 to 0. However, the TB ASPR continued to grow in North America, sub-Saharan Africa, and Southeast Asia. During the STOP TB strategy phase, the vast majority of countries experienced a decline and most AAPCs were in the range of −3.8 to 0. There was a reversal of the ASPR in North America and sub-Saharan Africa, especially in North America, which shifted from positive growth during the DOTS phase to a significant decline during the STOP TB phase. However, in the END TB phase, some populous countries, such as China, India, and the United States, all experienced rebound increase.

Fig. 2.

A: AAPC for ASPR of TB from 1990 to 2005 (DOTS); B: AAPC for ASPR of TB from 2006 to 2015 (stop TB); C: AAPC for ASPR of TB from 2016 to 2021 (end TB). AAPC: annual average percent change. TB: tuberculosis. ASPR: age standardized prevalence rate.

(0.51MB).
SDI Correlation Analysis

The results of SDI correlation analysis showed that ASIR and ASDR, showed significant and large decreases in the low SDI region, but the relationship between SDI and disease indicators became smaller when entering the medium SDI. Whereas ASPR showed a significant and large decrease in both low SDI and high SDI regions, the decrease in medium SDI region was small (Fig. 3).

Fig. 3.

A: Correlation between ASIR and SDI for TB in 21 GBD regions from 1990 to 2021; B: Correlation between ASPR and SDI for TB in 21 GBD regions from 1990 to 2021; C: Correlation between ASDR and SDI for TB in 21 GBD regions from 1990 to 2021. AAPC: annual average percent change. TB: tuberculosis. ASIR: age standardized incidence rate. ASPR: age standardized prevalence rate. ASDR: age standardized death rate. SDI: Social Demographic Index.

(0.44MB).
Decomposition Analysis

To further analyze the influencing factors at different strategy stages, we also performed a decomposition analysis, and Fig. 4 shows that ASPR is dominated by demographic factors at the DOTS stage globally, but the influence becomes progressively smaller at all three stages. The influencing factors in the high SDI regions are mainly epidemiologic changes, while in the low and low-middle SDI regions, they are mainly due to demographic factors. Interestingly, the high and medium SDI areas are dominated by demographic factors in the first stage, to epidemiologic changes in the second stage, and then to aging factors in the third stage. The medium SDI region, as mentioned earlier, has the smallest decrease in ASPR, which deserves more attention, with a change in its influencing factors from demographic factors in the first and second stages, to aging factors in the third stage.

Fig. 4.

A: Decomposition analysis for TB ASPR in 5 SDI and 21 GBD regions from 1990 to 2005 (DOTS); B: Decomposition analysis for TB ASPR in 5 SDI and 21 GBD regions from 2006 to 2015 (stop TB); C: Decomposition analysis for TB ASPR in 5 SDI and 21 GBD regions from 2016 to 2021 (end TB). TB: tuberculosis. ASPR: age standardized prevalence rate.

(0.28MB).

ASIR is more variable, globally dominated by demographic factors in stages one and three, and epidemiologic changes in stage two. High SDI and medium-high SDI were dominated by epidemiologic changes at different stages. In contrast, the medium, low medium and low SDI areas were consistent with global changes in influencing factors (Supplementary Fig. 6).

The results of the decomposition analysis of ASDR, showed that the influencing factors were relatively stable, with epidemiological changes dominating the influencing factors at the three different stages, both in the global orientation and in the different SDI regions (Supplementary Fig. 7).

Lifestyle Risk Factor Analysis

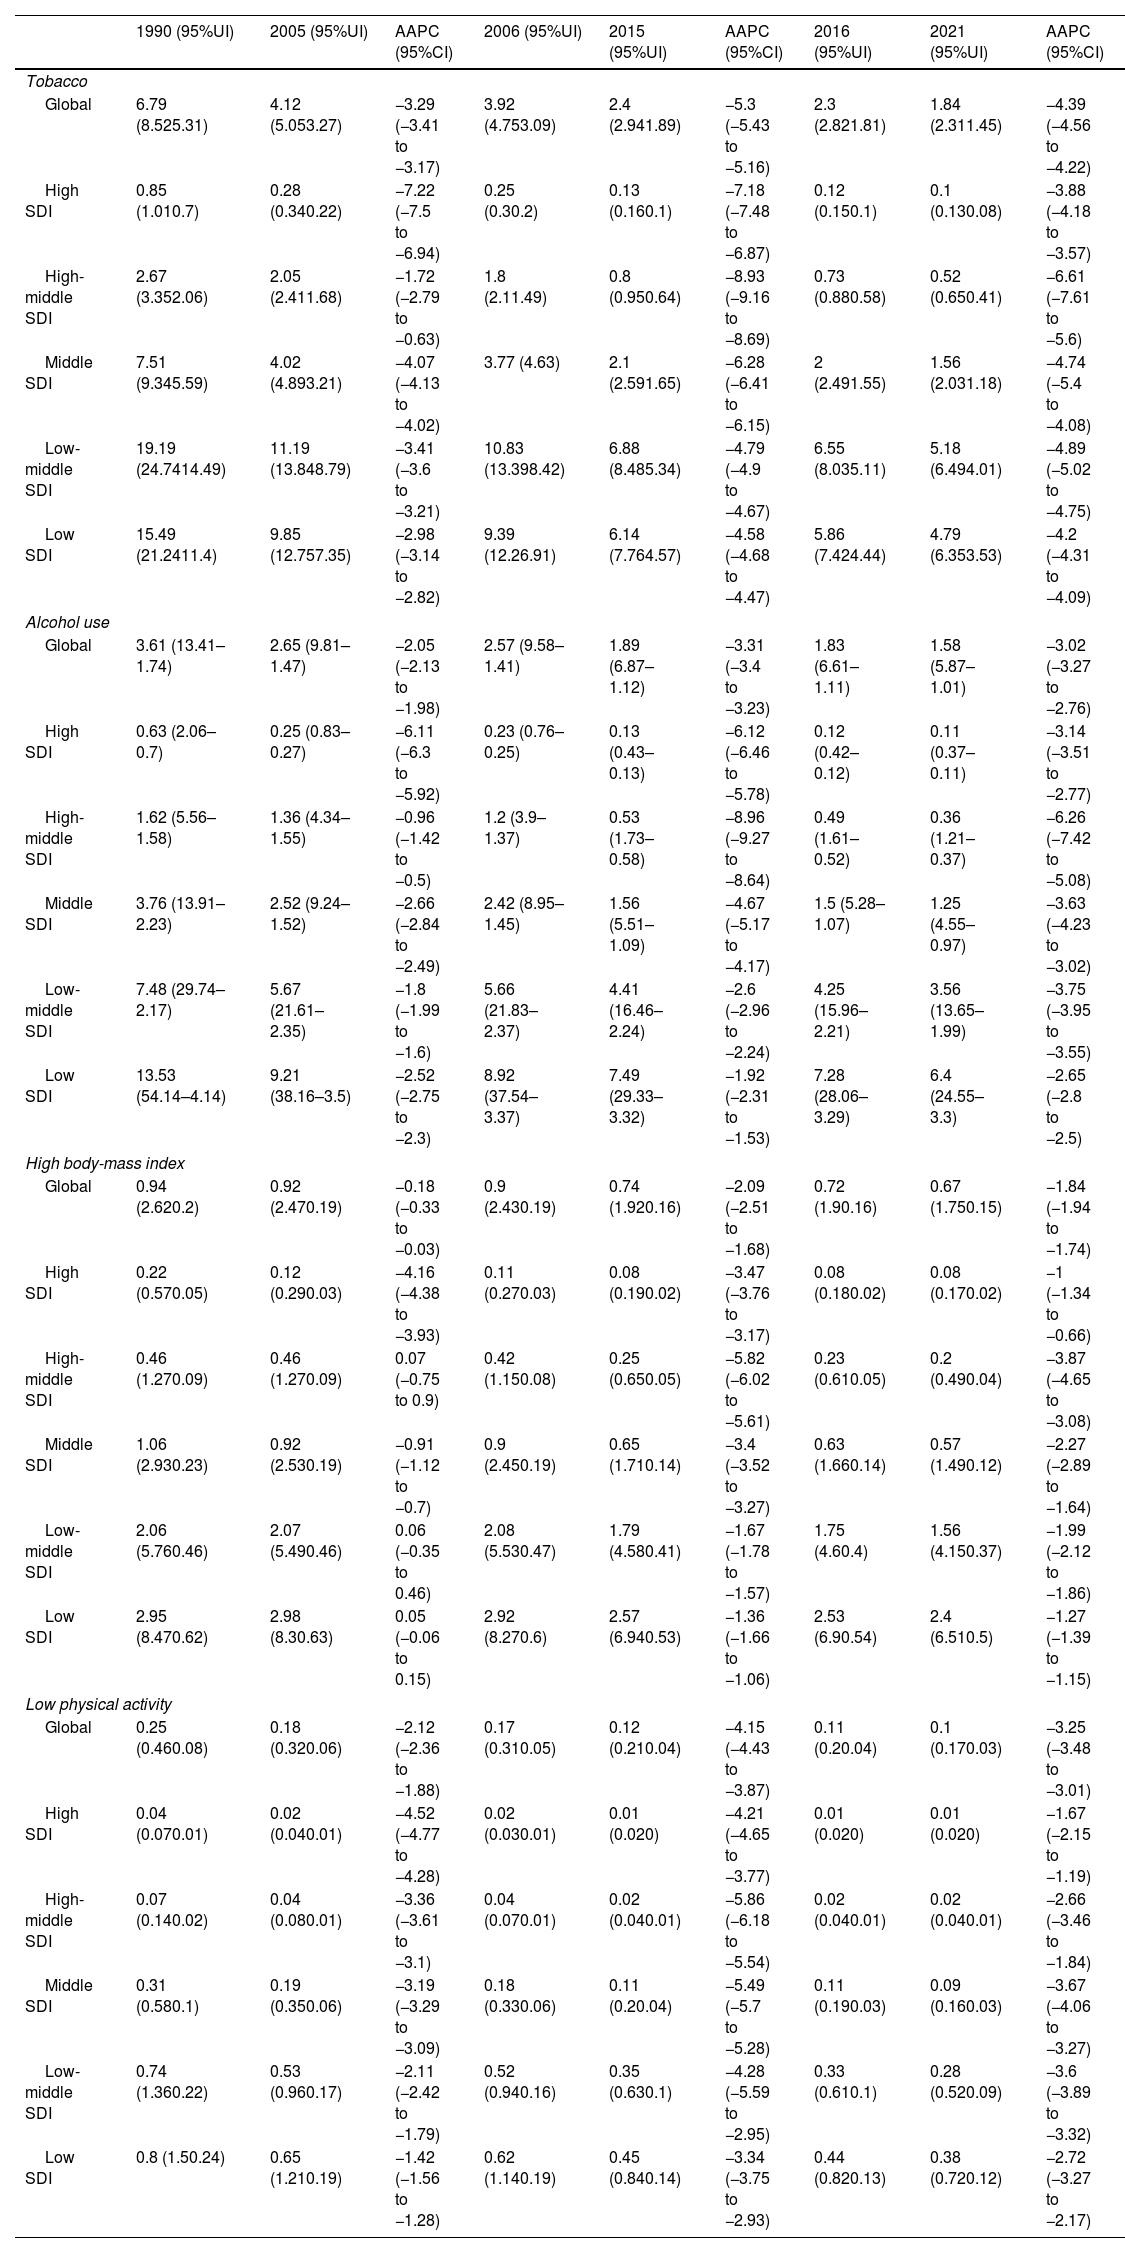
Table 2 shows that among the 4 lifestyle factors, at the global level, tobacco had the largest decline followed by alcohol use and low physical activity, and high body mass index (BMI) had the smallest decline. Meanwhile, tobacco, alcohol use and low physical activity were generally consistent with changes in the burden of disease indicators in the 3 phases, especially for ASDR. The consistency of changes in high BMI was low, with a small decrease in the first phase.

Table 2.

Main Risk Factors Annual Average Percent Change for ASDR.

  1990 (95%UI)  2005 (95%UI)  AAPC (95%CI)  2006 (95%UI)  2015 (95%UI)  AAPC (95%CI)  2016 (95%UI)  2021 (95%UI)  AAPC (95%CI) 
Tobacco
Global  6.79 (8.525.31)  4.12 (5.053.27)  −3.29 (−3.41 to −3.17)  3.92 (4.753.09)  2.4 (2.941.89)  −5.3 (−5.43 to −5.16)  2.3 (2.821.81)  1.84 (2.311.45)  −4.39 (−4.56 to −4.22) 
High SDI  0.85 (1.010.7)  0.28 (0.340.22)  −7.22 (−7.5 to −6.94)  0.25 (0.30.2)  0.13 (0.160.1)  −7.18 (−7.48 to −6.87)  0.12 (0.150.1)  0.1 (0.130.08)  −3.88 (−4.18 to −3.57) 
High-middle SDI  2.67 (3.352.06)  2.05 (2.411.68)  −1.72 (−2.79 to −0.63)  1.8 (2.11.49)  0.8 (0.950.64)  −8.93 (−9.16 to −8.69)  0.73 (0.880.58)  0.52 (0.650.41)  −6.61 (−7.61 to −5.6) 
Middle SDI  7.51 (9.345.59)  4.02 (4.893.21)  −4.07 (−4.13 to −4.02)  3.77 (4.63)  2.1 (2.591.65)  −6.28 (−6.41 to −6.15)  2 (2.491.55)  1.56 (2.031.18)  −4.74 (−5.4 to −4.08) 
Low-middle SDI  19.19 (24.7414.49)  11.19 (13.848.79)  −3.41 (−3.6 to −3.21)  10.83 (13.398.42)  6.88 (8.485.34)  −4.79 (−4.9 to −4.67)  6.55 (8.035.11)  5.18 (6.494.01)  −4.89 (−5.02 to −4.75) 
Low SDI  15.49 (21.2411.4)  9.85 (12.757.35)  −2.98 (−3.14 to −2.82)  9.39 (12.26.91)  6.14 (7.764.57)  −4.58 (−4.68 to −4.47)  5.86 (7.424.44)  4.79 (6.353.53)  −4.2 (−4.31 to −4.09) 
Alcohol use
Global  3.61 (13.41–1.74)  2.65 (9.81–1.47)  −2.05 (−2.13 to −1.98)  2.57 (9.58–1.41)  1.89 (6.87–1.12)  −3.31 (−3.4 to −3.23)  1.83 (6.61–1.11)  1.58 (5.87–1.01)  −3.02 (−3.27 to −2.76) 
High SDI  0.63 (2.06–0.7)  0.25 (0.83–0.27)  −6.11 (−6.3 to −5.92)  0.23 (0.76–0.25)  0.13 (0.43–0.13)  −6.12 (−6.46 to −5.78)  0.12 (0.42–0.12)  0.11 (0.37–0.11)  −3.14 (−3.51 to −2.77) 
High-middle SDI  1.62 (5.56–1.58)  1.36 (4.34–1.55)  −0.96 (−1.42 to −0.5)  1.2 (3.9–1.37)  0.53 (1.73–0.58)  −8.96 (−9.27 to −8.64)  0.49 (1.61–0.52)  0.36 (1.21–0.37)  −6.26 (−7.42 to −5.08) 
Middle SDI  3.76 (13.91–2.23)  2.52 (9.24–1.52)  −2.66 (−2.84 to −2.49)  2.42 (8.95–1.45)  1.56 (5.51–1.09)  −4.67 (−5.17 to −4.17)  1.5 (5.28–1.07)  1.25 (4.55–0.97)  −3.63 (−4.23 to −3.02) 
Low-middle SDI  7.48 (29.74–2.17)  5.67 (21.61–2.35)  −1.8 (−1.99 to −1.6)  5.66 (21.83–2.37)  4.41 (16.46–2.24)  −2.6 (−2.96 to −2.24)  4.25 (15.96–2.21)  3.56 (13.65–1.99)  −3.75 (−3.95 to −3.55) 
Low SDI  13.53 (54.14–4.14)  9.21 (38.16–3.5)  −2.52 (−2.75 to −2.3)  8.92 (37.54–3.37)  7.49 (29.33–3.32)  −1.92 (−2.31 to −1.53)  7.28 (28.06–3.29)  6.4 (24.55–3.3)  −2.65 (−2.8 to −2.5) 
High body-mass index
Global  0.94 (2.620.2)  0.92 (2.470.19)  −0.18 (−0.33 to −0.03)  0.9 (2.430.19)  0.74 (1.920.16)  −2.09 (−2.51 to −1.68)  0.72 (1.90.16)  0.67 (1.750.15)  −1.84 (−1.94 to −1.74) 
High SDI  0.22 (0.570.05)  0.12 (0.290.03)  −4.16 (−4.38 to −3.93)  0.11 (0.270.03)  0.08 (0.190.02)  −3.47 (−3.76 to −3.17)  0.08 (0.180.02)  0.08 (0.170.02)  −1 (−1.34 to −0.66) 
High-middle SDI  0.46 (1.270.09)  0.46 (1.270.09)  0.07 (−0.75 to 0.9)  0.42 (1.150.08)  0.25 (0.650.05)  −5.82 (−6.02 to −5.61)  0.23 (0.610.05)  0.2 (0.490.04)  −3.87 (−4.65 to −3.08) 
Middle SDI  1.06 (2.930.23)  0.92 (2.530.19)  −0.91 (−1.12 to −0.7)  0.9 (2.450.19)  0.65 (1.710.14)  −3.4 (−3.52 to −3.27)  0.63 (1.660.14)  0.57 (1.490.12)  −2.27 (−2.89 to −1.64) 
Low-middle SDI  2.06 (5.760.46)  2.07 (5.490.46)  0.06 (−0.35 to 0.46)  2.08 (5.530.47)  1.79 (4.580.41)  −1.67 (−1.78 to −1.57)  1.75 (4.60.4)  1.56 (4.150.37)  −1.99 (−2.12 to −1.86) 
Low SDI  2.95 (8.470.62)  2.98 (8.30.63)  0.05 (−0.06 to 0.15)  2.92 (8.270.6)  2.57 (6.940.53)  −1.36 (−1.66 to −1.06)  2.53 (6.90.54)  2.4 (6.510.5)  −1.27 (−1.39 to −1.15) 
Low physical activity
Global  0.25 (0.460.08)  0.18 (0.320.06)  −2.12 (−2.36 to −1.88)  0.17 (0.310.05)  0.12 (0.210.04)  −4.15 (−4.43 to −3.87)  0.11 (0.20.04)  0.1 (0.170.03)  −3.25 (−3.48 to −3.01) 
High SDI  0.04 (0.070.01)  0.02 (0.040.01)  −4.52 (−4.77 to −4.28)  0.02 (0.030.01)  0.01 (0.020)  −4.21 (−4.65 to −3.77)  0.01 (0.020)  0.01 (0.020)  −1.67 (−2.15 to −1.19) 
High-middle SDI  0.07 (0.140.02)  0.04 (0.080.01)  −3.36 (−3.61 to −3.1)  0.04 (0.070.01)  0.02 (0.040.01)  −5.86 (−6.18 to −5.54)  0.02 (0.040.01)  0.02 (0.040.01)  −2.66 (−3.46 to −1.84) 
Middle SDI  0.31 (0.580.1)  0.19 (0.350.06)  −3.19 (−3.29 to −3.09)  0.18 (0.330.06)  0.11 (0.20.04)  −5.49 (−5.7 to −5.28)  0.11 (0.190.03)  0.09 (0.160.03)  −3.67 (−4.06 to −3.27) 
Low-middle SDI  0.74 (1.360.22)  0.53 (0.960.17)  −2.11 (−2.42 to −1.79)  0.52 (0.940.16)  0.35 (0.630.1)  −4.28 (−5.59 to −2.95)  0.33 (0.610.1)  0.28 (0.520.09)  −3.6 (−3.89 to −3.32) 
Low SDI  0.8 (1.50.24)  0.65 (1.210.19)  −1.42 (−1.56 to −1.28)  0.62 (1.140.19)  0.45 (0.840.14)  −3.34 (−3.75 to −2.93)  0.44 (0.820.13)  0.38 (0.720.12)  −2.72 (−3.27 to −2.17) 
Discussion

Our results show that from 1990 to 2021, the best TB controlled indicator is ASDR, followed by ASIR and finally ASPR.2 Moreover, control of TB prevalence deserves attention. In terms of phase effects, it is evident that phase II control results in the best results in terms of morbidity, disease and mortality control. Notably, stage 1 had better control than stage 3 in terms of morbidity and illness, while control of mortality was lower than in stage 3.

Looking at the results for the less well controlled ASPR, it is observed that the largest annual increase in Stage I was in Taiwan, China, while the largest annual decrease was in Spain. In contrast, in Stage 2, the largest annual increase was in Sri Lanka (which also had the second largest increase in Stage 1) and the largest annual decrease was in Cape Verde. Furthermore, in stage 3, the largest annual increase was in the United States and the largest annual decrease was in Côte d’Ivoire.

In order to explore the reasons for the increase or decrease in prevalence, we took these typical countries as examples and went to search the literature on TB prevention and control in these countries at the corresponding stages and found some possible explanations. In Taiwan, a review in 200619 showed that the increasing burden of multidrug-resistant TB infections, high mortality rates, the lack of a nationwide surveillance system to determine drug resistance trends and status, and the inadequacy of the current TB control infrastructure and training to accomplish the tasks required to implement the Directly Observed Treatment Shortcourse (DOTS) strategy have had a significant impact on public health in Taiwan. In contrast, a study conducted by the TIR team of the Spanish National Institute of Public Health (INSP)20 between June 1999 and May 2000 showed that 82% of the 1515 cases treated had a satisfactory outcome. Furthermore, the incidence of tuberculosis showed an improving trend in recent years, following a rise linked to AIDS.

A study in Sri Lanka in 200821 showed that both male and female TB patients in Sri Lanka were severely malnourished. As a result, patients are advised to receive nutritional support during treatment, and there is a pressing need to study the exact nutritional deficiencies at the micronutrient level and their impact on the immune system. Meanwhile, a 2008 study on TB uptake in Cape Verde22 showed an overall underreporting rate of 40% for TB in Praia, Cape Verde between 2006 and 2012.

Previous studies showed that in the United States,23–25 more than 80% of tuberculosis (TB) cases were estimated to be due to reactivation of latent tuberculosis infection (LTBI) acquired two years ago (“reactivated TB”). This may be one of the reasons for the rebound of TB in the United States. In recent years, several multicenter RCTs of genetic diagnostic techniques,26–29 retroviral therapy for TB have been conducted in African countries, including clinical trials for drug-resistant TB, patients with HIV, TB co-infection and a project to decentralize TB diagnosis in children. It is likely that the dissemination of research on these diagnostic and treatment technologies, as well as the implementation of favorable policy programs, have contributed to the control of TB ASPR in Côte d’Ivoire.30 However, the possibility of TB underreporting in Côte d’Ivoire cannot be ruled out.

Some studies31,32 reported that malnutrition, forced displacement and homelessness worse from 2015 to 2021. Global malnutrition rates have risen from 8.4% to 9.8%, with 22.7 million new people affected each year. As of 2022, 735million people globally are affected by malnutrition. This may be an influencing factor in the fact that the effects of the third phase are not as effective as those of the second phase. Regionally, Africa (21.9%) and Asia (10.6%) have the highest rates, while Western Europe and North America have rates below the global average: 3.4% and 2.5%, respectively.

These changes, consistent with our analysis of influencing factors, show that the SDI index is negatively correlated with TB control. However, the correlation between SDI and ASPR is not significant in East and Southeast Asia. Meanwhile, the TB ASPR in the middle and high SDI regions rebounded and increased in the third stage from a decline in the first two stages. Decomposition analysis showed that ASPR in middle and high SDI areas changed from demographic factors in the first stage, to epidemiologic factors in the second stage, to population aging factors in the third stage. It suggests that probably the middle and high SDI regions, due to the existence of changes in the countries included, the changes in risk factors have led to the reversal of TB prevention and control.

China has achieved a reduction in morbidity and mortality above the global average in the primary stage of END TB, in order to advance the END TB goal. We would like to share China's implementation strategies.33–35 Firstly, there is government guidance and monitoring, promotion of laws, regulations, and service systems, socioeconomic development, and improvement of population nutrition. In collaboration with the CDC, we will promote TB prevention and control in chronic disease prevention and treatment, infectious disease prevention and treatment, and community health education.36 Secondly, we will establish a strong alliance with the community to promote universal medical checkups and medical checkups for the elderly in conjunction with healthcare reform. At the same time, we will promote the integration of health care and prevention and the construction of medical communities to play a role in the prevention and control of tuberculosis.37 Thirdly, protecting and promoting human rights and equity, and continuing to promote BCG vaccination and preventive treatment for high-risk groups.38 Fourthly, under the premise of global cooperation, establish strategies and targets, improve the monitoring mechanism, combine passive and active monitoring, and realize the whole process of treatment management, making full use of the Internet and AI technology.39

As ASIR and ASDR have achieved good control rate results in the three different phases, especially in the second phase, which has accomplished the target. Although the third phase still requires further efforts to complete the END TB target, it is also necessary to acknowledge the significant achievements in TB morbidity and mortality control globally.

According to the WHO Global tuberculosis report 2024, the rise in the number of incidence cases of TB globally that began during the 2019 coronavirus disease pandemic had slowed and began to stabilize, meanwhile, the number of global TB deaths declined in 2023, consolidating the decline seen in 2022. The decline in the number of TB deaths and the slowdown in the growth of TB incidence since 2022 were the result of a substantial recovery in TB diagnosis and treatment post-COVID.40 This is consistent with the results of the 2016–2021 phase of our study, in which ASIR and ASDR were relatively well controlled, but control of ASPR needed to be further strengthened.

Based on our study, we would like to make the following recommendations: first, for countries with medium-high or higher SDI, the control of ASIR and ASDR requires more attention and more resources to prevent the emergence of new-onset TB patients and to reduce the mortality of TB patients. Second, for countries with medium-high or higher SDI, more attention must be paid to the risks associated with population aging, and more methods are needed to reduce the impact of aging on TB. Third, among the lifestyle factors, continuing to strengthen the promotion of smoking, alcohol consumption, and physical activity is of great significance for the prevention and control of TB. It is also important to reduce the percentage of high BMI population, especially in countries prone to obesity such as medium and high SDI, which may be an important way to accelerate the realization of END TB goals. Finally, in the post-COVID era, more research on prevention and control strategy, disease burden trend, diagnosis, treatment, and rehabilitation is needed to help achieve the END TB goal.

There are several strengths in this research. Firstly, the practical significance is an important feature in this research, which can better guide for the next step TB control and prevention. Secondly, the data included is a large scale, long-term and authoritative database. Thirdly, the methods in this research are powerful, especially in risk factors analysis like SDI correlation plot and decomposition analysis. However, this study had several limitations. Firstly, GBD data were global estimates, and this study was an ecological study based on estimated data. Secondly, our analysis of the relationship between disease burden indicators and SDI could not explain causality. Lastly, the exploration of risk factors was limited by the currently limited data, which might overlook some factors. In the further study, we could explore some more technical interventions and policy suggestions for controlling and prevention in END TB stage, especially in high TB burden countries.

Conclusion

In conclusion, the control of TB morbidity and mortality has been a great achievement in all the three different phases of the TB control strategy, and a concerted global effort is still needed in phase 3 to reach the END TB. However, TB prevalence control needs to be emphasized, especially in the middle and high SDI areas. More good prevention and control strategies are needed to collectively push the world to achieve the END TB goal in 2035.

Ethics Approval

Since this research is based on global burden of disease study 2021 database. This study is approved by the ethics committee of University of Washington from Institute for Health Metrics and Evaluation.

Funding

Hubei Provincial Public Health Leading Talent Project (no award/grant number); Young Talent Development Program of Wuhan Fourth Hospital (no award/grant number); Scientific Research Fund of Wuhan Municipal Health Commission (WG21Z10).

Conflict of Interests

The authors declare that they have no known competing financial interests or personal relationships that could have appeared to influence the work reported in this paper.

Data Sharing

To download the data used in these analyses, please visit the Global Burden of Disease Results Tool (http://ghdx.healthdata.org/gbd-results-tool) and World Bank (https://data.worldbank.org/), made public by the Institute for Health Metrics and Evaluation.

Acknowledgments

None.

Appendix A
Supplementary Data

The followings are the supplementary data to this article:

Disease burden among 21 GBD districts with different WHO TB control strategies.

Disease burden among 204 countries with different WHO TB control strategies. AAPC: average annual percent change; AC: annual change.

References
[1]
K. Floyd, P. Glaziou, A. Zumla, M. Raviglione.
The global tuberculosis epidemic and progress in care, prevention, and research: an overview in year 3 of the End TB era.
Lancet Respir Med, 6 (2018), pp. 299-314
[2]
J.R. Ledesma, J. Ma, M. Zhang, A.V.L. Basting, H.T. Chu, A. Vongpradith, et al.
Global, regional, and national age-specific progress towards the 2020 milestones of the WHO End TB Strategy: a systematic analysis for the Global Burden of Disease Study 2021.
Lancet Infect Dis, 24 (2024), pp. 698-725
[3]
M. Reid, G. Yamey, E. Goosby, D. Jamison, M. Schäferhoff.
Seizing opportunities to end TB: a call for ambition and optimism on World TB Day.
[4]
S.M. Blower, C.L. Daley.
Problems and solutions for the Stop TB partnership.
Lancet Infect Dis, 2 (2002), pp. 374-376
[5]
J. Volmink, P. Matchaba, P. Garner.
Directly observed therapy and treatment adherence.
Lancet, 355 (2000), pp. 1345-1350
[6]
M.C. Raviglione, M.W. Uplekar.
WHO's new stop TB strategy.
Lancet, 367 (2006), pp. 952-955
[7]
S.B. Squire, A. Obasi, B. Nhlema-Simwaka.
The global plan to stop TB: a unique opportunity to address poverty and the Millennium Development Goals.
[8]
M. Raviglione.
The new stop TB strategy and the global plan to stop TB 2006–2015.
Bull World Health Organ, 85 (2007), pp. 327
[9]
Y. Chen, Y. Chao, Q. Deng, T. Liu, J. Xiang, J. Chen, et al.
Potential challenges to the Stop TB Plan for humans in China; cattle maintain M. bovis and M. tuberculosis.
Tuberculosis, 89 (2009), pp. 95-100
[10]
The Lancet Respiratory M. The end TB strategy: a global rally. Lancet Respir Med. 2014;2(12):943.
[11]
M. Uplekar, D. Weil, K. Lonnroth, E. Jaramillo, C. Lienhardt, H.M. Dias, et al.
WHO's new end TB strategy.
Lancet, 385 (2015), pp. 1799-1801
[12]
D. Falzon, H. Timimi, P. Kurosinski, G.B. Migliori, W. Van Gemert, C. Denkinger, et al.
Digital health for the end TB strategy: developing priority products and making them work.
Eur Respir J, 48 (2016), pp. 29-45
[13]
J. Li, P.-H. Chung, C.L.K. Leung, N. Nishikiori, E.Y.Y. Chan, E.-K. Yeoh.
The strategic framework of tuberculosis control and prevention in the elderly: a scoping review towards End TB targets.
Infect Dis Pov, 6 (2017), pp. 70
[14]
A. Mariandyshev, P. Eliseev.
Drug-resistant tuberculosis threatens WHO's End-TB strategy.
Lancet Infect Dis, 17 (2017), pp. 674-675
[15]
G.J. Churchyard, S. Swindells.
Controlling latent TB tuberculosis infection in high-burden countries: a neglected strategy to end TB.
PLOS Med, 16 (2019), pp. e1002787
[16]
Y. Krishnamoorthy, R. Nagarajan, S. Rajaa, M.G. Majella, S. Murali, V. Jayaseelan.
Progress of South East Asian Region countries towards achieving interim End TB strategy targets for TB incidence and mortality: a modelling study.
Public Health, 198 (2021), pp. 9-16
[17]
W. Jinyi, Y. Zhang, K. Wang, P. Peng.
Global, regional, and national mortality of tuberculosis attributable to alcohol and tobacco from 1990 to 2019: a modelling study based on the Global Burden of Disease study 2019.
J Glob Health, 14 (2024), pp. 04023
[18]
J. Wu, Y. Che, Y. Zhang, J. Wang, M. Chen, J. Jiang, et al.
Global, regional, national trends of femur fracture and machine learning prediction: Comprehensive findings and questions from global burden of disease 1990–2019.
J Orthop Transl, 46 (2024), pp. 46-52
[19]
P.R. Hsueh, Y.C. Liu, J. So, C.Y. Liu, P.C. Yang, K.T. Luh.
Mycobacterium tuberculosis in Taiwan.
J Infect, 52 (2006), pp. 77-85
[20]
M.N. Altet Gomez, J. Alcaide Megias.
Control and elimination of tuberculosis in Spain: recommendations for the twenty-first century.
An Pediatr (Barc), 64 (2006), pp. 66-73
[21]
U.S. Rajapaksa, T.C. Victor, A.J. Perera, R.M. Warren, S.M. Senevirathne.
Molecular diversity of Mycobacterium tuberculosis isolates from patients with pulmonary tuberculosis in Sri Lanka.
Trans R Soc Trop Med Hyg, 102 (2008), pp. 997-1002
[22]
E. Furtado da Luz, J.U. Braga.
Under-reporting of tuberculosis in Praia, Cape Verde, from 2006 to 2012.
Int J Tuberc Lung Dis, 22 (2018), pp. 258-263
[23]
Y. Wu, M. Huang, X. Wang, Y. Li, L. Jiang, Y. Yuan.
The prevention and control of tuberculosis: an analysis based on a tuberculosis dynamic model derived from the cases of Americans.
BMC Public Health, 20 (2020), pp. 1173
[24]
R.M. Stalter, M. Pecha, L. Dov, D. Miller, Z. Ghazal, J. Wortham, et al.
Tuberculosis outbreak in a state prison system – Washington, 2021–2022.
Morb Mortal Wkly Rep, 72 (2023), pp. 309-312
[25]
M. Ekramnia, Y. Li, M.B. Haddad, S.M. Marks, J.S. Kammerer, N.A. Swartwood, et al.
Estimated rates of progression to tuberculosis disease for persons infected with Mycobacterium tuberculosis in the United States.
Epidemiology, 35 (2024), pp. 164-173
[26]
B. Seri, A. Koffi, C. Danel, T. Ouassa, M.A. Blehoue, E. Ouattara, et al.
Prevalence of pulmonary tuberculosis among prison inmates: a cross-sectional survey at the Correctional and Detention Facility of Abidjan, Cote d’Ivoire.
PLOS ONE, 12 (2017), pp. e0181995
[27]
A. Zumla, J. Chakaya, M. Khan, R. Fatima, C. Wejse, S. Al-Abri, et al.
World tuberculosis day 2021 theme – ‘The Clock is Ticking’ – and the world is running out of time to deliver the United Nations General Assembly commitments to End TB due to the COVID-19 pandemic.
Int J Infect Dis, 113 (2021), pp. S1-S6
[28]
L.A. Enane, S.N. Duda, T. Chanyachukul, C. Bolton-Moore, N. Navuluri, E. Messou, et al.
The Tuberculosis Sentinel Research Network (TB-SRN) of the International epidemiology Databases to Evaluate AIDS (IeDEA): protocol for a prospective cohort study in Africa, Southeast Asia and Latin America.
BMJ Open, 14 (2024), pp. e079138
[29]
K. Isangula, D. Philbert, F. Ngari, T. Ajeme, G. Kimaro, G. Yimer, et al.
Implementation of evidence-based multiple focus integrated intensified TB screening to end TB (EXIT-TB) package in East Africa: a qualitative study.
BMC Infect Dis, 23 (2023), pp. 161
[30]
K. N’Guessan, T. Ouassa, A.S. Dean, R. Alagna, G.D. Adagra, V. Ibode, et al.
Multidrug-resistant tuberculosis in Cote d’Ivoire from 1995 to 2016: results of national surveys.
Eur J Microbiol Immunol (Bp), 8 (2018), pp. 91-94
[31]
D. Chesov, G. Makhanda, J. Furin.
Tackling the many layers of stigma is essential for the “End TB Strategy”.
Int J Tuberc Lung Dis, 25 (2021), pp. 683-684
[32]
B. Ayenew, D.M. Belay, Y. Gashaw, W. Gimja, Y. Gardie.
WHO's end of TB targets: unachievable by 2035 without addressing under nutrition, forced displacement, and homelessness: trend analysis from 2015 to 2022.
BMC Public Health, 24 (2024), pp. 961
[33]
G.H. Huynh, D.J. Klein, D.P. Chin, B.G. Wagner, P.A. Eckhoff, R. Liu, et al.
Tuberculosis control strategies to reach the 2035 global targets in China: the role of changing demographics and reactivation disease.
[34]
L. Gao, X. Li, J. Liu, X. Wang, W. Lu, L. Bai, et al.
Incidence of active tuberculosis in individuals with latent tuberculosis infection in rural China: follow-up results of a population-based, multicentre, prospective cohort study.
Lancet Infect Dis, 17 (2017), pp. 1053-1061
[35]
H. Chen, K. Zhang.
Insight into the impact of the COVID-19 epidemic on tuberculosis burden in China.
Eur Respir J, 56 (2020), pp. 2002710
[36]
H. Jiang, M. Liu, Y. Zhang, J. Yin, Z. Li, C. Zhu, et al.
Changes in incidence and epidemiological characteristics of pulmonary tuberculosis in Mainland China, 2005–2016.
JAMA Netw Open, 4 (2021), pp. e215302
[37]
Q. Long, L. Guo, W. Jiang, S. Huan, S. Tang.
Ending tuberculosis in China: health system challenges.
Lancet Public Health, 6 (2021), pp. e948-e953
[38]
H. Xin, X. Cao, H. Zhang, B. Feng, Y. Du, B. Zhang, et al.
Protective efficacy of 6-week regimen for latent tuberculosis infection treatment in rural China: 5-year follow-up of a randomised controlled trial.
Eur Respir J, 60 (2022), pp. 2102359
[39]
Q. Feng, G. Zhang, L. Chen, H. Wu, Y. Yang, Q. Gao, et al.
Roadmap for ending TB in China by 2035: the challenges and strategies.
Biosci Trends, 18 (2024), pp. 11-20
[40]
World Health Organization. Global tuberculosis report 2024. [accessed 2024] Available from: https://www.who.int/publications/i/item/9789240101531.
Copyright © 2024. SEPAR
Archivos de Bronconeumología
Article options
Tools

Are you a health professional able to prescribe or dispense drugs?