
The classification of asthma phenotypes based on inflammatory biomarkers, particularly blood eosinophil counts (BEC) and fractional exhaled nitric oxide (FeNO), has gained relevance [1]. The identification of T2 and non T2 phenotypes has been widely used in clinical practice and research. Despite the increasing use of biomarker-based classifications, the stability of asthma phenotypes over time remains unclear [2]. Understanding the temporal stability of these phenotypes is crucial for optimizing long-term disease management and ensuring the appropriate use of biologic therapies targeting type 2 inflammation.
Our study aimed to evaluate asthma stability over a two-year period using three distinct classifications. Patients from the MEGA cohort [3] were selected and classified three times using three distinct cut-off points for BEC and FeNO. As a secondary objective, we explored whether clinical cluster [4], influence biomarkers stability.
Data on BEC, induced sputum, FeNO, and pulmonary function were obtained at baseline (V0), 12 months (V1), and 24 months (V2). In phenotype classification A, T2-high was diagnosed when BEC was ≥300cells/μL or FeNO was ≥35ppb and T2-low when BEC was <300cells/μL and FeNO was <35ppb [5]. In classification B, T2-high was diagnosed when BEC was ≥500/μL or FeNO was ≥50ppb and T2-low when BEC was <500/μL and FeNO was <50ppb [6]. In classification C, T2-high was diagnosed when BEC was ≥300/μL or FeNO was ≥50ppb and T2-low when BEC was <300/μL and FeNO was <50ppb [7]. Patients were divided into five clinical clusters following their lung function, reversibility and age of asthma onset as previously published [4]. Phenotype classifications were reassessed in each of these clusters. Those with a baseline FEV1 <68% and a maximum FEV1 <65% were assigned to cluster 5, whereas those with a maximum FEV1 ≥65% were placed in cluster 4. Patients with a baseline FEV1 ≥68% and a maximum FEV1 ≥108% were included in cluster 1. If the maximum FEV1 was <108%, classification depended on age of onset: individuals who developed asthma before 40 years were assigned to cluster 2, while those who developed asthma at 40 years or older were placed in cluster 3.
Patients with incomplete inflammatory data or following treatment with biologics were excluded to avoid bias. A total of 200 patients were analyzed. Demographic and clinical data about these patients have been previously published [8]. In phenotype classification A, 123 (61.5%) patients had a T2-high phenotype at V0, which remained unchanged in 60.9% and 41.5% of patients at V1 and V2, respectively. Of the 77 patients (38.5%) with a T2-low phenotype at V0, 70.1% and 54.5% of them, respectively, remained unchanged in following visits. In phenotype B, 45 (22.5%) patients had a T2-high phenotype, which remained stable in 48.8% and 17.7% of them at V1 and V2. Of the 155 (77.5%) with T2 low phenotype, it remained in 76.1% and 47.7% of them at the respective visit. In phenotype C, 113 (56.5%) patients had a T2-high phenotype, which remained stable in 59.3% and 40.7% of them at V1 and V2. Of the 87 (43.5%) with T2 low, remained in 75.8% and 54.1% of them respectively (Fig. 1).

Moderate significant correlation was found in phenotype profiles A, B and C between V0 and V1 (r=0.31, for classification A; r=0.32 for classification B; and r=0.31 for classification C, all p<0.01). However, a low and non-significant correlation was found between V0 and V2 in all these classifications (r=0.18, p=0.17 for A, r=0.06, p=0.69 for B and r=0.25, p=0.05 for C).
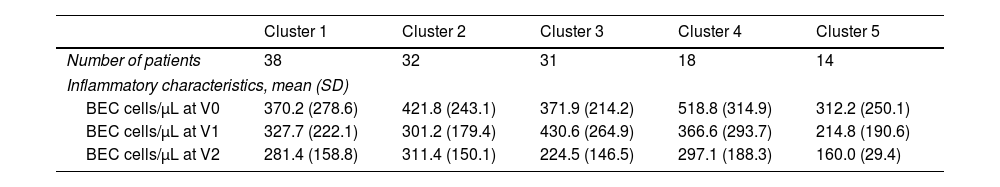
For the secondary objective, 133 subjects had all the necessary data. When dividing patients into clinical clusters [4], there was no difference in the mean value of BEC neither between each cluster nor between each visit (Table 1). There was no correlation between the T2 phenotype in clusters 3 and 5 with any of the evaluated classifications at any visits (p>0.05). Patients from cluster 1, characterized by mild asthma and normal lung function tests, exhibited a moderate correlation in phenotype profile B over one and two years (r=0.43 and r=0.32 respectively, p<0.05). Patients from cluster 2, who had early-onset asthma, were the only group to demonstrate a significant phenotype profile correlation over two years. This correlation was observed for classification A and C (r=0.42, p=0.01; Table II, supplementary).
Patient's demographic and clinical characteristics divided into the five clinical cluster.
| Cluster 1 | Cluster 2 | Cluster 3 | Cluster 4 | Cluster 5 | |
|---|---|---|---|---|---|
| Number of patients | 38 | 32 | 31 | 18 | 14 |
| Inflammatory characteristics, mean (SD) | |||||
| BEC cells/μL at V0 | 370.2 (278.6) | 421.8 (243.1) | 371.9 (214.2) | 518.8 (314.9) | 312.2 (250.1) |
| BEC cells/μL at V1 | 327.7 (222.1) | 301.2 (179.4) | 430.6 (264.9) | 366.6 (293.7) | 214.8 (190.6) |
| BEC cells/μL at V2 | 281.4 (158.8) | 311.4 (150.1) | 224.5 (146.5) | 297.1 (188.3) | 160.0 (29.4) |
BEC: blood eosinophil count; SD: standard deviation; V0: baseline; V1: 12 months follow-up; V2: 24 months follow-up.
Instability of inflammatory biomarkers has been previously demonstrated. In our MEGA cohort, about 60% and 50% of asthmatic patients maintain their phenotype over one and two years, respectively, when a T2-high profile was defined as BEC ≥150/μL or FeNO ≥20ppb [9]. In this study, different cut-off values were applied and similar results were obtained. About 30–35% change their biomarkers in one year and 50–60% in two years. Although a moderate correlation was observed in phenotype classification over one year, the correlation was low and statistically non-significant over two years for all classification criteria. Previous studies have demonstrated the instability of peripheral eosinophilia and sputum cellularity [10], reporting that between 40–60% and 42% of asthmatic patients respectively changed their phenotype profile within one year based on them. However, our study evaluated patients over a two-year follow-up and demonstrated an increasing variability over time. Physiological variables have demonstrated to be more stable [10]. However, even with that classification, more than 20% change in one year. In our study, any of the biomarker classifications have demonstrated to be long-time stable, neither in the total studied population nor divided into clinical cluster. Furthermore, the clusters 1 and 2 that correspond to early-onset asthma, which corresponds to asthma with a greater burden of atopy, showed greater stability of biomarkers in the first two years, as previously described [2,4,5]. Other studies demonstrated that T2 low phenotype profile is more stable than T2-high [2,5,10] which agree with our results. This study was conducted under real-life conditions with no protocol-mandated therapeutic interventions. Patients on long-term maintenance oral corticosteroids or with recent OCS bursts were excluded, reducing confounding on BEC. By excluding patients on biologics and those with incomplete biomarker data, we aimed to capture the natural variability of routinely used inflammatory markers in everyday asthma care.
In conclusion, our findings highlight that some biomarkers, such as BEC and FeNO, exhibit high variability over time. This study reinforces the need of longitudinal monitoring of biomarkers in asthma managing, as about 30–40% of asthmatic patients change their phenotype during one year of follow-up and 35–50% in two years. Future research should aim to refine biomarker-based strategies to improve personalized asthma management.
CRediT authorship contribution statementAll authors listed have made a substantial, direct, and intellectual contribution to the work and approved it for publication.
Declaration of generative AI and AI-assisted technologies in the writing processArtificial intelligence has not been used for this article.
FundingThere was no source of funding for this article.
Conflict of interestThe authors have no conflict of interest with respect to this article.
The following are the supplementary data to this article:


