Lung cancer is the leading cause of cancer mortality globally and in China, largely due to late-stage diagnosis.1 In China, lung cancer accounted for 28.5% of all cancer deaths in 2022, with an estimated 733,300 deaths.2 Early detection through screening offers the potential to reduce lung cancer mortality. In the landmark U.S. National Lung Cancer Screening Trial (NLST)3 and the Dutch-Belgian Lung Cancer Screening Trial (NELSON),4 low-dose computed tomography (LDCT) screening reduced lung cancer mortality by 20% and 24%, respectively, among high-risk individuals. Consequently, LDCT screening is now recommended for high-risk populations in many countries, including China.5
As LDCT lung cancer screening (LCS) becomes more widespread, understanding uptake patterns and influencing factors is crucial for optimizing implementation and effectiveness.6 Centralized LCS programs have been proposed to standardize delivery and ensure quality control. However, real-world LDCT screening uptake (14–62%) is lower than in trials, highlighting the need to achieve and maintain high participation rates in routine care settings.7,8 While LCS is typically recommended based on age and smoking history, participation is influenced by a complex interplay of sociodemographic characteristics, lifestyle, health status, and structural factors. The impact of comorbidities on screening participation among older adults at risk for lung cancer is not well established. Comorbidities may increase screening motivation due to regular healthcare visits or create barriers to participation.
Given these complexities and the need for real-world data on LCS implementation, large-scale community-based screening programs offer valuable opportunities to study participation patterns and influencing factors. One such initiative is the Chinese Urban Cancer Screening Program (CanSPUC), which provides a comprehensive framework for investigating these issues in a real-world setting. We analyzed data from the 2013–2019 CanSPUC in Chongqing, one of the four municipalities in China. In brief, residents aged 40–74 living in the selected communities (169 communities) were invited through various channels to participate in a cancer screening program, where only those assessed as high-risk for lung cancer were recommended for LDCT at designated hospitals. The study was approved by the ethics committee (approval number 15-070/997 and approval number CZLS2022196-A).
The primary outcome was LDCT uptake within six months of initial risk assessment, with various demographic, health, and structural factors considered as variables of interest. Multivariable logistic regression models were used to calculate adjusted odds ratios for LCS uptake, incorporating variables with standardized differences>0.1 and adjusting for age and economic status a priori due to their known impact on cancer screening behaviors.9 Sensitivity analyses were performed to address potential issues with non-compliant participants and clustering effects. Statistical analyses were performed using R (version 4.3.3; R Foundation for Statistical Computing), and p<0.05 was considered statistically significant.
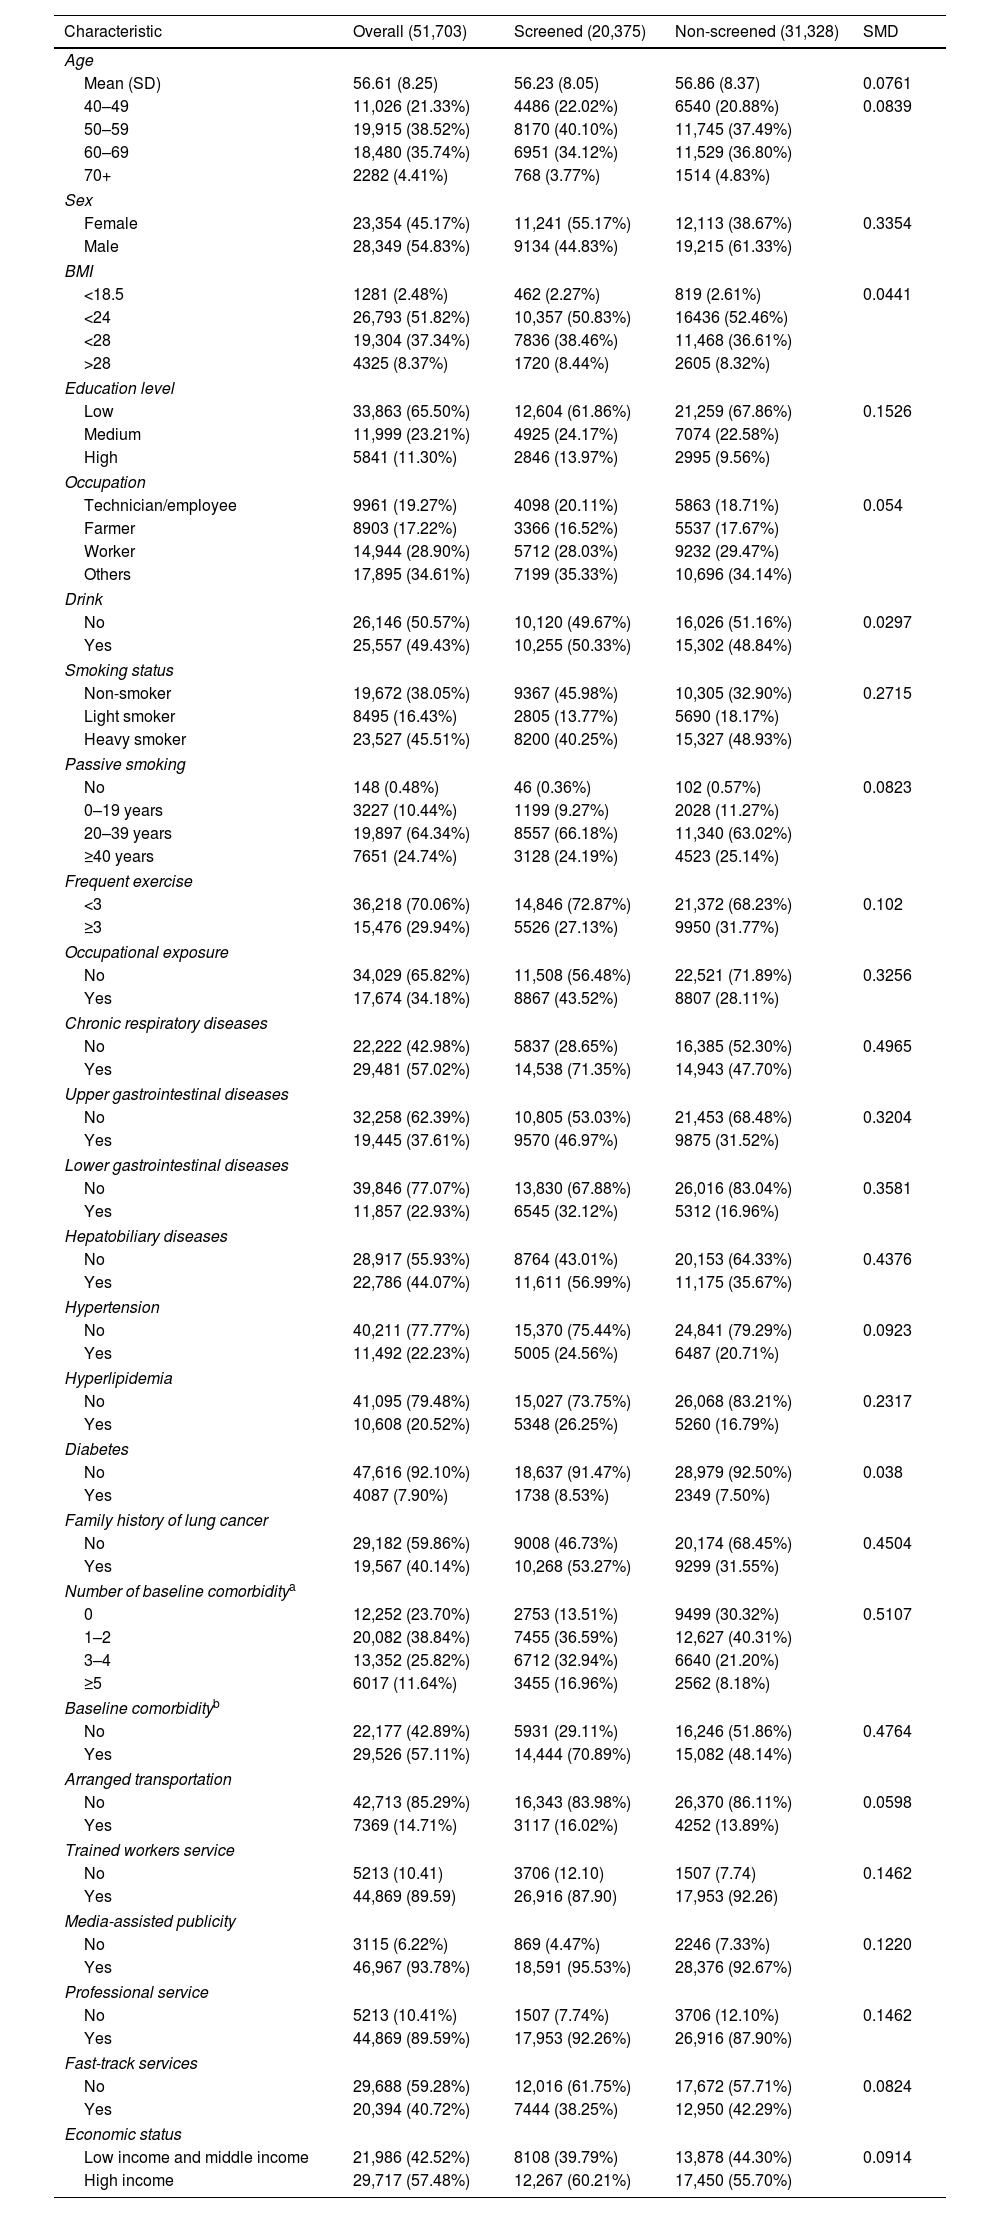
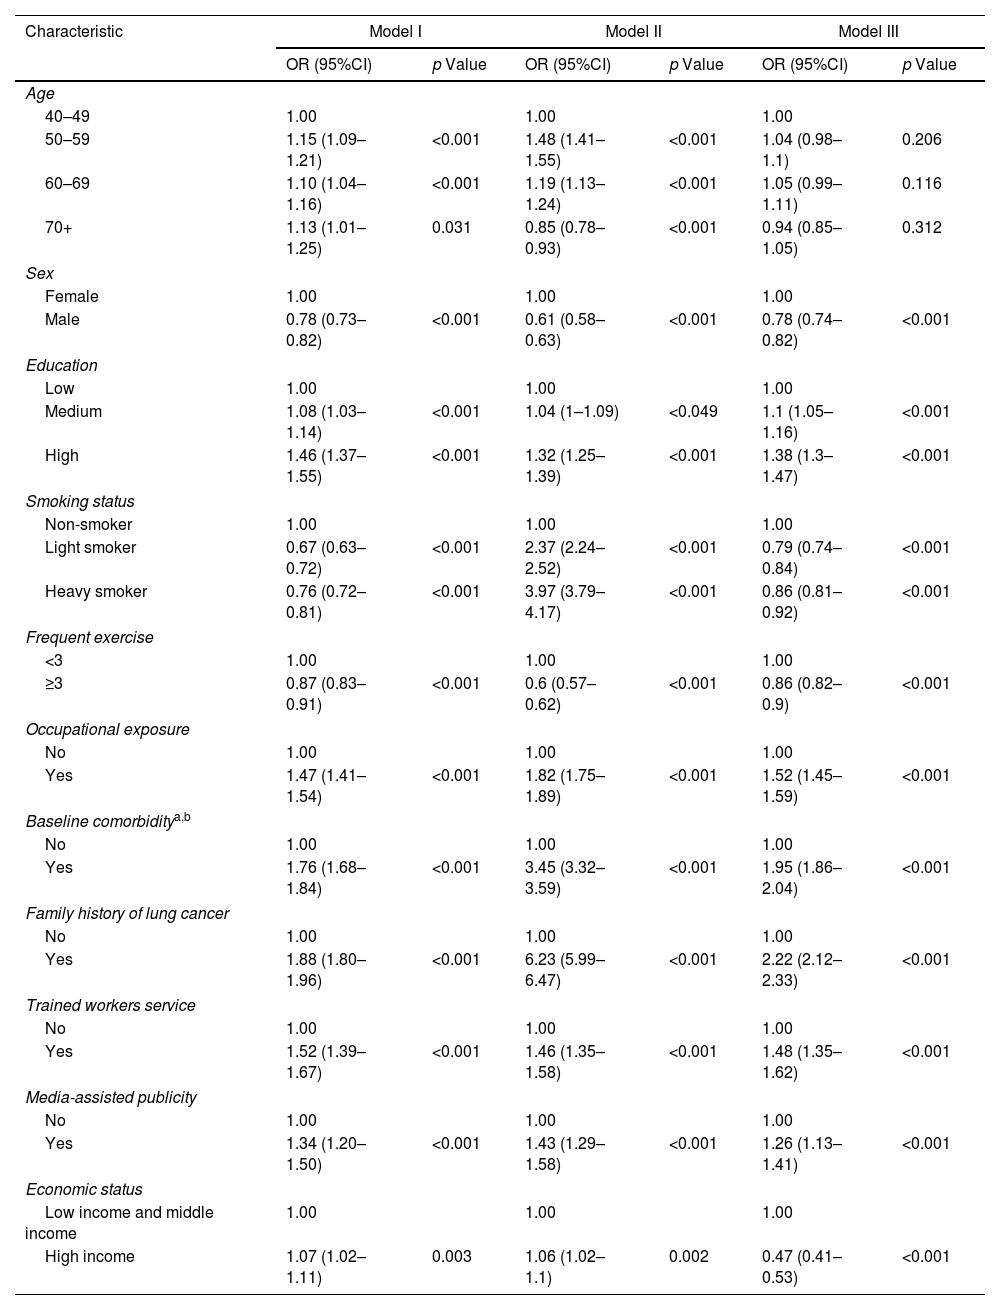
Among 278,367 participants who underwent risk assessment, 51,703 were classified as high-risk for lung cancer. The overall LDCT uptake rate was 39.41% (20,375/51,703). The study population (mean age 56.61±8.25 years) was predominantly male (54.83%), with low educational attainment (65.50%), and residing in high-income areas (57.48%). Chronic respiratory diseases were the most prevalent comorbidity (57.02%), with 25.82% of participants having 3–4 comorbidities and 11.64% having ≥5 (Table 1). Multivariable logistic regression analysis revealed that males (OR 0.78, 95% CI 0.73–0.82) and smokers (light smoker: OR 0.67, 95% CI 0.63–0.72; heavy smoker: OR 0.76, 95% CI 0.72–0.81) were less likely to undergo screening (Table 2). Factors associated with higher LDCT uptake included older age, higher education, occupational exposure, family history of lung cancer, professional services, media-assisted publicity, high-income area residence, and presence of baseline comorbidities. Sensitivity analyses accounting for non-compliant participants and clustering effects yielded results consistent with the primary analysis.
Baseline Characteristics of the Participants by LDCT Uptake Groups.
Characteristic | Overall (51,703) | Screened (20,375) | Non-screened (31,328) | SMD |
---|---|---|---|---|
Age | ||||
Mean (SD) | 56.61 (8.25) | 56.23 (8.05) | 56.86 (8.37) | 0.0761 |
40–49 | 11,026 (21.33%) | 4486 (22.02%) | 6540 (20.88%) | 0.0839 |
50–59 | 19,915 (38.52%) | 8170 (40.10%) | 11,745 (37.49%) | |
60–69 | 18,480 (35.74%) | 6951 (34.12%) | 11,529 (36.80%) | |
70+ | 2282 (4.41%) | 768 (3.77%) | 1514 (4.83%) | |
Sex | ||||
Female | 23,354 (45.17%) | 11,241 (55.17%) | 12,113 (38.67%) | 0.3354 |
Male | 28,349 (54.83%) | 9134 (44.83%) | 19,215 (61.33%) | |
BMI | ||||
<18.5 | 1281 (2.48%) | 462 (2.27%) | 819 (2.61%) | 0.0441 |
<24 | 26,793 (51.82%) | 10,357 (50.83%) | 16436 (52.46%) | |
<28 | 19,304 (37.34%) | 7836 (38.46%) | 11,468 (36.61%) | |
>28 | 4325 (8.37%) | 1720 (8.44%) | 2605 (8.32%) | |
Education level | ||||
Low | 33,863 (65.50%) | 12,604 (61.86%) | 21,259 (67.86%) | 0.1526 |
Medium | 11,999 (23.21%) | 4925 (24.17%) | 7074 (22.58%) | |
High | 5841 (11.30%) | 2846 (13.97%) | 2995 (9.56%) | |
Occupation | ||||
Technician/employee | 9961 (19.27%) | 4098 (20.11%) | 5863 (18.71%) | 0.054 |
Farmer | 8903 (17.22%) | 3366 (16.52%) | 5537 (17.67%) | |
Worker | 14,944 (28.90%) | 5712 (28.03%) | 9232 (29.47%) | |
Others | 17,895 (34.61%) | 7199 (35.33%) | 10,696 (34.14%) | |
Drink | ||||
No | 26,146 (50.57%) | 10,120 (49.67%) | 16,026 (51.16%) | 0.0297 |
Yes | 25,557 (49.43%) | 10,255 (50.33%) | 15,302 (48.84%) | |
Smoking status | ||||
Non-smoker | 19,672 (38.05%) | 9367 (45.98%) | 10,305 (32.90%) | 0.2715 |
Light smoker | 8495 (16.43%) | 2805 (13.77%) | 5690 (18.17%) | |
Heavy smoker | 23,527 (45.51%) | 8200 (40.25%) | 15,327 (48.93%) | |
Passive smoking | ||||
No | 148 (0.48%) | 46 (0.36%) | 102 (0.57%) | 0.0823 |
0–19 years | 3227 (10.44%) | 1199 (9.27%) | 2028 (11.27%) | |
20–39 years | 19,897 (64.34%) | 8557 (66.18%) | 11,340 (63.02%) | |
≥40 years | 7651 (24.74%) | 3128 (24.19%) | 4523 (25.14%) | |
Frequent exercise | ||||
<3 | 36,218 (70.06%) | 14,846 (72.87%) | 21,372 (68.23%) | 0.102 |
≥3 | 15,476 (29.94%) | 5526 (27.13%) | 9950 (31.77%) | |
Occupational exposure | ||||
No | 34,029 (65.82%) | 11,508 (56.48%) | 22,521 (71.89%) | 0.3256 |
Yes | 17,674 (34.18%) | 8867 (43.52%) | 8807 (28.11%) | |
Chronic respiratory diseases | ||||
No | 22,222 (42.98%) | 5837 (28.65%) | 16,385 (52.30%) | 0.4965 |
Yes | 29,481 (57.02%) | 14,538 (71.35%) | 14,943 (47.70%) | |
Upper gastrointestinal diseases | ||||
No | 32,258 (62.39%) | 10,805 (53.03%) | 21,453 (68.48%) | 0.3204 |
Yes | 19,445 (37.61%) | 9570 (46.97%) | 9875 (31.52%) | |
Lower gastrointestinal diseases | ||||
No | 39,846 (77.07%) | 13,830 (67.88%) | 26,016 (83.04%) | 0.3581 |
Yes | 11,857 (22.93%) | 6545 (32.12%) | 5312 (16.96%) | |
Hepatobiliary diseases | ||||
No | 28,917 (55.93%) | 8764 (43.01%) | 20,153 (64.33%) | 0.4376 |
Yes | 22,786 (44.07%) | 11,611 (56.99%) | 11,175 (35.67%) | |
Hypertension | ||||
No | 40,211 (77.77%) | 15,370 (75.44%) | 24,841 (79.29%) | 0.0923 |
Yes | 11,492 (22.23%) | 5005 (24.56%) | 6487 (20.71%) | |
Hyperlipidemia | ||||
No | 41,095 (79.48%) | 15,027 (73.75%) | 26,068 (83.21%) | 0.2317 |
Yes | 10,608 (20.52%) | 5348 (26.25%) | 5260 (16.79%) | |
Diabetes | ||||
No | 47,616 (92.10%) | 18,637 (91.47%) | 28,979 (92.50%) | 0.038 |
Yes | 4087 (7.90%) | 1738 (8.53%) | 2349 (7.50%) | |
Family history of lung cancer | ||||
No | 29,182 (59.86%) | 9008 (46.73%) | 20,174 (68.45%) | 0.4504 |
Yes | 19,567 (40.14%) | 10,268 (53.27%) | 9299 (31.55%) | |
Number of baseline comorbiditya | ||||
0 | 12,252 (23.70%) | 2753 (13.51%) | 9499 (30.32%) | 0.5107 |
1–2 | 20,082 (38.84%) | 7455 (36.59%) | 12,627 (40.31%) | |
3–4 | 13,352 (25.82%) | 6712 (32.94%) | 6640 (21.20%) | |
≥5 | 6017 (11.64%) | 3455 (16.96%) | 2562 (8.18%) | |
Baseline comorbidityb | ||||
No | 22,177 (42.89%) | 5931 (29.11%) | 16,246 (51.86%) | 0.4764 |
Yes | 29,526 (57.11%) | 14,444 (70.89%) | 15,082 (48.14%) | |
Arranged transportation | ||||
No | 42,713 (85.29%) | 16,343 (83.98%) | 26,370 (86.11%) | 0.0598 |
Yes | 7369 (14.71%) | 3117 (16.02%) | 4252 (13.89%) | |
Trained workers service | ||||
No | 5213 (10.41) | 3706 (12.10) | 1507 (7.74) | 0.1462 |
Yes | 44,869 (89.59) | 26,916 (87.90) | 17,953 (92.26) | |
Media-assisted publicity | ||||
No | 3115 (6.22%) | 869 (4.47%) | 2246 (7.33%) | 0.1220 |
Yes | 46,967 (93.78%) | 18,591 (95.53%) | 28,376 (92.67%) | |
Professional service | ||||
No | 5213 (10.41%) | 1507 (7.74%) | 3706 (12.10%) | 0.1462 |
Yes | 44,869 (89.59%) | 17,953 (92.26%) | 26,916 (87.90%) | |
Fast-track services | ||||
No | 29,688 (59.28%) | 12,016 (61.75%) | 17,672 (57.71%) | 0.0824 |
Yes | 20,394 (40.72%) | 7444 (38.25%) | 12,950 (42.29%) | |
Economic status | ||||
Low income and middle income | 21,986 (42.52%) | 8108 (39.79%) | 13,878 (44.30%) | 0.0914 |
High income | 29,717 (57.48%) | 12,267 (60.21%) | 17,450 (55.70%) |
Associations of Lung Cancer Screening With Individual and Structural Characteristics.
Characteristic | Model I | Model II | Model III | |||
---|---|---|---|---|---|---|
OR (95%CI) | p Value | OR (95%CI) | p Value | OR (95%CI) | p Value | |
Age | ||||||
40–49 | 1.00 | 1.00 | 1.00 | |||
50–59 | 1.15 (1.09–1.21) | <0.001 | 1.48 (1.41–1.55) | <0.001 | 1.04 (0.98–1.1) | 0.206 |
60–69 | 1.10 (1.04–1.16) | <0.001 | 1.19 (1.13–1.24) | <0.001 | 1.05 (0.99–1.11) | 0.116 |
70+ | 1.13 (1.01–1.25) | 0.031 | 0.85 (0.78–0.93) | <0.001 | 0.94 (0.85–1.05) | 0.312 |
Sex | ||||||
Female | 1.00 | 1.00 | 1.00 | |||
Male | 0.78 (0.73–0.82) | <0.001 | 0.61 (0.58–0.63) | <0.001 | 0.78 (0.74–0.82) | <0.001 |
Education | ||||||
Low | 1.00 | 1.00 | 1.00 | |||
Medium | 1.08 (1.03–1.14) | <0.001 | 1.04 (1–1.09) | <0.049 | 1.1 (1.05–1.16) | <0.001 |
High | 1.46 (1.37–1.55) | <0.001 | 1.32 (1.25–1.39) | <0.001 | 1.38 (1.3–1.47) | <0.001 |
Smoking status | ||||||
Non-smoker | 1.00 | 1.00 | 1.00 | |||
Light smoker | 0.67 (0.63–0.72) | <0.001 | 2.37 (2.24–2.52) | <0.001 | 0.79 (0.74–0.84) | <0.001 |
Heavy smoker | 0.76 (0.72–0.81) | <0.001 | 3.97 (3.79–4.17) | <0.001 | 0.86 (0.81–0.92) | <0.001 |
Frequent exercise | ||||||
<3 | 1.00 | 1.00 | 1.00 | |||
≥3 | 0.87 (0.83–0.91) | <0.001 | 0.6 (0.57–0.62) | <0.001 | 0.86 (0.82–0.9) | <0.001 |
Occupational exposure | ||||||
No | 1.00 | 1.00 | 1.00 | |||
Yes | 1.47 (1.41–1.54) | <0.001 | 1.82 (1.75–1.89) | <0.001 | 1.52 (1.45–1.59) | <0.001 |
Baseline comorbiditya,b | ||||||
No | 1.00 | 1.00 | 1.00 | |||
Yes | 1.76 (1.68–1.84) | <0.001 | 3.45 (3.32–3.59) | <0.001 | 1.95 (1.86–2.04) | <0.001 |
Family history of lung cancer | ||||||
No | 1.00 | 1.00 | 1.00 | |||
Yes | 1.88 (1.80–1.96) | <0.001 | 6.23 (5.99–6.47) | <0.001 | 2.22 (2.12–2.33) | <0.001 |
Trained workers service | ||||||
No | 1.00 | 1.00 | 1.00 | |||
Yes | 1.52 (1.39–1.67) | <0.001 | 1.46 (1.35–1.58) | <0.001 | 1.48 (1.35–1.62) | <0.001 |
Media-assisted publicity | ||||||
No | 1.00 | 1.00 | 1.00 | |||
Yes | 1.34 (1.20–1.50) | <0.001 | 1.43 (1.29–1.58) | <0.001 | 1.26 (1.13–1.41) | <0.001 |
Economic status | ||||||
Low income and middle income | 1.00 | 1.00 | 1.00 | |||
High income | 1.07 (1.02–1.11) | 0.003 | 1.06 (1.02–1.1) | 0.002 | 0.47 (0.41–0.53) | <0.001 |
Definition of abbreviations: OR=odds ratio; CI=confidence interval.
Model I: Standard logistic regression.
Model II: Generalized linear mixed model (GLMM) accounting for clustering effects at the community level.
Model III: Sensitivity analysis excluding individuals who did not undergo LDCT scans within our program but were diagnosed with lung cancer within six months of the initial risk assessment.
This study is the first to investigate factors influencing LCS participation in western China, particularly the association between baseline comorbidities and screening uptake. The LDCT screening uptake rate of 39.41% in our study was lower than those reported in RCTs such as the NLST and the NELSON, which had uptake rates of around 90%. The low uptake of LDCT screening in practice can significantly diminish the mortality reduction and cost-effectiveness of screening programs, as the benefits are directly proportional to the uptake rate.10 Addressing barriers to screening uptake and promoting participation among high-risk populations is crucial for maximizing the potential of LDCT screening to reduce the lung cancer burden in real-world settings.
A notable sex disparity was observed, with males less likely to participate than females, consistent with previous findings.11 This may be attributed to lower health awareness and less engagement in preventive behaviors among men.12 Age emerged as a significant predictor of LDCT screening uptake, with older individuals (aged 60–69 and 70+ years) showing higher participation rates compared to the 40–49 age group, contrary to some previous studies.9 This trend may reflect increased awareness of lung cancer risk and more frequent healthcare encounters among older adults. Similarly, we observed a novel positive association between baseline comorbidities and screening uptake, with a dose–response relationship. This correlation could be attributed to increased healthcare utilization and risk perception among those with comorbidities.13 However, screening decisions for both older adults and individuals with comorbidities should be carefully individualized, considering factors such as life expectancy, functional status, and potential harms of screening.14 These findings underscore the complex interplay between age, health status, and screening behavior in lung cancer early detection programs.
Smoking status significantly influenced participation, with both light and heavy smokers less likely to undergo screening compared to non-smokers. This finding is concerning, as smokers are at the highest risk for lung cancer and stand to benefit the most from early detection through screening.3 Integrating smoking cessation interventions with LCS programs and providing targeted education and support for smokers may be crucial for improving their participation and overall health outcomes.15 Occupational exposure, family history of lung cancer, and access to professional services and media campaigns were associated with increased uptake, underscoring the importance of risk communication and community-level interventions.16,17
Our study's strengths include its large sample size and consideration of both individual and structural factors influencing screening uptake. However, limitations exist. The study's generalizability may be limited due to specific regions and populations covered. Findings should be validated in other settings. We didn’t include some chronic conditions like arthropathies, dementia, depression, and anxiety, which might reveal different associations with screening participation. This highlights the complex relationship between health conditions and preventive behaviors, an important area for future research. Our focus was primarily on factors influencing participation, without extensively exploring implementation challenges in real-world settings. Nevertheless, our approach provides a framework for assessing participation factors in various contexts. These insights underscore the need for targeted interventions and personalized screening approaches that address specific barriers and leverage motivating factors across different population subgroups. Such strategies could potentially improve overall screening participation and, consequently, enhance the effectiveness of lung cancer early detection programs. This comprehensive approach is essential for translating the proven benefits of LDCT screening into actual mortality reductions in real-world settings.
Authors’ ContributionMH and HZ conceived the National Lung Cancer Screening project and took responsibility for its all aspects. SZ designed the study and conceived this manuscript. MH, JD, SZ wrote the manuscript, with further contributions from BL. SZ completed all the statistical analysis. All authors interpreted data, contributed to critical revisions, and approved the final version of the article. The corresponding author had full access to all the data in the study and had final responsibility for the decision to submit for publication. No author was prevented from accessing any data.
FundingThis study was funded by the First batch of key Disciplines on Public Health in Chongqing, China Early Gastrointestinal Cancer Physicians Joint Growth Program (GTCZ-2023-CQ-02), Natural Science Foundation of Chongqing China (CSTB2022NSCQ-MSX1360), and the Medical Scientific Research Project of Shapingba District of Chongqing (Joint project of Chongqing Shapingba District Health Commission and Science and Technology Bureau, 2023SQKWLH016).
Conflict of InterestsThe authors state that they have no conflict of interests.