Individuals with Down syndrome (DS) are characterized by a genetic anomaly, which is expressed with an extra copy in chromosome 21. These individuals have physiological and anatomical characteristics that increase their risk of poor respiratory health from birth compared to people without DS.1 Some common characteristics are increased lung volumes, reduced expiratory flows without response to bronchodilators, and abnormalities in respiratory mechanics.2 In addition, ∼50% of children with DS have airway obstruction due to their shorter and narrower trachea, hypotonia of the upper airway, and bronchomalacia.3
In Mexico, a previous study in DS stated the impulse oscillometry system (IOS) was the most consistent pulmonary function test among the participants’ measurements.4 Therefore, we aimed to determine whether the published reference equations for impulse oscillometry are suitable for assessing pulmonary function in people with Down syndrome.
A cohort study was conducted between October 2014 and January 2018. Three hundred two subjects with DS were recruited from special schools for DS in Mexico City and measured up to four times (Fig. S1). The Research and Ethics Committees authorized the study with No. E02-13. Methodological details are described in a previous article.4
Briefly, it was considered that the participants did not present respiratory symptomatology in the last 15 days before the test and did not have a diagnosis of asthma, fibrosis, or chronic obstructive pulmonary disease. Symptoms and the history of comorbidities were obtained using a standardized questionnaire. The question used to ask about comorbidities was: Has your child ever been diagnosed with comorbidity by his or her doctor?
We calculated predicted values, z-scores, the upper limit of normal (ULN, 95th percentile) for resistances R5, R10, R15, R20, Fres, and AX, and the lower limit of normal (LLN, 5th percentile) for reactances X5 and X10 using published reference equations.5–14 The predicted values and z-scores from each reference equation were smoothed by locally weighted regression to plot them vs. age, height, and BMI. Analysis was performed using the statistical package STATA ver.14 (Stata Corp., College Station, TX, USA).
A total of 302 participants were recruited from Mexico City and its metropolitan area, of which 249 participants between 5 and 55 years old took the IOS test and met the repeatability criteria (CV R5 <15%). This analysis included 558 measurements (282 men and 276 women) (Fig. S1). Frequencies of sex and comorbidities are described in Table S1, while Table S2 depicts statistics for anthropometrics and the observed values of the oscillometry variables.
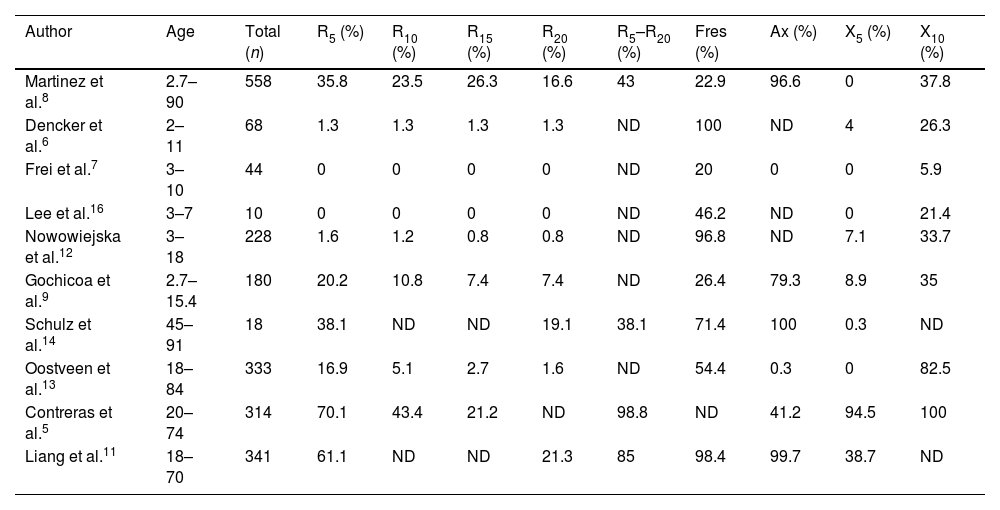
Table 1 describes the percentage of participants above the ULN for resistances, Fres, and Ax, while the LLN for reactance. Considering resistances, the proportion of measurements with a higher value than the ULN was less than 5% with the reference values of Dencker et al., Frei et al., and Lee et al., although these equations comprise very short age ranges. Regarding X5, the proportion of measurements above the LLN was under 5% with the equations of Martinez et al., Dencker et al., Frei et al., Lee et al., Schulz et al., and Oostveen et al. Figs. S2–S6 describe the z-score vs. age for all oscillometric variables. None of the equations adequately fit the entire age range or all oscillometry variables. Additionally, we compared (not statistically) the anthropometrics from the population of each study vs. the down population (Tables S3 and S4). Children with and without DS had a similar anthropometric, while adults did not.
The Proportion of Measurements Above ULN for Resistances, Fres and AX, and Below LLN for Reactances.
Author | Age | Total (n) | R5 (%) | R10 (%) | R15 (%) | R20 (%) | R5–R20 (%) | Fres (%) | Ax (%) | X5 (%) | X10 (%) |
---|---|---|---|---|---|---|---|---|---|---|---|
Martinez et al.8 | 2.7–90 | 558 | 35.8 | 23.5 | 26.3 | 16.6 | 43 | 22.9 | 96.6 | 0 | 37.8 |
Dencker et al.6 | 2–11 | 68 | 1.3 | 1.3 | 1.3 | 1.3 | ND | 100 | ND | 4 | 26.3 |
Frei et al.7 | 3–10 | 44 | 0 | 0 | 0 | 0 | ND | 20 | 0 | 0 | 5.9 |
Lee et al.16 | 3–7 | 10 | 0 | 0 | 0 | 0 | ND | 46.2 | ND | 0 | 21.4 |
Nowowiejska et al.12 | 3–18 | 228 | 1.6 | 1.2 | 0.8 | 0.8 | ND | 96.8 | ND | 7.1 | 33.7 |
Gochicoa et al.9 | 2.7–15.4 | 180 | 20.2 | 10.8 | 7.4 | 7.4 | ND | 26.4 | 79.3 | 8.9 | 35 |
Schulz et al.14 | 45–91 | 18 | 38.1 | ND | ND | 19.1 | 38.1 | 71.4 | 100 | 0.3 | ND |
Oostveen et al.13 | 18–84 | 333 | 16.9 | 5.1 | 2.7 | 1.6 | ND | 54.4 | 0.3 | 0 | 82.5 |
Contreras et al.5 | 20–74 | 314 | 70.1 | 43.4 | 21.2 | ND | 98.8 | ND | 41.2 | 94.5 | 100 |
Liang et al.11 | 18–70 | 341 | 61.1 | ND | ND | 21.3 | 85 | 98.4 | 99.7 | 38.7 | ND |
ND: no data.
The IOS reference equations have been estimated for populations without DS, and the goodness of fit of this equation has shown a wide variety when used in persons with DS in Mexico City. The bad adjustment could be explained by anthropometrics, the independent variables included in the regression models, the comorbidities suffered by people with DS, the oscillometers, or the altitude of the residence place.
Considering the anthropometric (Tables S3 and S4), children aged 2–15 with and without DS had a similar weight, height, and BMI. The adult population without Down syndrome was taller and heavier but had a similar body mass index to those with DS.5,11,13 Therefore, as age increases, the anthropometry between the population with and without DS is increasingly different, mainly in height, which decreases in the Down population. Smaller lungs and airways would cause higher resistance in the DS population.
Regarding the adjustment variables used in the reference equations, we consider at least sex and age should be included in all the models because these variables could adjust the effects (coefficients) of other variables included in the equations. In children, only one equation considered these two variables, while in adults, all studies included them.
Among the studies, the noticed differences in the signs of the coefficients between anthropometric and dependent variables that may be due to altitude (Table S5). However, no study has included altitude in the reference equations for OSI to clarify this conjecture. Practically all the studies used the Jaeger equipment (Tables S3 and S4) except for the study by Oostveen et al.13 Therefore, the equipment may be a factor that is not influencing the adjustment of the equations.
On the other hand, DS population has very particular anatomical characteristics that make their diagnosis using equations obtained from the population without DS less appropriate, despite using the equation with the best fit for a given variable. For example, any of the equations predict well the values observed in the population with DS for R5 and R20 vs. age (Figs. S11 and S12), although not so for the difference of R5–R20 (Fig. S13), where the observed values are above the rest of the smoothed values, suggesting obstruction of the peripheral airways. A study described that children with SD present a smaller tracheal diameter (between 1.30 and 3.20mm difference) than the control group without SD at the same age.15 An obstruction may be diagnosed when it does not exist. Regarding reactance, there seems to be no difference in the elastic recoil between the populations with and without DS, at least in X5.
On the other hand, the value of Fres is the point that divides large airways from small airways based on the mechanical properties of the airways and not by airway size, which is higher in children and decreases with age. However, in women with Down syndrome, a decrease is observed until 25 years old and then increases again. We cannot determine the factors influencing this behavior, but the published equations do not consider this difference. Figs. S16–S20 and S21–S25 show the predicted values vs. height and BM, where a poor fit of the equations is also observed.
The main limitations of this study included the parents did not allow bronchodilator application. On the other hand, obtaining more measurements was impossible because their attendance to take the tests depended entirely on the time available to the parents, causing them to leave the study. Additionally, the participants resided at the same altitude.
We conclude the reference equations for IOS have limitations for the DS population. Until there are adequate reference equations for this population, we suggest the lung function be evaluated through oscillometry periodically over time to detect any changes in the resistance or reactances trajectories that make one suspect a respiratory disease.
CRediT Authorship Contribution StatementConception and design: RFP, RPP, AHI, and MCL.
Acquisition data: RFP, CRH, DCJ, and MPK.
Analysis: RFP and DMB.
Interpretation: RFP, LGR, RPP, and AHI.
Drafting: RFP, LGR, RPP, MCL, and DMB.
Final approval: RFP, LGR, RPP, AHI, CRH, DCJ, MPK, MCL, and DMB.
Declaration of Generative AI and AI-assisted Technologies in the Writing ProcessNone declared.
FundingThis study was supported by Mexico's National Council for Science and Technology (CONACYT) [grant number 233621, 2014].
Conflicts of InterestThe authors declare that no conflicts of interest may be considered to directly or indirectly influence the manuscript's content.
We thank Dr. Karla Adney Flores from the National Institute of Pediatrics’ Down Clinic, the Colegio de Apoyo Educativo Down A.C., and the CTDUCA foundation for promoting the study among families of people with Down syndrome.