Journal Information
Share
Share
Download PDF
More article options
Visits
488
Original Article
Full text access
Available online 20 December 2024
Clinical Implications of Functional Imaging in the Assessment of Bronchiectasis-Associated Sarcopenia
Visits
488
Mariela Alvarado-Mirandaa,b,c, Alberto Solanod, Salvatore Marsicod, Adriana Núñez-Robainasa,b, Maria Cinta Cumpli-Gargalloa, Marina Sáinza, José María Maiquesd, Esther Barreiroa,b,
Corresponding author
ebarreiro@researchmar.net

Corresponding author.
a Pulmonology Department-Muscle Wasting and Cachexia in Chronic Respiratory Diseases and Lung Cancer Research Group, IMIM-Hospital del Mar, Parc de Salut Mar, Department of Medicine and Life Sciences (MELIS), Universitat Pompeu Fabra (UPF), Barcelona Biomedical Research Park (PRBB), Dr. Aiguader, 88, E-08003 Barcelona, Spain
b Centro de Investigación en Red de Enfermedades Respiratorias (CIBERES), Instituto de Salud Carlos III (ISCIII), Monforte de Lemos, 5, E-28029 Madrid, Spain
c Pulmonology Department, Hospital Universitari Mutua Terrassa, Barcelona, Spain
d Radiology Department, Imatge Mèdica Intercentres-Parc de Salut Mar, Hospital del Mar, Barcelona, Spain
This item has received
Received 01 July 2024. Accepted 25 November 2024
Article information
Abstract
Full Text
Bibliography
Download PDF
Statistics
Figures (6)
Show moreShow less
Tables (3)
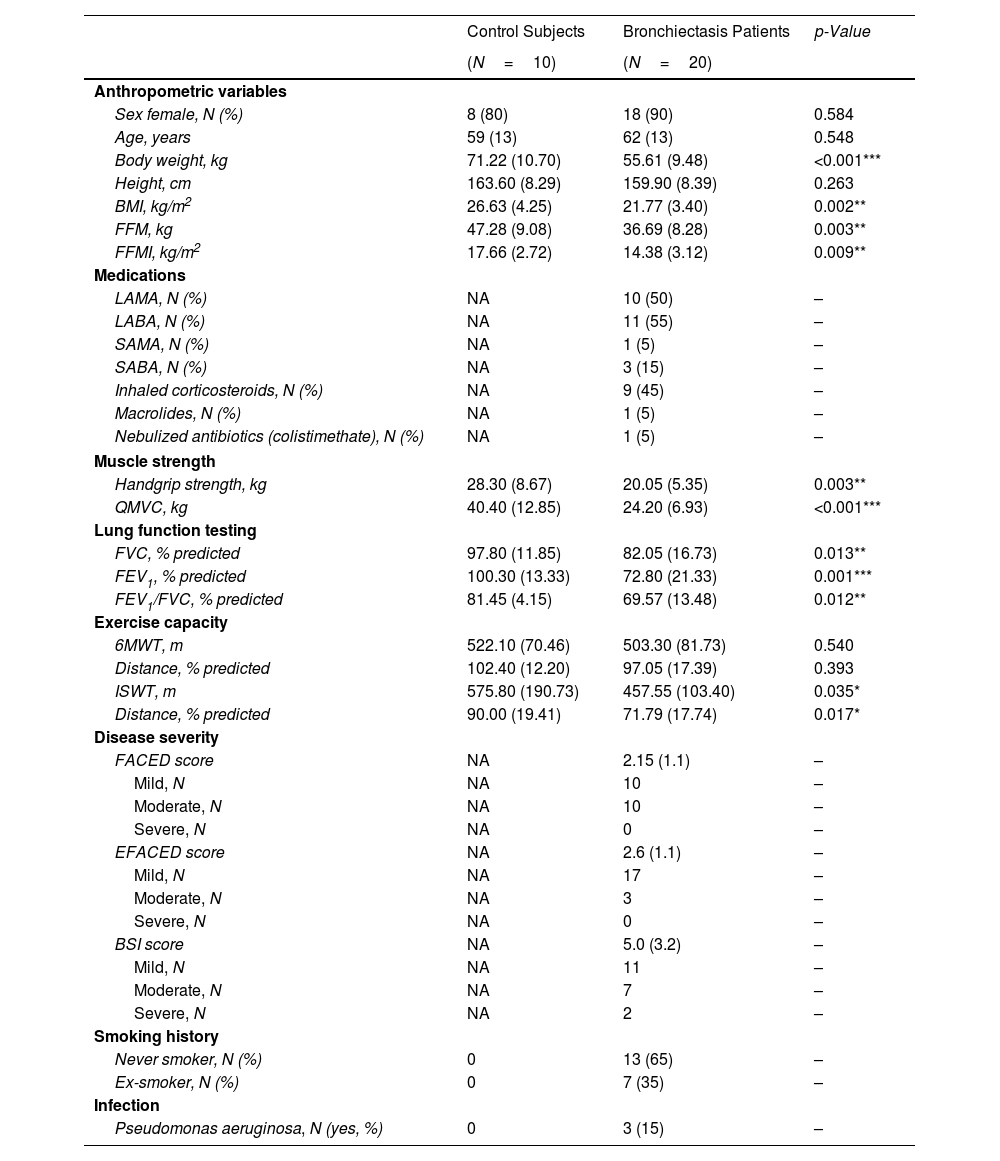
Table 1. Clinical Characteristics of the Study Patients.
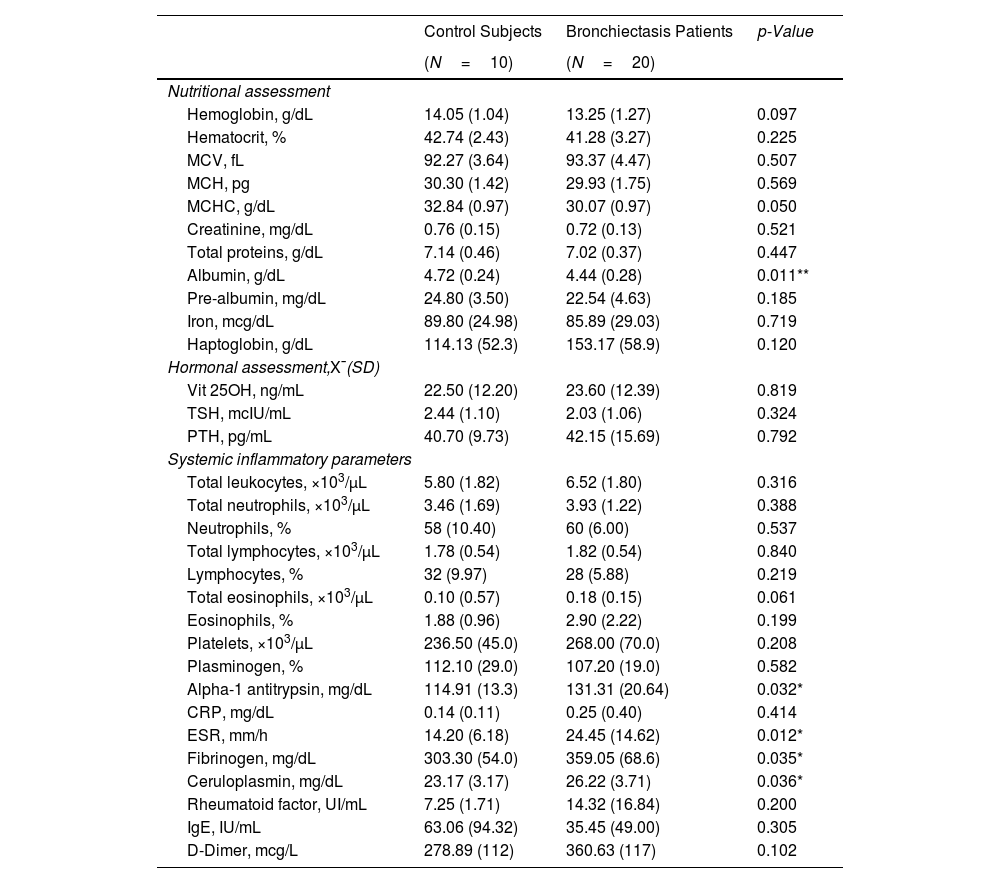
Table 2. Nutritional and Systemic Inflammatory Parameters of the Study Patients.
Table 3. Fiber Type Characteristics of the Vastus Lateralis in the Study Subjects.
Show moreShow less
Additional material (1)
Abstract
Introduction

Bronchiectasis is a complex lung disease with poorly studied systemic manifestations. Patients with bronchiectasis-associated sarcopenia exhibit a specific differential profile of functional muscle phenotype (vastus lateralis, VL), which may be analyzed using imaging (ultrasound and magnetic resonance imaging, MRI).

Methods

Ultrasound and MRI were used to explore functional imaging parameters in quadriceps of 20 patients with stable bronchiectasis and 10 healthy controls. In muscle specimens (open biopsy procedures), muscle phenotype (fiber morphometry and structural abnormalities, immunohistochemistry) was also evaluated. Patients and controls were clinically and functionally evaluated.

Results

In muscles of patients compared to controls, a significant decline in body composition parameters (BMI and FFMI), muscle function (upper and lower limbs), lung function, and exercise capacity was detected, ultrasonography revealed decreased muscle thickness and area, while MRI demonstrated increased fat infiltration, which positively correlated with the bronchiectasis severity scores. Structural parameters (proportions of hybrid fibers, internal nuclei, abnormal fibers, and apoptotic nuclei) were significantly greater in the VL of patients than in controls and inversely correlated with quadriceps muscle function and exercise capacity in the former.

Conclusions

In patients with stable mild-to-moderate bronchiectasis, sarcopenia was clinically evidenced through the significant reduction in muscle mass and upper and lower limb muscle function. Non-invasive ultrasound and MRI techniques showed that features of muscle quality architecture and fat infiltration are hallmarks of bronchiectasis-associated sarcopenia. Functional radiological tools should be implemented in clinical settings to early diagnose and monitor sarcopenia in these patients.

Keywords:
Bronchiectasis
Sarcopenia
Quadriceps muscle function
Ultrasound
Magnetic resonance imaging
Muscle abnormalities
Graphical abstract
Full Text
Introduction

Sarcopenia, defined as the loss of muscle mass and function, is a major comorbidity in patients with chronic obstructive pulmonary disease (COPD) and other chronic disorders.1–3 Muscle wasting and dysfunction have a prognostic value in clinical settings as they are directly related to the overall survival of the patients regardless of the status of the respiratory disease.4,5 Importantly, several pathophysiological and biological mechanisms have been shown to underlie muscle protein loss and weakness in patients with COPD.6 Whether similar findings can be encountered in patients with other chronic respiratory diseases remains to be thoroughly assessed.

Bronchiectasis is a chronic airways disease, characterized by a specific clinical and radiological presentation that includes a permanent dilatation of the bronchi, resulting from a great variety of etiologies.7,8 Recently, muscle weakness was demonstrated in both the upper and the lower limb muscles in patients with bronchiectasis.9 In that study, the female patients experienced a more severe muscle dysfunction along with a significantly worse body composition than male patients.9 Patients in that study 9 exhibited a mild-to-moderate respiratory disease and the lung radiological extension was also relatively moderate. We concluded that impaired muscle strength was observed in both upper and lower extremities of patients with mild bronchiectasis.9 Whether in patients with bronchiectasis, muscle weakness may correlate with disease severity and other clinical features such as functional imaging remains to be answered.

Several imaging techniques are currently available for the diagnosis of sarcopenia. So far, most of the studies on sarcopenia have been conducted using computed tomography (CT) scans of the quadriceps, a very clinically relevant muscle due to its large size and relevant function.10 In a seminal investigation,11 mid-thigh cross sectional area (MTCSA) as measured using CT scan was demonstrated to be a much better predictor of mortality than BMI in the patients, particularly in those with severe COPD. B-mode ultrasound offers a comprehensive assessment of muscle mass, encompassing thickness, architecture, echogenicity, pennation angle, fascicle length, and cross-sectional area.12 It even allows for the evaluation of muscle microcirculation parameters.13 Ultrasound parameters correlate well with strength and may be of prognostic value in the patients.13 Magnetic resonance imaging (MRI) provides a detailed pictures of both muscle mass and quality, including the ability to detect age-related variations in muscle function.14 Both ultrasound and MRI excel in the structural differentiation of muscle and adipose tissues, allowing for the exploration of muscle thickness and intramuscular fatty infiltration.

We hypothesized that patients with bronchiectasis-associated sarcopenia exhibit a specific differential profile of functional muscle phenotype that can be analyzed using imaging procedures such as ultrasound and MRI. In the vastus lateralis of the quadriceps muscle of patients with bronchiectasis-associated sarcopenia, the following objectives were studied: (1) analysis of muscle architecture using imaging techniques such as ultrasound and MRI, (2) evaluation of muscle phenotype including morphometry, damage, and apoptotic nuclei, and (3) examination of potential correlations between imaging and histological variables along with clinical parameters including muscle function. A group of age-matched control subjects was also recruited for the purpose of the study, in whom muscle biopsies were also obtained and analyzed accordingly.

MethodsStudy Design and Population

This was a prospective, controlled, cross-sectional study, in which 20 sedentary patients (18 females) with stable bronchiectasis 15 and ten age- and sex-matched sedentary healthy controls were recruited consecutively from the Multidisciplinary Bronchiectasis Unit of the Respiratory Department at Hospital del Mar (Barcelona) over the years 2020–2023. The diagnosis of non-cystic fibrosis bronchiectasis was established according to clinical criteria, following the recommendations of national and international guidelines.16 In the patients, reduced muscle mass was defined as a fat-free mass index (FFMI)18kg/m2, cut-off value established for a Mediterranean population in accordance with both previously published criteria 17,18 and the international consensus on the definition of sarcopenia, a muscle disease characterized by reduced muscle strength.2,3 Muscle weakness was defined on the basis of previous investigations (approximately 25% reduction in quadriceps force compared to that observed in control subjects).17,19 Patients were clinically stable at the time of study entry, without episodes of exacerbation or oral steroid treatment in the previous three months. None of them presented significant comorbidities. Ten age-matched healthy controls (8 females) were also recruited from the general population (patients’ relatives or friends) in the same Unit. Control subjects were non-smokers and had normal lung function and body composition. Both patients and healthy controls were qualified as sedentary.20 The following exclusion criteria were defined: acute or chronic respiratory failure, COPD, other chronic respiratory diseases including asthma, coronary artery disease, limiting osteoarticular disease, chronic metabolic diseases of any etiology, presence of paraneoplastic syndrome, myopathies, treatment with oral steroids or other drugs with potential effects on muscle structure or function. Both patients and controls were Caucasian.

Ethics

The current study was designed following the guidelines of the World Medical Association for Research in Humans (Seventh revision of the Declaration of Helsinki, Fortaleza, Brazil, 2013) and the ethical standards on human experimentation in our institution. The study is part of the ongoing Respiratory Sarcopenia Program in our group, which was approved by the Institutional Ethics Committee on Human Investigation (Protocol # 2019/8955/I). An informed written consent was obtained voluntarily from both patients and control subjects.

Clinical Assessment

Clinical and analytical evaluation. A conventional anamnesis and physical examination were carried out and the FACED (FEV1 Age, Colonization by Pseudomonas aeruginosa, Extent of bronchiectasis, Dyspnea), EFACED, and BSI (BMI, FEV1, age, chronic colonization by P. aeruginosa and other microorganisms, extension, exacerbation, dyspnea) scores were calculated. Conventional sputum analyses were also performed.

Lung function testing. In all patients, on an outpatient basis, forced spirometry was performed using a spirometer (EasyOne, ndd Medical Technologies, Zurich, Switzerland).

Nutritional status evaluation. This included the calculation of the body mass index (BMI) and lean mass (fat-free mass index, FFMI), using bioelectrical impedance (Bodystat 1500, Bodystat Ltd., Isle of Man, British Isles), and conventional blood analytical parameters (proteins, albumin, cholesterol, fibrinogen, C-reactive protein, and other acute phase reactants, and hemogram).

Evaluation of upper and lower limb muscle function. Handgrip strength was evaluated using a specific dynamometer (Jamar 030J1, Chicago, IL, USA). The maximum voluntary contraction of the flexor muscles of the non-dominant hand was assessed. The maximum muscle velocity contraction (QMVC) was determined using an isometric dynamometer (Biopac Systems, Goleta, CA, USA) connected to a digital polygraph (Biopac Systems).

Exercise tolerance. Exercise tolerance was evaluated using two tests: the 6-min walk test (6MWT) and the progressive-load walking test (ISWT, incremental shuttle-walk test) according to current guidelines.21 The outcome was the distance walked, which was calculated using the number of complete shuttles. Reference values by Enright et al. were used.22

Blood and Muscle Specimens

Blood and muscle specimens were obtained as previously described.17,18

Imaging Assessment of Quadriceps Muscle

Ultrasound and Shear Wave Elastography (SWE). See the online supplement for methodological details.23,24

Magnetic resonance imaging (MRI). See the online supplement for methodological details.25–27

Biological Analyses

Muscle fiber counts and morphometry. See the online supplement for methodological details.17

Muscle structural abnormalities. See the online supplement for methodological details.18,28

Terminal deoxynucleotidyl transferase-mediated dUTP nick-end labeling (TUNEL). See the online supplement for methodological details.29

Statistical Analysis

Sedentary control subjects were age-matched (2:1) establishing a threshold of 70 years (younger or older) with the sedentary patients (12 patients and 6 controls were younger than 70 years and 8 patients and 4 controls were older than 70 years). Sex-matching was performed in equal proportions (1:1) to ensure enough representation of both sexes in each study group.30

The functional parameter QMVC was used to calculate sample size in patients and healthy controls with mean and standard deviation 30 (2.5)kg in the patients and 40 (2.5)kg in the control subjects, respectively, alpha risk 0.05 and beta risk 0.2 (80% power), using the software GRANMO 8 (IMIM-REGICOR, Barcelona, Spain). To identify a minimum difference of 3kg between the two groups, 18 patients and 9 control subjects had to be recruited. Furthermore, a post hoc power analysis was also calculated, in which an alpha risk of 0.05 was accepted in a bilateral test with 10 subjects in the control group and 20 subjects in the patient group, which resulted in 94% power.

The normality of the study variables was checked using the Shapiro–Wilk test. In the continuous variables, an independent-sample Student's T-test (parametric) or a Mann–Whitney U test (non-parametric) was used to analyze the differences between the two study groups, when appropriate. Chi-squared test was used to analyze differences for the categorical variables between the two groups. Results are expressed as mean (standard deviation) and median (interquartile range) when appropriate. Study variables are shown in tables and figures (violin plots). In the patients, the existence of potential correlations between specific clinical and functional variables on the one hand and radiological and biological variables on the other was specifically interrogated ad hoc. The Pearson's correlation coefficient (parametric) and Spearman's rank-order correlation coefficient (nonparametric) were used to explore the significance of the correlations. Correlations are displayed in graphical correlation matrices, obtained from R package corrplot (https://cran.r-project.org/web/packages/corrplot/index.html, accessed 25.1.24), in different colors: blue for positive correlations and red for negative ones. Furthermore, significant correlations are also represented individually in scatter plots in the online supplement.

ResultsClinical Features of the Study Subjects

No significant differences were observed in age or sex proportions between patients and controls (Table 1). Body weight, BMI, FFMI parameters and strength of the upper (handgrip) and lower limb (QMVC) muscles were significantly lower in the patients than in the controls (Table 1). Spirometry values were reduced in the patients compared to healthy subjects (Table 1). In the patients, a significant decline in the exercise capacity as measured by the incremental shuttle walk test was also observed (Table 1). Among the patients, age inversely correlated with QMVC (r=−0.584, p=0.007) and exercise capacity (r=−0.469, p=0.037) (Figs. S1A and S2). Bronchiectasis patients exhibited a mild disease as indicated by the severity scores, were not current smokers, and only three patients exhibited chronic bronchial infection by P. aeruginosa (Table 1). Compared to the controls, a significant rise in several systemic inflammatory (acute phase reactants) parameters was observed in the patients, whereas albumin levels diminished and those of hormones and vitamin D did not differ (Table 2A).

Table 1.

Clinical Characteristics of the Study Patients.

  Control Subjects  Bronchiectasis Patients  p-Value 
  (N=10)  (N=20)   
Anthropometric variables
Sex female, N (%)  8 (80)  18 (90)  0.584 
Age, years  59 (13)  62 (13)  0.548 
Body weight, kg  71.22 (10.70)  55.61 (9.48)  <0.001*** 
Height, cm  163.60 (8.29)  159.90 (8.39)  0.263 
BMI, kg/m2  26.63 (4.25)  21.77 (3.40)  0.002** 
FFM, kg  47.28 (9.08)  36.69 (8.28)  0.003** 
FFMI, kg/m2  17.66 (2.72)  14.38 (3.12)  0.009** 
Medications
LAMA, N (%)  NA  10 (50)  – 
LABA, N (%)  NA  11 (55)  – 
SAMA, N (%)  NA  1 (5)  – 
SABA, N (%)  NA  3 (15)  – 
Inhaled corticosteroids, N (%)  NA  9 (45)  – 
Macrolides, N (%)  NA  1 (5)  – 
Nebulized antibiotics (colistimethate), N (%)  NA  1 (5)  – 
Muscle strength
Handgrip strength, kg  28.30 (8.67)  20.05 (5.35)  0.003** 
QMVC, kg  40.40 (12.85)  24.20 (6.93)  <0.001*** 
Lung function testing
FVC, % predicted  97.80 (11.85)  82.05 (16.73)  0.013** 
FEV1, % predicted  100.30 (13.33)  72.80 (21.33)  0.001*** 
FEV1/FVC, % predicted  81.45 (4.15)  69.57 (13.48)  0.012** 
Exercise capacity
6MWT, m  522.10 (70.46)  503.30 (81.73)  0.540 
Distance, % predicted  102.40 (12.20)  97.05 (17.39)  0.393 
ISWT, m  575.80 (190.73)  457.55 (103.40)  0.035* 
Distance, % predicted  90.00 (19.41)  71.79 (17.74)  0.017* 
Disease severity
FACED score  NA  2.15 (1.1)  – 
Mild, N  NA  10  – 
Moderate, N  NA  10  – 
Severe, N  NA  – 
EFACED score  NA  2.6 (1.1)  – 
Mild, N  NA  17  – 
Moderate, N  NA  – 
Severe, N  NA  – 
BSI score  NA  5.0 (3.2)  – 
Mild, N  NA  11  – 
Moderate, N  NA  – 
Severe, N  NA  – 
Smoking history
Never smoker, N (%)  13 (65)  – 
Ex-smoker, N (%)  7 (35)  – 
Infection
Pseudomonas aeruginosa, N (yes, %)  3 (15)  – 

Continuous variables are presented as mean (standard deviation), while categorical variables are presented as the number of patients in each group along with the percentage for the study group. Definition of abbreviations: X̅N, number; NA, not applicable; BMI, body mass index; FFM, fat free mass; FFMI, fat free mass index; LAMA, long-acting muscarinic receptor antagonist; LABA, long-acting β2-agonist; SAMA, short-acting muscarinic receptor antagonist; SABA, short-acting β2-agonist; FVC, forced vital capacity; FEV1, forced expiratory volume in 1s; FEV1/FVC ratio of the forced expiratory volume in the first 1s to the forced vital capacity of the lungs; 6MWT, six-minute walk test distance; ISWT, Incremental Shuttle Walk Test; QMVC, quadriceps maximum voluntary contraction; mg, milligrams; kg, kilograms; m, meters; cm, centimeters.

Statistical significance:

*

p0.05.

**

p0.01.

***

p0.001 between bronchiectasis patients and control subjects.

Table 2.

Nutritional and Systemic Inflammatory Parameters of the Study Patients.

  Control Subjects  Bronchiectasis Patients  p-Value 
  (N=10)  (N=20)   
Nutritional assessment
Hemoglobin, g/dL  14.05 (1.04)  13.25 (1.27)  0.097 
Hematocrit, %  42.74 (2.43)  41.28 (3.27)  0.225 
MCV, fL  92.27 (3.64)  93.37 (4.47)  0.507 
MCH, pg  30.30 (1.42)  29.93 (1.75)  0.569 
MCHC, g/dL  32.84 (0.97)  30.07 (0.97)  0.050 
Creatinine, mg/dL  0.76 (0.15)  0.72 (0.13)  0.521 
Total proteins, g/dL  7.14 (0.46)  7.02 (0.37)  0.447 
Albumin, g/dL  4.72 (0.24)  4.44 (0.28)  0.011** 
Pre-albumin, mg/dL  24.80 (3.50)  22.54 (4.63)  0.185 
Iron, mcg/dL  89.80 (24.98)  85.89 (29.03)  0.719 
Haptoglobin, g/dL  114.13 (52.3)  153.17 (58.9)  0.120 
Hormonal assessment,(SD)
Vit 25OH, ng/mL  22.50 (12.20)  23.60 (12.39)  0.819 
TSH, mcIU/mL  2.44 (1.10)  2.03 (1.06)  0.324 
PTH, pg/mL  40.70 (9.73)  42.15 (15.69)  0.792 
Systemic inflammatory parameters
Total leukocytes, ×103/μL  5.80 (1.82)  6.52 (1.80)  0.316 
Total neutrophils, ×103/μL  3.46 (1.69)  3.93 (1.22)  0.388 
Neutrophils, %  58 (10.40)  60 (6.00)  0.537 
Total lymphocytes, ×103/μL  1.78 (0.54)  1.82 (0.54)  0.840 
Lymphocytes, %  32 (9.97)  28 (5.88)  0.219 
Total eosinophils, ×103/μL  0.10 (0.57)  0.18 (0.15)  0.061 
Eosinophils, %  1.88 (0.96)  2.90 (2.22)  0.199 
Platelets, ×103/μL  236.50 (45.0)  268.00 (70.0)  0.208 
Plasminogen, %  112.10 (29.0)  107.20 (19.0)  0.582 
Alpha-1 antitrypsin, mg/dL  114.91 (13.3)  131.31 (20.64)  0.032* 
CRP, mg/dL  0.14 (0.11)  0.25 (0.40)  0.414 
ESR, mm/h  14.20 (6.18)  24.45 (14.62)  0.012* 
Fibrinogen, mg/dL  303.30 (54.0)  359.05 (68.6)  0.035* 
Ceruloplasmin, mg/dL  23.17 (3.17)  26.22 (3.71)  0.036* 
Rheumatoid factor, UI/mL  7.25 (1.71)  14.32 (16.84)  0.200 
IgE, IU/mL  63.06 (94.32)  35.45 (49.00)  0.305 
D-Dimer, mcg/L  278.89 (112)  360.63 (117)  0.102 

Continuous variables are presented as mean (standard deviation). Definition of abbreviations: N, number; CRP, C-reactive protein; ESR, erythrocyte sedimentation rate; IgE, immunoglobulin-E; MCV, mean corpuscular (erythrocyte) volume; MCH, mean corpuscular hemoglobin; MCHC, mean corpuscular hemoglobin concentration; TSH, thyroid-stimulating hormone; PTH, parathyroid hormone; μL, microliter; dL, deciliter; L, liter; mg, milligrams; mm, millimeters; mcg, micrograms; ng, nanogram; pg, picogram; UI, international unity; h, hour.

Statistical significance:

*

p0.05.

**

p0.01 between bronchiectasis patients and control subjects.

Functional Imaging Muscle Phenotype

Ultrasound assessment. The thickness and area of the VL were significantly reduced in the patients compared to limb muscles in the control subjects (Fig. 1A and B). Values of the parameters muscle length or pennation angle did not significantly differ between patients and healthy controls 1B). The VL muscle area negatively correlated with age (r=−0.508, p=0.026) and FACED score (r=−0.461, p=0.047) (Figs. S1A and S3).

Fig. 1.

(A) Axial plane (upper panel) and sagittal longitudinal axis (bottom panel) ultrasound images of VL muscle. Muscle area was measured using a yellow line on ultrasound. Left panels show a normal muscle volume, thickness and ultrasound pattern. Right panels show a reduced muscle volume and thickness (hypotrophy). (B) Violin plots with median (dashed line), first and third quartiles (dotted lines) and maximum and minimum values of muscle thickness, fiber length, area and pennation angle absolute values by ultrasound in control subjects and bronchiectasis patients. Definition of abbreviations: VL, vastus lateralis; cm, centimeter; ns, not significant. Statistical significance: *p<0.05.

(0.18MB).

Shear Wave Elastography (SWE). Elastography measurements did not significantly differ between patients and control subjects (Fig. 2A and B).

Fig. 2.

(A) Longitudinal sagittal plane SWE ultrasound image. The image shows a color box in the muscle zone. Adjacent ROIs were used to measure tissue elasticity. Note that the elasticity is expressed in kPa and in speed (m/s). (B) Violin plots with median (dashed line), first and third quartiles (dotted lines) and maximum and minimum values of VL elastography in control subjects and bronchiectasis patients. Definition of abbreviations: SWE, shear wave elastography; ROIs, regions of interest; kPa, kilopascal; m/s, meters per second; VL, vastus lateralis; ns, not significant.

(0.09MB).

MRI evaluations. Images of MRI sections of patients are shown in Fig. 3A. Total muscle area and fat did not significantly differ in the VL between patients and controls (Fig. 3B and C, respectively). Nonetheless, a significantly greater number of patients exhibited fatty infiltration in their VL than the controls (Fig. 3D). In patients with fat infiltration compared to those without it, grip strength was significantly lower, whereas disease severity scores were greater (Figs. S1A and S4).

Fig. 3.

(A) Left and middle panel: Axial plane MRIs using a selective adipose tissue saturation sequence (Axial T1 Fat Sat) in a control subject and a bronchiectasis patient. Muscle area was measured with a blue ROI. Left panel shows normal muscle volume. Middle panel shows reduced muscle volume (hypotrophy). Right panel: Axial plane MRI of the distal VL muscle using a non-contrast Axial 3D IDEAL fat fraction with IDEAL-reconstructed sequence of a bronchiectasis patient. Measurement of muscle fat fraction percentage was performed using a single ROI focused on the distal lateral vastus muscle (blue circle). Note that the data is expressed as a single average (“Avg” in the side table next to the ROI). In this case, an average of 11 represents a 11% of the adipose content confirming normal muscle trophism. (B and C) Violin plots with median (dashed line), first and third quartiles (dotted lines) and maximum and minimum values of total muscle area and thigh fat percentage of the quadriceps measured by magnetic resonance imaging (MRI) in control subjects and bronchiectasis patients. (D) Stacked bar chart showing the lack or presence of macroscopic fatty infiltration in control subjects and bronchiectasis patients measured by MRI. Definition of abbreviations: MRI, magnetic resonance imaging; ROI, region of interest; VL, vastus lateralis; N, number; ns, not significant. Statistical significance: *p<0.05.

(0.21MB).
Histological Muscle Phenotype

Morphometric analyses revealed no significant differences in the proportions of slow-twitch and fast-twitch fibers between patients and healthy controls (Table 3 and Fig. 4). However, the proportion of hybrid fibers was significantly higher in the muscles of patients than in the controls (Table 3 and Fig. 4). The cross-sectional area (CSA) of fast-twitch fibers in muscles of the patients was significantly smaller than in controls, while no differences were observed in slow-twitch or hybrid fibers (Table 3 and Fig. 4). In patients, positive correlations were observed between fast-twitch muscle fiber proportions and QMVC (r=0.625, p=0.014) and handgrip strength (r=0.551, p=0.014) (Figs. S1B and S5). Among patients, hybrid fiber proportions were inversely associated with exercise capacity (r=−0.563, p=0.012), pennation angle (r=−0.514, p=0.024) and fast-twitch fiber proportions (r=−0.443, p=0.057) (Figs. S1B and S6). Positive associations were found between fast-twitch fiber size and muscle area in bronchiectasis patients (r=0.510, p=0.036) (Figs. S1B and S7A). Patients exhibited significantly higher proportions of muscle abnormalities, particularly of internal nuclei counts, in their limb muscles than the controls (Fig. 5A and B). Among the patients, internal nuclei counts inversely correlated with elastography (r=−0.465, p=0.039) (Figs. S1B and S7B). Furthermore, lipofuscin proportions inversely correlated with QMVC (r=−0.493, p=0.027), exercise capacity (r=−0.448, p=0.048), and muscle thickness (r=−0.435, p=0.055) in patients (Figs. S1B and S8). The proportions of TUNEL-positive nuclei were significantly greater in the muscles of the patients than in the healthy controls (Fig. 5C and D).

Table 3.

Fiber Type Characteristics of the Vastus Lateralis in the Study Subjects.

  Control Subjects  Bronchiectasis Patients  p-Value 
  (N=10)  (N=20)   
Fiber types
Slow-twitch fiber proportions, %  39.32 (10.22)  41.46 (14.93)  0.689 
Fast-twitch fiber proportions, %  59.14 (10.80)  54.01 (16.43)  0.383 
Hybrid fiber proportions, %  1.68 (2.11)  2.92 (4.06)  0.045* 
Slow-twitch fibers CSA, μm2  2820.93 (800.99)  2773.40 (719.34)  0.872 
Fast-twitch fibers CSA, μm2  2488.90 (873.53)  1740.81 (366.97)  0.035* 
Hybrid fibers CSA, μm2  2101.11(420.51)  1578.41 (965.18)  0.186 

Variables are presented as mean (standard deviation), except for the hybrid fiber proportions, which are presented as median (interquartile range). Definition of abbreviations: X¯; N, number; CSA, cross-sectional area; μm, micrometers.

Statistical significance:

*

p0.05 between bronchiectasis patients and control subjects.

Fig. 4.

Representative images of VL cross-sectional histological preparations. Myofibers positively stained for slow-twitch antibody appear in brown color in upper panels. Myofibers positively stained for fast-twitch antibody appear in brown color in lower panels. Hybrid myofibers are positively stained for both slow-twitch and fast-twitch antibodies (black arrows). Scale bar=100μm. Definition of abbreviations: VL, vastus lateralis; μm, micrometer.

(0.35MB).
Fig. 5.

(A) Representative images of muscle structural abnormalities in the VL: internal nuclei (black arrow), lipofuscin (blue arrow) and inflammatory cell (red arrow). Scale bar=20μm, 40× magnification. (B) Violin plots with median (dashed line), first and third quartiles (dotted lines) and maximum and minimum values of muscle abnormalities as measured by total abnormal fraction and proportions of internal nuclei, lipofuscin and inflammatory cells identified in the VL of control subjects and bronchiectasis patients. Statistical significance: **p0.01, ***p0.001. (C) Representative images of TUNEL-positively stained nuclei (red arrows) and TUNEL-negative nuclei (black arrows) in the VL. Scale bar=20μm, 40× magnification. (D) Violin plots with median (dashed line), first and third quartile (dotted lines) and maximum and minimum values of the percentage of positively stained nuclei for the TUNEL assay in the VL of the control subjects and bronchiectasis patients. Statistical significance: *p0.05. Definition of abbreviations: VL, vastus lateralis; μm, micrometer; TUNEL, terminal deoxynucleotidyl transferase-mediated dUTP nick-end labeling; ns, not significant.

(0.34MB).
Discussion

In sedentary patients with bronchiectasis-associated sarcopenia, compared to age-and sex-matched sedentary controls, a significant decline in body composition parameters (BMI and FFMI), muscle function (upper and lower limbs), lung function, and exercise capacity was detected. Ultrasonography revealed decreased muscle thickness and area, while MRI demonstrated increased fat infiltration. Structural parameters such as the proportions of hybrid fibers, internal nuclei, abnormal fiber areas, and apoptotic nuclei were significantly greater in the VL of the bronchiectasis patients than in control subjects. Patients exhibiting fat infiltration were those with more severe indices of disease severity.

Sarcopenia, as defined by the latest criteria established by the European consensus on definition and diagnosis 2,3 was clearly demonstrated in patients with mild-to-moderate bronchiectasis according to well-known disease severity scores such as FACED, EFACED, and BSI. A significant decline in muscle mass and strength of both upper and lower limb muscles was seen in the patients compared to age-matched control subjects. These findings suggest that sarcopenia was rather associated with bronchiectasis, probably through the action of clinical determinants such as a rise in systemic inflammation.31 Indeed, levels of acute-phase reactants were significantly increased in these patients with stable mild-to-moderate bronchiectasis. In fact, high levels of systemic inflammation were also shown to be part of the pathophysiology of muscle dysfunction and mass loss in severe COPD patients.32,33 In the current study, however, patients did not have a severe disease and were relatively young as compared to other series of patients with COPD.34 These findings suggest that sarcopenia may develop at earlier stages in bronchiectasis. The proportions of female and male patients in the patients were similar to those of the healthy controls, suggesting that gender did not play a role in the reported findings. Other potential confounding factors such as metabolic disease or malnutrition did not interfere with the results as they were part of the exclusion criteria used in the study. Future investigations will aim at elucidating the differential biological mechanisms leading to sarcopenia in bronchiectasis from those already described in COPD patients.35

In the last few years, the field of sarcopenia imaging has progressed considerably from basic anatomical measurements to a highly sophisticated degree, in which the functional dissection of muscle tissue is possible. In the study, imaging studies, particularly ultrasound, revealed that the area and thickness of the vastus lateralis significantly declined in the patients compared to the healthy controls. These findings are aligned with the reduction observed in the clinical parameters BMI and FFMI and impaired muscle strength in the patients. As far as we are concerned, this is the first investigation in which a thorough evaluation of muscle architecture using ultrasound has been conducted in the quadriceps of patients with mild-to-moderate bronchiectasis. Moreover, biomechanical features such as pennation angle and fascicle length were also detected by ultrasound.23,36 In the study, measurements of these parameters did not significantly differ in the muscles of the patients compared to the healthy controls. These findings imply that muscle quality rather the biomechanical properties are more sensitive to experience early modifications in patients with bronchiectasis-associated sarcopenia. Muscle elasticity was also assessed using the novel ultrasound technique shear-wave elastography in the quadriceps of the patients in the present study.36,37 No significant differences were observed in this parameter between patients and control subjects, implying that the muscle elasticity properties of the quadriceps were preserved in this cohort of patients with mild-to-moderate bronchiectasis. Whether muscle elasticity and biomechanical properties may be impaired in patients with more severe bronchiectasis remains to be fully elucidated.

MRI is also a non-invasive and very reliable technique to explore muscle status in patients.38,39 High-contrast distinction of soft tissue components (muscle, fat infiltration, and water) is possible through MRI examination in muscles of patients. Additionally, MRI may also identify modifications in muscle architecture such as disruptions, edema, intramuscular adipose tissue, fibrosis, and other biochemical features associated with muscle quality. Fatty infiltration was present in a significantly greater number of patients than in healthy controls. Interestingly, the degree of fat infiltration as measured by functional MRI was inversely associated with the strength of the upper and lower limbs and the exercise capacity in the study patients. Severity scores were also greater in patients with fatty infiltration in their quadriceps muscle. Altogether, these findings may imply that the abnormal accumulation of fat infiltration in the VL of the patients is associated with relevant clinical outcomes in the patients.

The size of the fast twitch myofibers was significantly reduced (30%) in the VL of the patients compared to the healthy controls. Atrophy of the fast-twitch fibers has consistently been demonstrated in patients with other chronic respiratory diseases, namely COPD and lung cancer in previous investigations.40 Interestingly, in patients with mild-to-moderate bronchiectasis a significant decline in fast-twitch CSA has also been observed in their VL. Moreover, a significant rise in the proportions of hybrid fibers along with an increase in the proportions of internal nuclei and abnormal muscle (lipofuscin) were identified in the muscles of the patients compared to the controls and inversely correlated with quadriceps muscle function and thickness. The proportions of hybrid fibers were also negatively associated with exercise capacity in the patients. In addition, the number of apoptotic nuclei was also significantly greater in the vastus lateralis of the patients than in the healthy controls. Although causation cannot rely on basic correlations, these findings suggest that muscle plasticity, adaptation, and regeneration 41 may take place in the quadriceps muscle of patients with mild-to-moderate bronchiectasis. Whether the ability of muscles to adapt may prevail in patients with more advanced stages of the disease remains to be answered. These findings may have important clinical implications when designing specific pulmonary rehabilitation programs, which were shown to improve exercise capacity and lung function (meta-analysis) in patients with bronchiectasis 42

Future investigations will delve into the biological mechanisms leading to muscle atrophy and regeneration in these patients at different stages of their disease, and on the customization of the best exercise training program for the management of bronchiectasis-associated sarcopenia as current evidence is still very limited.42

Study Limitations

Despite the relatively small sample size, which was statistically corroborated, the current is an exploratory study that will serve as the basis for the design of future longitudinal investigations with larger cohorts of patients who will be followed-up for several years. This approach will allow researchers to monitor disease progression, the response to intervention, the design of evidence-based guidelines, and to identify the underlying pathobiology of bronchiectasis-associated sarcopenia. Whether other definitions of sarcopenia may have also resulted in similar findings remains to be explored. However, the latest version of the European consensus on definition and diagnosis of sarcopenia was used in the current investigation.2,3

Another limitation is related to the lack of measurements of sex hormones in the study population. However, as all the female patients and healthy controls were postmenopausal women, the potential influence of those hormones on the bronchiectasis-associated sarcopenia can be neglected.

Conclusions

In patients with stable mild-to-moderate bronchiectasis, sarcopenia was clinically evidenced through the significant reduction in muscle mass and upper and lower limb muscle function. Non-invasive ultrasound and MRI techniques showed that features of muscle quality architecture and fat infiltration are hallmarks of sarcopenia in the quadriceps muscle of patients with mild-to-moderate bronchiectasis. The phenotype of the lower limb muscle also showed signs of muscle adaptation and regeneration in these patients. These observations prompt to the need of assessing nutritional status and muscle function in patients with bronchiectasis, even at early stages of their respiratory disease. Functional radiological tools should be implemented in clinical settings to early diagnose and monitor sarcopenia in these patients.

Authors’ Contributions

Study conception and design: EB, MAM. Patient assessment and recruitment and sample collection: MAM, MCCG, MS. Radiological evaluations: AS, SM, JMM. Molecular biology analyses: ANR. Statistical analyses and data interpretation: MAM, ANR, EB. Manuscript drafting and intellectual input: EB, MAM, ANR. Manuscript writing final version: EB.

Ethical Publication Statement

We confirm that we have read the Journal's position on issues involved in ethical publication and affirm that this report is consistent with those guidelines.

Ethics Approval

The study is part of the ongoing Respiratory Sarcopenia Program in our group, which was approved by the Institutional Ethics Committee on Human Investigation (Hospital del Mar-IMIM, Barcelona, 2019/8955/I).

Editorial Support

None to declare.

Conflict of Interest

None of the authors has any conflict of interest to disclose.

Data Availability Statement

The data sets used and/or analyzed during the current study are available from the corresponding author on reasonable request.

Acknowledgements

The authors gratefully acknowledge the help provided by MSc Adrián López-Postigo with part of the physiological experiments. The current research has been supported by SEPAR-2020, Fellowship 1595 (SEPAR 2024), FIS 21/00215 PI24/00204 (Funded by ISC-III and co-funded by the European Union), BA21/00003, IntensificacionesINT19/00002 and INT22/00008, 2021-SGR-00100, CIBERES (ISC-III), Laboratorios Menarini Spain, SLT028/23/000016.

Appendix A
Supplementary Data

The followings are the supplementary data to this article:

References
[1]
S.I.J. van Bakel, H.R. Gosker, R.C. Langen, A.M.W.J. Schols.
Towards personalized management of sarcopenia in copd.
Int J COPD, 16 (2021), pp. 25-40
[2]
L. Cao, J.E. Morley.
Sarcopenia is recognized as an independent condition by an International Classification of Disease, Tenth Revision, Clinical Modification (ICD-10-CM) code.
J Am Med Dir Assoc, 17 (2016), pp. 675-677
[3]
A.J. Cruz-Jentoft, G. Bahat, J. Bauer, Y. Boirie, O. Bruyère, T. Cederholm, et al.
Sarcopenia: revised European consensus on definition and diagnosis.
Age Ageing, 48 (2019), pp. 16-31
[4]
A. Jaitovich, E. Barreiro.
Skeletal muscle dysfunction in chronic obstructive pulmonary disease what we know and can do for our patients.
Am J Respir Crit Care Med, 198 (2018), pp. 175-186
[5]
F. Maltais, M. Decramer, R. Casaburi, E. Barreiro, Y. Burelle, R. Debigaŕe, et al.
An official American thoracic society/european respiratory society statement: update on limb muscle dysfunction in chronic obstructive pulmonary disease.
Am J Respir Crit Care Med, 189 (2014), pp. 15-62
[6]
E. Barreiro, J. Gea.
Molecular and biological pathways of skeletal muscle dysfunction in chronic obstructive pulmonary disease.
Chron Respir Dis, 13 (2016), pp. 297-311
[7]
J.D. Chalmers, A.B. Chang, S.H. Chotirmall, R. Dhar, P.J. McShane.
Bronchiectasis.
Nat Rev Dis Prim, 4 (2018), pp. 1-18
[8]
P.A. Flume, J.D. Chalmers, K.N. Olivier, N. Hospital.
Advances in bronchiectasis: endotyping, genetics, microbiome and disease heterogeneity.
[9]
X. Wang, A. Balaña-Corberó, J. Martínez-Llorens, L. Qin, Y. Xia, J. Zha, et al.
Respiratory and peripheral muscle weakness and body composition abnormalities in non-cystic fibrosis bronchiectasis patients: gender differences.
Biomedicines, 10 (2022), pp. 1-22
[10]
T. Mizuno, Y. Matsui, M. Tomida, Y. Suzuki, S. Ishizuka, T. Watanabe, et al.
Relationship between quadriceps muscle computed tomography measurement and motor function, muscle mass, and sarcopenia diagnosis.
Front Endocrinol (Lausanne), 14 (2023), pp. 1-23
[11]
K. Marquis, R. Debigaré, Y. Lacasse, P. Leblanc, J. Jobin, G. Carrier, et al.
Midthigh muscle cross-sectional area is a better predictor of mortality than body mass index in patients with chronic obstructive pulmonary disease.
Am J Respir Crit Care Med, 166 (2002), pp. 809-813
[12]
S. Giovannini, F. Brau, R. Forino, A. Berti, F. D’ignazio, C. Loreti, et al.
Sarcopenia: diagnosis and management, state of the art and contribution of ultrasound.
J Clin Med, 10 (2021), pp. 1-13
[13]
M. Gupta, S. Lehl, A. Lamba.
Ultrasonography for assessment of sarcopenia: a primer.
J Midlife Health, 13 (2022), pp. 269-277
[14]
M. Farrow, J. Biglands, S.F. Tanner, A. Clegg, L. Brown, E.M.A. Hensor, et al.
The effect of ageing on skeletal muscle as assessed by quantitative MR imaging: an association with frailty and muscle strength.
Aging Clin Exp Res, 33 (2021), pp. 291-301
[15]
J.D. Chalmers, E. Polverino, M.L. Crichton, F.C. Ringshausen, A. De Soyza, M. Vendrell, et al.
Bronchiectasis in Europe: data on disease characteristics from the European Bronchiectasis registry (EMBARC).
Lancet Respir Med, 11 (2023), pp. 637-649
[16]
E. Polverino, P.C. Goeminne, M.J. McDonnell, S. Aliberti, S.E. Marshall, M.R. Loebinger, et al.
European Respiratory Society guidelines for the management of adult bronchiectasis.
Eur Respir J, 50 (2017), pp. 1-23
[17]
E. Puig-Vilanova, J. Martínez-Llorens, P. Ausin, J. Roca, J. Gea, E. Barreiro.
Quadriceps muscle weakness and atrophy are associated with a differential epigenetic profile in advanced COPD.
Clin Sci, 128 (2015), pp. 905-921
[18]
A. Sancho-Muñoz, M. Guitart, D.A. Rodríguez, J. Gea, J. Martínez-Llorens, E. Barreiro.
Deficient muscle regeneration potential in sarcopenic COPD patients: role of satellite cells.
J Cell Physiol, 236 (2021), pp. 3083-3098
[19]
J.M. Seymour, M.A. Spruit, N.S. Hopkinson, S.A. Natanek, W.D.C. Man, A. Jackson, et al.
The prevalence of quadriceps weakness in COPD and the relationship with disease severity.
Eur Respir J, 36 (2010), pp. 81-88
[20]
R. Ricciardi, Sedentarism:.
A concept analysis.
[21]
A.E. Holland, M.A. Spruit, T. Troosters, M.A. Puhan, V. Pepin, D. Saey, et al.
An official European Respiratory Society/American Thoracic Society technical standard: field walking tests in chronic respiratory disease.
Eur Respir J, 44 (2014), pp. 1428-1446
[22]
P.L. Enright.
The six-minute walk test.
Respir Care, 48 (2003), pp. 783-785
[23]
C. Monsalve-Vicente, D. Muñoz-Zamarro, N. Cuenca-Zaldívar, S. Fernández-Carnero, F. Selva-Sarzo, S. Nunez-Nagy, et al.
Architectural ultrasound pennation angle measurement of lumbar multifidus muscles: a reliability study.
J Clin Med, 11 (2022), pp. 1-12
[24]
S. Marsico, A. Solano.
Elastography of the musculoskeletal system.
1st ed., Springer, (2023),
[25]
H. Yu, C.A. McKenzie, A. Shimakawa, A.T. Vu, A.C.S. Brau, P.J. Beatty, et al.
Multiecho reconstruction for simultaneous water-fat decomposition and T2* estimation.
J Magn Reson Imaging, 26 (2007), pp. 1153-1161
[26]
S.B. Reeder, A.R. Pineda, Z. Wen, A. Shimakawa, H. Yu, J.H. Brittain, et al.
Iterative decomposition of water and fat with echo asymmetry and least-squares estimation (IDEAL): application with fast spin-echo imaging.
Magn Reson Med, 54 (2005), pp. 636-644
[27]
S.B. Reeder, C.A. McKenzie, A.R. Pineda, H. Yu, A. Shimakawa, A.C. Brau, et al.
Water-fat separation with IDEAL gradient-echo imaging.
J Magn Reson Imaging, 25 (2007), pp. 644-652
[28]
E. Barreiro, A. Salazar-Degracia, A. Sancho-Muñoz, J. Gea.
Endoplasmic reticulum stress and unfolded protein response profile in quadriceps of sarcopenic patients with respiratory diseases.
J Cell Physiol, 234 (2019), pp. 11315-11329
[29]
E. Barreiro, D. Ferrer, F. Sanchez, J. Minguella, J. Marin-Corral, J. Martinez-Llorens, et al.
Inflammatory cells and apoptosis in respiratory and limb muscles of patients with COPD.
J Appl Physiol, 111 (2011), pp. 808-817
[30]
M. Iwagami, T. Shinozaki.
Introduction to matching in case–control and cohort studies.
Ann Clin Epidemiol, 4 (2022), pp. 33-40
[31]
L. Qin, M. Guitart, M. Admetlló, S. Esteban-Cucó, J.M. Maiques, Y. Xia, et al.
Do redox balance and inflammatory events take place in mild bronchiectasis? A hint to clinical implications.
J Clin Med, 10 (2021), pp. 4534
[32]
À. Agusti, J.B. Soriano.
COPD as a systemic disease.
J Chronic Obstr Pulm Dis, 5 (2008), pp. 133-138
[33]
E. Barreiro, C. Fermoselle, M. Mateu-Jimenez, A. Sánchez-Font, L. Pijuan, J. Gea, et al.
Oxidative stress and inflammation in the normal airways and blood of patients with lung cancer and COPD.
Free Radic Biol Med, 65 (2013), pp. 859-871
[34]
C. Ye, L. Yuan, K. Wu, B. Shen, C. Zhu.
Association between systemic immune-inflammation index and chronic obstructive pulmonary disease: a population-based study.
BMC Pulm Med, 23 (2023), pp. 1-12
[35]
E. Benz, K. Trajanoska, L. Lahousse, J.D. Schoufour, N. Terzikhan, E. De Roos, et al.
Sarcopenia in COPD: a systematic review and meta-analysis.
Eur Respir Rev, 28 (2019), pp. 1-13
[36]
F. Salaffi, M. Carotti, A. Di Matteo, L. Ceccarelli, S. Farah, C. Villota-Eraso, et al.
Ultrasound and magnetic resonance imaging as diagnostic tools for sarcopenia in immune-mediated rheumatic diseases (IMRDs).
Radiol Med, 127 (2022), pp. 1277-1291
[37]
S. Bastijns, A.M. De Cock, M. Vandewoude, S. Perkisas.
Usability and pitfalls of shear-wave elastography for evaluation of muscle quality and its potential in assessing sarcopenia: a review.
Ultrasound Med Biol, 46 (2020), pp. 2891-2907
[38]
F.A. Huber, F. Del Grande, S. Rizzo, G. Guglielmi, R. Guggenberger.
MRI in the assessment of adipose tissues and muscle composition: how to use it.
Quant Imaging Med Surg, 10 (2020), pp. 1636-1649
[39]
L. Schweitzer, C. Geisler, M. Pourhassan, W. Braun, C.C. Glüer, A. Bosy-Westphal, et al.
What is the best reference site for a single MRI slice to assess whole body skeletal muscle and adipose tissue volumes in healthy adults?.
Am J Clin Nutr, 102 (2015), pp. 58-65
[40]
E. Puig-Vilanova, D.A. Rodriguez, J. Lloreta, P. Ausin, S. Pascual-Guardia, J. Broquetas, et al.
Oxidative stress, redox signaling pathways, and autophagy in cachectic muscles of male patients with advanced COPD and lung cancer.
Free Radic Biol Med, 79 (2015), pp. 91-108
[41]
M.E. Thériault, Paré MÈ, B.B. Lemire, F. Maltais, R. Debigaré.
Regenerative defect in vastus lateralis muscle of patients with chronic obstructive pulmonary disease.
Respir Res, 15 (2014), pp. 1-11
[42]
F. Yang, L. Gao, Q. Wang, W. Deng, W. Gao.
Effect of exercise-based pulmonary rehabilitation in patients with bronchiectasis: a meta-analysis.
Respir Med Res, (2022), pp. 81
Copyright © 2024. SEPAR
Archivos de Bronconeumología
Article options
Tools

Are you a health professional able to prescribe or dispense drugs?