


Chronic obstructive pulmonary disease (COPD) is characterized by high morbidity and mortality, with physical inactivity being a major contributor to poor outcomes. This study aims to identify subgroups of inactive COPD patients by analyzing reported barriers to physical activity and the perceived impact of inactivity on their disease.
MethodsIn 91 consecutive stable COPD patients, physical activity was measured using a SenseWear armband and the SAQ-COPD questionnaire, to define inactivity as a physical activity level <1.69. Clinical and functional assessment included measurement of lung volumes, diffusing capacity, muscle strength, six-minute walk test and progressive cardiorespiratory exercise test. Cluster analysis was performed based on patients’ responses to the profile and impact sections of SAQ-COPD questionnaire.
ResultsIn 70 inactive COPD patients, three distinct clusters were identified: Cluster 1 showed significant functional limitations, particularly dyspnea and leg fatigue, alongside worse exercise tolerance and dynamic hyperinflation. Cluster 2 displayed few functional limitations but reported a lack of interest in physical activity as the primary reason for inactivity, with poorer sleep quality observed. Cluster 3 exhibited a high perceived impact of inactivity despite reporting fewer physical limitations, with psychological factors such as fear and discouragement acting as primary barriers. Factor analysis revealed two principal components: perceived impact of inactivity and limiting factors for exercise.
ConclusionThese findings highlight the heterogeneity among inactive COPD patients and emphasize the need for tailored interventions targeting both physical and psychological barriers. SAQ-COPD questionnaire may be a useful instrument for this individualized assessment of inactive COPD patients.

Chronic obstructive pulmonary disease (COPD) is a leading cause of morbidity and mortality worldwide, and it poses a significant burden on healthcare systems.1,2 The disease is characterized by progressive airflow limitation and is associated with recurrent exacerbations and hospitalizations, contributing to a diminished quality of life and increased mortality rates among affected individuals.3 As a result, identifying modifiable risk factors that influence the prognosis of COPD, such as physical inactivity, has become a critical component of disease management.4
Physical activity is now recognized as one of the most important prognostic factors in COPD. In fact, sedentary lifestyles are associated with worse outcomes, such as more rapid disease progression and a higher risk of exacerbations, hospitalizations and death.4–7 This makes physical activity promotion not only a lifestyle recommendation but also a potential therapeutic target in COPD management.1,8 However, several factors contribute to the high prevalence of physical inactivity among COPD patients, including dyspnea, dynamic hyperinflation, muscle deconditioning, comorbidities, and psychological issues like anxiety and depression, which create a complex interplay of barriers to exercise.9–11
Despite the well-established benefits of physical activity, the response to interventions promoting exercise remains highly variable among COPD patients.12,13 Pulmonary rehabilitation programs, designed to improve physical capacity and encourage regular physical activity, have shown mixed results, with some patients achieving significant improvements while others struggle to engage in or sustain these activities.14,15 This variability underscores the importance of a more individualized approach when addressing physical inactivity in COPD patients.16
Understanding the specific factors that COPD patients attribute to their inactivity, as well as the perceived impact of sedentary behavior on their health, is crucial to developing personalized interventions. The Spanish Physical Activity Questionnaire in COPD (SAQ-COPD), a recently validated questionnaire for stable COPD patients, offers valuable insights into this issue.17 It not only quantifies the level of physical activity but also includes sections that assess the individual barriers to exercise and the perceived impact of inactivity on the disease and overall lifestyle.18 By using tools like the SAQ-COPD, clinicians can better understand the subjective experience of inactivity and its significance for each patient.
Therefore, the aim of this study is to characterize different subgroups of inactive COPD patients in terms of their reported barriers to physical activity and their perception of the role of inactivity in their disease. We also aim to discern what clinical, functional and exercise tolerance parameters may distinguish between these different subgroups. This approach will help to uncover distinct patterns of physical inactivity, which can ultimately guide more individualized and effective therapeutic interventions for COPD patients.
MethodsStudy SubjectsPatients were consecutively recruited between June 2023 and May 2024 from a specialized COPD clinic at a university hospital based on the following inclusion criteria: age >35 years, a clinical diagnosis of COPD with a post-bronchodilator forced expiratory volume at 1 second (FEV1)/forced vital capacity (FVC) ratio <0.7 and below the lower limit of normal, post-bronchodilator FEV1 <70% predicted, current or former smokers with >10 pack-years, and stable optimized treatment per current guidelines, with no changes in the last eight weeks. Exclusion criteria included frequent exacerbations (≥2 moderate or 1 severe in the past year), use of systemic corticosteroids in the past three months, long-term oxygen therapy, respiratory infection or exacerbation within the past two months, and diagnoses of asthma, interstitial lung disease, cystic fibrosis, thoracic/pleural disease, or malignancy. Patients with osteoarticular, neuromuscular, or cognitive impairments limiting ambulation, and those institutionalized in nursing homes or care facilities, were also excluded.
The study was approved by the local research ethics committee, and all patients provided written informed consent.
Procedures and MeasurementsAnthropometric characteristics, smoking history, comorbidities, and current treatment were collected. Dyspnea was measured using the modified Medical Research Council (mMRC) scale, and health-related quality of life with the COPD assessment test (CAT).
Physical activity was objectively measured using the SenseWear armband (Body Media Inc., Pittsburgh, PA, USA), worn day and night (excluding hygiene time) for 7 days. The device measured energy expenditure (metabolic equivalents [METs] and calories), sleep duration, time spent lying down, and various physical activity intensities. Physical activity level (PAL) was calculated by dividing total daily energy expenditure by sleep energy expenditure. A PAL <1.69 defined physical inactivity.19 Specifically, a minimum of 4 valid days of monitoring, including at least 1 weekend day, was required to consider a measurement valid. A valid day was defined as having at least 22h of wear time to ensure comprehensive data capture.
Daily activity was also assessed with the SAQ-COPD, a validated self-administered tool.17 The SAQ-COPD has two sections: (1) physical activity assessment (low, moderate, intense, inactivity) and (2) a profile (9 items on symptoms, mood, external conditions) and impact evaluation (5 items comparing the patient's activity levels to peers and perceived impact of inactivity).18
Spirometry, plethysmography, and diffusing capacity of the lung for carbon monoxide (DLCO) were performed using a MasterScreen PFT system (Viasys, CareFusion, Würzbourg, Germany), following standard guidelines.20–22 GLI equations were used as reference values. Respiratory muscle strength (maximal inspiratory pressure or PImax) was measured with the same equipment per European Respiratory Society (ERS)/American Thoracic Society (ATS) guidelines,23 using Hautmann equations. Hand-grip strength was assessed using a TKK 5001 dynamometer (Takei, Niigata, Japan).
Six-minute walk tests followed ERS/ATS guidelines.24 Two tests were completed with a 30-min rest in between to account for the learning effect.
A symptom-limited incremental cycle exercise test was conducted on an electronically braked cycle ergometer (Vintus CPX, Carefusion) following standards of the ATS/American College of Chest Physicians (ACCP) statement,25 as previously described.26,27 Changes in operational lung volumes were evaluated from duplicate measurements of inspiratory capacity (IC) at rest and every 2min during exercise.28 End-expiratory lung volume (EELV) was calculated as total lung capacity (TLC) minus IC. To minimize the variability of isolated EELV measurements, we considered that the patient had developed dynamic hyperinflation (DH) when the slope of linear regression of the EELV as a function of time was higher than zero.9 In addition, the difference between the last EELV measurement, near end-exercise, and the resting value was computed.
By pointing to the Borg scale, subjects rated dyspnea at rest, every 2min during exercise, and at peak exercise. To standardize for stimulus intensity, the Borg dyspnea scores were related to oxygen uptake. The exercise response slopes, expressed as means of slopes from linear regression analysis of individual subjects’ data, were used as indices of exertional dyspnea. Dyspnea “thresholds” were expressed as the x-intercepts of the relationships between Borg ratings and oxygen uptake (VO2).26
A more detailed description of the selection criteria and study procedures is provided in the supplementary material.
Statistical AnalysisTo ensure robust cluster analysis results with 14 variables (9 from the SAQ-COPD profile and 5 from the impact section), a minimum sample size of 70 participants was required, following the guideline of at least 5 observations per variable, commonly recommended for multivariate analyses.
Cluster analysis was performed to classify sedentary COPD patients based on their responses to the profile and impact sections of the SAQ-COPD questionnaire. The variables used to construct the clusters were the raw scores of the questionnaire items, without any standardization, imputation, or treatment for missing values. Initial clustering was performed using hierarchical clustering with Ward's method and squared Euclidean distance as the interval measure. Several cluster solutions were generated, and the distribution profiles of common variables across different analyses were compared. Agreement between individual assignments to clusters was assessed using Kappa statistics. To determine the optimal number of clusters, we examined the agglomeration schedule and identified large jumps in the agglomeration distances. As a stopping rule, the sum of squares method was employed, selecting the number of clusters that minimized the within-cluster sum of squares while maximizing the between-cluster sum of squares.
Once clusters were defined, principal component analysis (PCA) reduced data dimensionality, extracting two components: principal component 1, representing the perceived impact of sedentary behavior, and principal component 2, reflecting limiting factors for physical exercise. Subjects were classified into clusters based on PCA scores and visualized in a scatter plot of the two-dimensional PCA space.
Descriptive data are presented as number (frequency) for categorical variables and as mean±standard deviation or median (interquartile range) for continuous variables. Normality was tested using the Shapiro–Wilk test. For cluster comparisons, categorical variables were analyzed with Chi-square or Fisher's exact tests, while continuous variables were compared using the Kruskal–Wallis test with Dunn's post-hoc test for significant differences.
All analyses were conducted using SPSS (version 26.0, IBM Corp, Armonk, NY, USA), with a p-value <0.05 considered statistically significant.
ResultsOf the 91 selected patients, 70 had a physical activity level (PAL) of less than 1.69, consistent with physical inactivity. Table S1 summarizes the comparison of the main demographic, clinical, and functional characteristics between active and inactive COPD patients.
Hierarchical cluster analysis of the 70 inactive COPD patients identified three distinct clusters, as depicted in the association dendrogram (Fig. 1). This classification was generated using Ward's method with the Euclidean distance metric, applying a cutoff at a dendrogram distance of 11.

Dendrogram resulting from the cluster analysis performed on a sample of 70 COPD patients physically inactive, using Ward's method and the Euclidean distance as the clustering algorithm. The dendrogram illustrates the hierarchical grouping of patients, with the vertical line at level 11 indicating the cutoff point where the branches are intercepted, resulting in the formation of three distinct clusters. Each cluster represents a group of patients with shared characteristics based on the variables analyzed, highlighting the differentiation achieved through the clustering process.
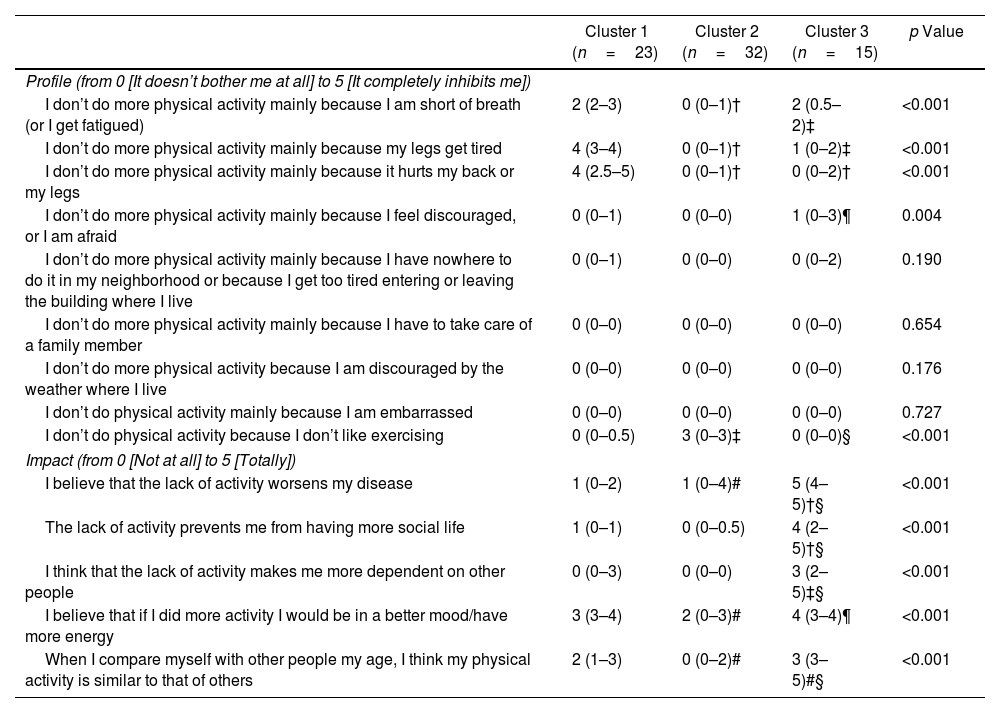
Comparison of the scores from the profile and impact sections of the SAQ-COPD questionnaire across clusters revealed significant differences (Table 1). Patients in Cluster 1 reported higher scores on the items “I don’t do more physical activity mainly because I am short of breath (or I get fatigued)”, “I don’t do more physical activity mainly because my legs get tired”, and “I don’t do more physical activity mainly because it hurts my back or my legs” compared to those in Clusters 2 and 3. Additionally, Cluster 3 showed the highest score on the item “I don’t do more physical activity mainly because I feel discouraged, or I am afraid”, compared to Cluster 2. Finally, Cluster 2 had a significantly higher score on the item “I don’t do physical activity because I don’t like exercising” than the other two clusters. No cluster exhibited limitation profiles related to external factors such as neighborhood characteristics, caregiving duties, weather conditions, or feelings of embarrassment.
Comparison of Profile Expectations/Impact of Physical Inactivity Between the COPD Patients Allocated to the Three Clustersa.
| Cluster 1 (n=23) | Cluster 2 (n=32) | Cluster 3 (n=15) | p Value | |
|---|---|---|---|---|
| Profile (from 0 [It doesn’t bother me at all] to 5 [It completely inhibits me]) | ||||
| I don’t do more physical activity mainly because I am short of breath (or I get fatigued) | 2 (2–3) | 0 (0–1)† | 2 (0.5–2)‡ | <0.001 |
| I don’t do more physical activity mainly because my legs get tired | 4 (3–4) | 0 (0–1)† | 1 (0–2)‡ | <0.001 |
| I don’t do more physical activity mainly because it hurts my back or my legs | 4 (2.5–5) | 0 (0–1)† | 0 (0–2)† | <0.001 |
| I don’t do more physical activity mainly because I feel discouraged, or I am afraid | 0 (0–1) | 0 (0–0) | 1 (0–3)¶ | 0.004 |
| I don’t do more physical activity mainly because I have nowhere to do it in my neighborhood or because I get too tired entering or leaving the building where I live | 0 (0–1) | 0 (0–0) | 0 (0–2) | 0.190 |
| I don’t do more physical activity mainly because I have to take care of a family member | 0 (0–0) | 0 (0–0) | 0 (0–0) | 0.654 |
| I don’t do more physical activity because I am discouraged by the weather where I live | 0 (0–0) | 0 (0–0) | 0 (0–0) | 0.176 |
| I don’t do physical activity mainly because I am embarrassed | 0 (0–0) | 0 (0–0) | 0 (0–0) | 0.727 |
| I don’t do physical activity because I don’t like exercising | 0 (0–0.5) | 3 (0–3)‡ | 0 (0–0)§ | <0.001 |
| Impact (from 0 [Not at all] to 5 [Totally]) | ||||
| I believe that the lack of activity worsens my disease | 1 (0–2) | 1 (0–4)# | 5 (4–5)†§ | <0.001 |
| The lack of activity prevents me from having more social life | 1 (0–1) | 0 (0–0.5) | 4 (2–5)†§ | <0.001 |
| I think that the lack of activity makes me more dependent on other people | 0 (0–3) | 0 (0–0) | 3 (2–5)‡§ | <0.001 |
| I believe that if I did more activity I would be in a better mood/have more energy | 3 (3–4) | 2 (0–3)# | 4 (3–4)¶ | <0.001 |
| When I compare myself with other people my age, I think my physical activity is similar to that of others | 2 (1–3) | 0 (0–2)# | 3 (3–5)#§ | <0.001 |
Regarding the impact of physical inactivity, Cluster 3 consistently exhibited higher scores across all items compared to Clusters 1 and 2. Additionally, Cluster 1 demonstrated higher scores than Cluster 2 on the items “I believe that if I did more activity I would be in a better mood/have more energy” and “When I compare myself with other people my age, I think my physical activity is similar to that of others”.
A factor analysis was also performed on the patient data, identifying two principal components. The model showed good sampling adequacy, with a Kaiser–Meyer–Olkin (KMO) value of 0.647, and Bartlett's test of sphericity was significant (p<0.001), indicating that the data were suitable for factor analysis. These two components accounted for 47% of the total variance and were related to the impact and profile of physical inactivity. The scatter plot (Fig. 2) illustrates the distribution of the three clusters across the two principal components. Patients in Cluster 2 reported no perceived impact of physical inactivity on their health, nor any limiting factors for exercise, indicating that their primary reason for not engaging in physical activity was simply a dislike for exercise. In contrast, Cluster 3 showed a high impact of a sedentary lifestyle on both disease perception and daily life, despite recognizing only slight limitations to physical activity. Finally, Cluster 1 patients reported significant limiting factors, primarily related to functional aspects, alongside a moderate perception of the impact of inactivity on their health.

Scatter plot of inactive COPD patients classified into three clusters. The data were reduced to two dimensions using principal component analysis. Principal component 1 represents the perceived impact of sedentary behavior on the patient's condition. Principal component 2 reflects the profile of limiting factors affecting physical exercise. Values in parentheses indicate the percentage of explained variance for each principal component.
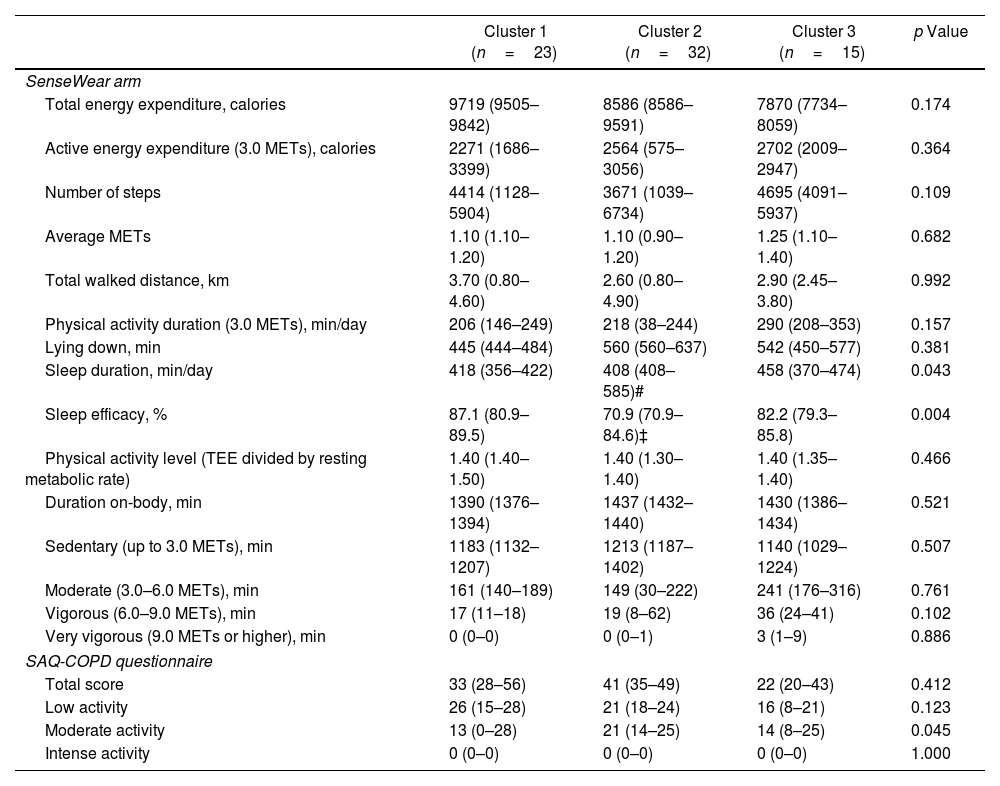
Table 2 shows that the overall level of physical inactivity was comparable among the three clusters, both in terms of the SAQ-COPD scores and objective measurements using the SenseWear arm. However, Cluster 2 patients exhibited shorter sleep duration and lower sleep efficiency, particularly in comparison to Cluster 1.
Daily Physical Activity of the Three Study Groupsa.
| Cluster 1 (n=23) | Cluster 2 (n=32) | Cluster 3 (n=15) | p Value | |
|---|---|---|---|---|
| SenseWear arm | ||||
| Total energy expenditure, calories | 9719 (9505–9842) | 8586 (8586–9591) | 7870 (7734–8059) | 0.174 |
| Active energy expenditure (3.0 METs), calories | 2271 (1686–3399) | 2564 (575–3056) | 2702 (2009–2947) | 0.364 |
| Number of steps | 4414 (1128–5904) | 3671 (1039–6734) | 4695 (4091–5937) | 0.109 |
| Average METs | 1.10 (1.10–1.20) | 1.10 (0.90–1.20) | 1.25 (1.10–1.40) | 0.682 |
| Total walked distance, km | 3.70 (0.80–4.60) | 2.60 (0.80–4.90) | 2.90 (2.45–3.80) | 0.992 |
| Physical activity duration (3.0 METs), min/day | 206 (146–249) | 218 (38–244) | 290 (208–353) | 0.157 |
| Lying down, min | 445 (444–484) | 560 (560–637) | 542 (450–577) | 0.381 |
| Sleep duration, min/day | 418 (356–422) | 408 (408–585)# | 458 (370–474) | 0.043 |
| Sleep efficacy, % | 87.1 (80.9–89.5) | 70.9 (70.9–84.6)‡ | 82.2 (79.3–85.8) | 0.004 |
| Physical activity level (TEE divided by resting metabolic rate) | 1.40 (1.40–1.50) | 1.40 (1.30–1.40) | 1.40 (1.35–1.40) | 0.466 |
| Duration on-body, min | 1390 (1376–1394) | 1437 (1432–1440) | 1430 (1386–1434) | 0.521 |
| Sedentary (up to 3.0 METs), min | 1183 (1132–1207) | 1213 (1187–1402) | 1140 (1029–1224) | 0.507 |
| Moderate (3.0–6.0 METs), min | 161 (140–189) | 149 (30–222) | 241 (176–316) | 0.761 |
| Vigorous (6.0–9.0 METs), min | 17 (11–18) | 19 (8–62) | 36 (24–41) | 0.102 |
| Very vigorous (9.0 METs or higher), min | 0 (0–0) | 0 (0–1) | 3 (1–9) | 0.886 |
| SAQ-COPD questionnaire | ||||
| Total score | 33 (28–56) | 41 (35–49) | 22 (20–43) | 0.412 |
| Low activity | 26 (15–28) | 21 (18–24) | 16 (8–21) | 0.123 |
| Moderate activity | 13 (0–28) | 21 (14–25) | 14 (8–25) | 0.045 |
| Intense activity | 0 (0–0) | 0 (0–0) | 0 (0–0) | 1.000 |
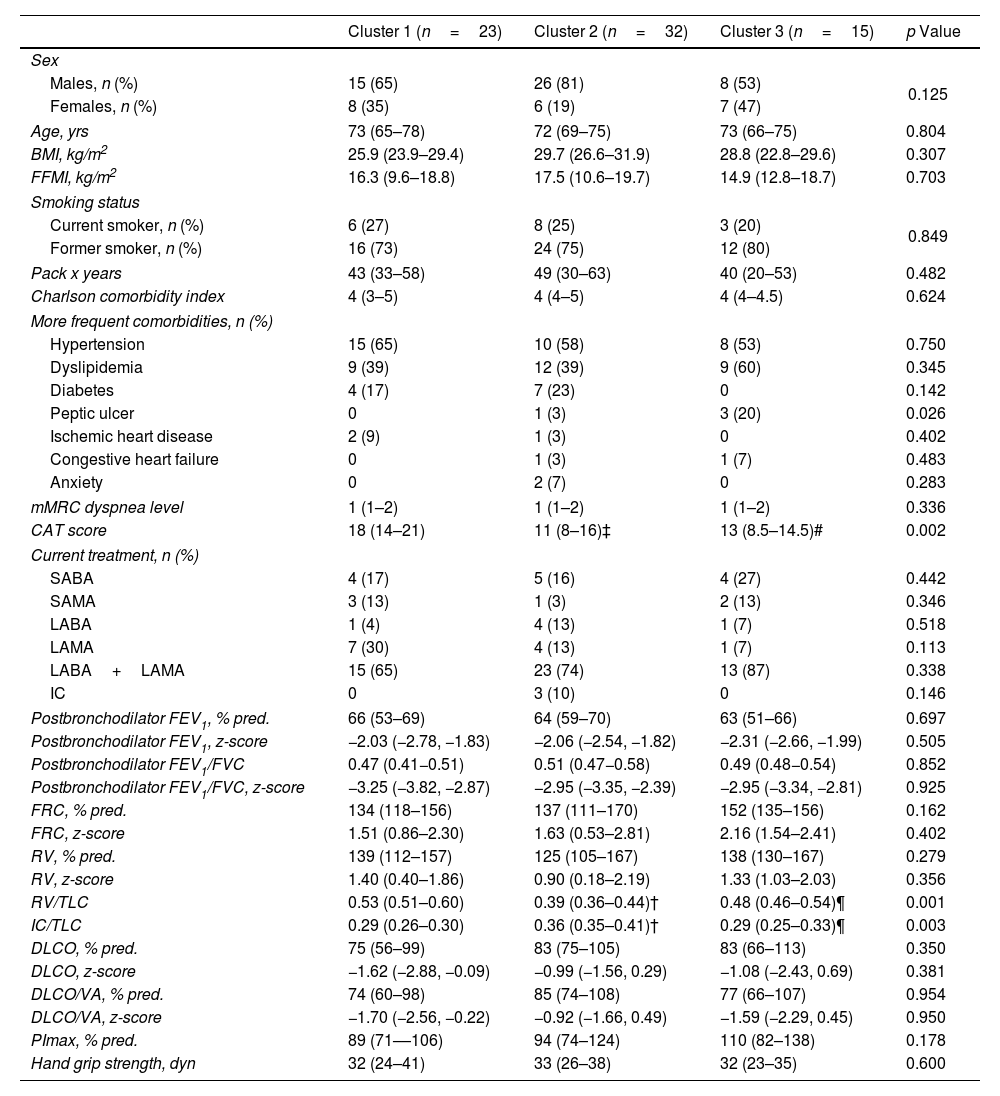
The clinical and functional characteristics of the clusters are summarized in Table 3. Patients in Cluster 1 reported worse health-related quality of life compared to the other two clusters. They also demonstrated signs of air trapping, reflected by an increased residual volume (RV)/total lung capacity (TLC) ratio, and static hyperinflation, indicated by a reduced IC/TLC ratio.
Comparison of Anthropometric, Clinical and Functional Characteristics Among Patients in the Three Identified Clustersa.
| Cluster 1 (n=23) | Cluster 2 (n=32) | Cluster 3 (n=15) | p Value | |
|---|---|---|---|---|
| Sex | ||||
| Males, n (%) | 15 (65) | 26 (81) | 8 (53) | 0.125 |
| Females, n (%) | 8 (35) | 6 (19) | 7 (47) | |
| Age, yrs | 73 (65–78) | 72 (69–75) | 73 (66–75) | 0.804 |
| BMI, kg/m2 | 25.9 (23.9–29.4) | 29.7 (26.6–31.9) | 28.8 (22.8–29.6) | 0.307 |
| FFMI, kg/m2 | 16.3 (9.6–18.8) | 17.5 (10.6–19.7) | 14.9 (12.8–18.7) | 0.703 |
| Smoking status | ||||
| Current smoker, n (%) | 6 (27) | 8 (25) | 3 (20) | 0.849 |
| Former smoker, n (%) | 16 (73) | 24 (75) | 12 (80) | |
| Pack x years | 43 (33–58) | 49 (30–63) | 40 (20–53) | 0.482 |
| Charlson comorbidity index | 4 (3–5) | 4 (4–5) | 4 (4–4.5) | 0.624 |
| More frequent comorbidities, n (%) | ||||
| Hypertension | 15 (65) | 10 (58) | 8 (53) | 0.750 |
| Dyslipidemia | 9 (39) | 12 (39) | 9 (60) | 0.345 |
| Diabetes | 4 (17) | 7 (23) | 0 | 0.142 |
| Peptic ulcer | 0 | 1 (3) | 3 (20) | 0.026 |
| Ischemic heart disease | 2 (9) | 1 (3) | 0 | 0.402 |
| Congestive heart failure | 0 | 1 (3) | 1 (7) | 0.483 |
| Anxiety | 0 | 2 (7) | 0 | 0.283 |
| mMRC dyspnea level | 1 (1–2) | 1 (1–2) | 1 (1–2) | 0.336 |
| CAT score | 18 (14–21) | 11 (8–16)‡ | 13 (8.5–14.5)# | 0.002 |
| Current treatment, n (%) | ||||
| SABA | 4 (17) | 5 (16) | 4 (27) | 0.442 |
| SAMA | 3 (13) | 1 (3) | 2 (13) | 0.346 |
| LABA | 1 (4) | 4 (13) | 1 (7) | 0.518 |
| LAMA | 7 (30) | 4 (13) | 1 (7) | 0.113 |
| LABA+LAMA | 15 (65) | 23 (74) | 13 (87) | 0.338 |
| IC | 0 | 3 (10) | 0 | 0.146 |
| Postbronchodilator FEV1, % pred. | 66 (53–69) | 64 (59–70) | 63 (51–66) | 0.697 |
| Postbronchodilator FEV1, z-score | −2.03 (−2.78, −1.83) | −2.06 (−2.54, −1.82) | −2.31 (−2.66, −1.99) | 0.505 |
| Postbronchodilator FEV1/FVC | 0.47 (0.41−0.51) | 0.51 (0.47−0.58) | 0.49 (0.48−0.54) | 0.852 |
| Postbronchodilator FEV1/FVC, z-score | −3.25 (−3.82, −2.87) | −2.95 (−3.35, −2.39) | −2.95 (−3.34, −2.81) | 0.925 |
| FRC, % pred. | 134 (118–156) | 137 (111–170) | 152 (135–156) | 0.162 |
| FRC, z-score | 1.51 (0.86–2.30) | 1.63 (0.53–2.81) | 2.16 (1.54–2.41) | 0.402 |
| RV, % pred. | 139 (112–157) | 125 (105–167) | 138 (130–167) | 0.279 |
| RV, z-score | 1.40 (0.40–1.86) | 0.90 (0.18–2.19) | 1.33 (1.03–2.03) | 0.356 |
| RV/TLC | 0.53 (0.51–0.60) | 0.39 (0.36–0.44)† | 0.48 (0.46–0.54)¶ | 0.001 |
| IC/TLC | 0.29 (0.26–0.30) | 0.36 (0.35–0.41)† | 0.29 (0.25–0.33)¶ | 0.003 |
| DLCO, % pred. | 75 (56–99) | 83 (75–105) | 83 (66–113) | 0.350 |
| DLCO, z-score | −1.62 (−2.88, −0.09) | −0.99 (−1.56, 0.29) | −1.08 (−2.43, 0.69) | 0.381 |
| DLCO/VA, % pred. | 74 (60–98) | 85 (74–108) | 77 (66–107) | 0.954 |
| DLCO/VA, z-score | −1.70 (−2.56, −0.22) | −0.92 (−1.66, 0.49) | −1.59 (−2.29, 0.45) | 0.950 |
| PImax, % pred. | 89 (71––106) | 94 (74–124) | 110 (82–138) | 0.178 |
| Hand grip strength, dyn | 32 (24–41) | 33 (26–38) | 32 (23–35) | 0.600 |
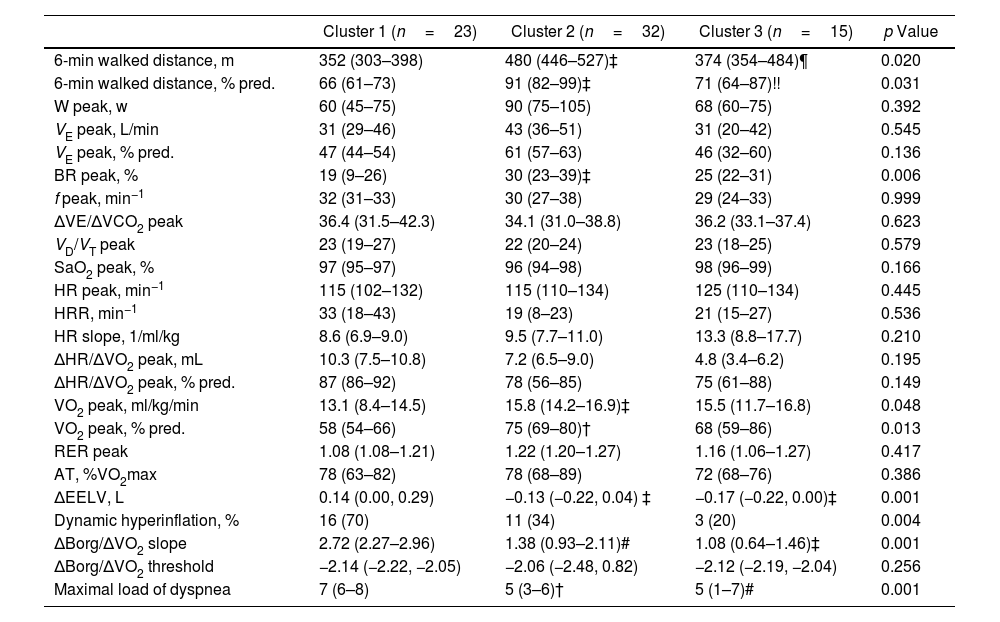
Regarding exercise tolerance (Table 4), patients in Cluster 1 covered a shorter distance in the six-minute walk test and achieved a lower peak oxygen consumption, indicating reduced exercise capacity compared to those in the other two clusters. Additionally, Cluster 1 patients exhibited a reduced ventilatory reserve, suggesting some degree of ventilatory mechanical limitation. These alterations were more pronounced during exercise, as evidenced by a greater increase in EELV, leading to a higher percentage of patients with dynamic hyperinflation in Cluster 1 compared to the other clusters. Finally, patients in Cluster 1 also reported greater dyspnea during exercise compared to the other two clusters, as evidenced by a steeper dyspnea slope and higher maximal dyspnea score.
Comparison of Exercise Response Characteristics Among Patients in the Three Identified Clustersa.
| Cluster 1 (n=23) | Cluster 2 (n=32) | Cluster 3 (n=15) | p Value | |
|---|---|---|---|---|
| 6-min walked distance, m | 352 (303–398) | 480 (446–527)‡ | 374 (354–484)¶ | 0.020 |
| 6-min walked distance, % pred. | 66 (61–73) | 91 (82–99)‡ | 71 (64–87)!! | 0.031 |
| W peak, w | 60 (45–75) | 90 (75–105) | 68 (60–75) | 0.392 |
| VE peak, L/min | 31 (29–46) | 43 (36–51) | 31 (20–42) | 0.545 |
| VE peak, % pred. | 47 (44–54) | 61 (57–63) | 46 (32–60) | 0.136 |
| BR peak, % | 19 (9–26) | 30 (23–39)‡ | 25 (22–31) | 0.006 |
| f peak, min−1 | 32 (31–33) | 30 (27–38) | 29 (24–33) | 0.999 |
| ΔVE/ΔVCO2 peak | 36.4 (31.5–42.3) | 34.1 (31.0–38.8) | 36.2 (33.1–37.4) | 0.623 |
| VD/VT peak | 23 (19–27) | 22 (20–24) | 23 (18–25) | 0.579 |
| SaO2 peak, % | 97 (95–97) | 96 (94–98) | 98 (96–99) | 0.166 |
| HR peak, min−1 | 115 (102–132) | 115 (110–134) | 125 (110–134) | 0.445 |
| HRR, min−1 | 33 (18–43) | 19 (8–23) | 21 (15–27) | 0.536 |
| HR slope, 1/ml/kg | 8.6 (6.9–9.0) | 9.5 (7.7–11.0) | 13.3 (8.8–17.7) | 0.210 |
| ΔHR/ΔVO2 peak, mL | 10.3 (7.5–10.8) | 7.2 (6.5–9.0) | 4.8 (3.4–6.2) | 0.195 |
| ΔHR/ΔVO2 peak, % pred. | 87 (86–92) | 78 (56–85) | 75 (61–88) | 0.149 |
| VO2 peak, ml/kg/min | 13.1 (8.4–14.5) | 15.8 (14.2–16.9)‡ | 15.5 (11.7–16.8) | 0.048 |
| VO2 peak, % pred. | 58 (54–66) | 75 (69–80)† | 68 (59–86) | 0.013 |
| RER peak | 1.08 (1.08–1.21) | 1.22 (1.20–1.27) | 1.16 (1.06–1.27) | 0.417 |
| AT, %VO2max | 78 (63–82) | 78 (68–89) | 72 (68–76) | 0.386 |
| ΔEELV, L | 0.14 (0.00, 0.29) | −0.13 (−0.22, 0.04) ‡ | −0.17 (−0.22, 0.00)‡ | 0.001 |
| Dynamic hyperinflation, % | 16 (70) | 11 (34) | 3 (20) | 0.004 |
| ΔBorg/ΔVO2 slope | 2.72 (2.27–2.96) | 1.38 (0.93–2.11)# | 1.08 (0.64–1.46)‡ | 0.001 |
| ΔBorg/ΔVO2 threshold | −2.14 (−2.22, −2.05) | −2.06 (−2.48, 0.82) | −2.12 (−2.19, −2.04) | 0.256 |
| Maximal load of dyspnea | 7 (6–8) | 5 (3–6)† | 5 (1–7)# | 0.001 |
This study aimed to identify distinct subgroups of physically inactive COPD patients through hierarchical cluster analysis and assess their differences in perceived limitations to physical activity and its impact on health outcomes. The analysis revealed three distinct clusters with unique characteristics, underscoring the heterogeneity among inactive COPD patients regarding their exercise capacity, perception of physical activity, and its impact on their quality of life.
The identification of Cluster 1, characterized by higher scores in items related to physical limitations (such as shortness of breath, leg fatigue, and back or leg pain), suggests that functional and symptom-driven barriers to physical activity are predominant in this group. These findings are consistent with the well-documented role of dyspnea and muscle fatigue as primary symptoms limiting exercise in COPD patients.11 The reduced six-minute walk distance and lower peak oxygen consumption observed in this cluster further highlight the severity of their functional impairment, which likely contributes to a diminished exercise tolerance.29 Moreover, the increased dynamic hyperinflation and greater ventilatory limitations observed during exercise indicate that mechanical factors, such as reduced ventilatory reserve, are exacerbating their symptoms.9,30 This cluster also reported greater dyspnea during exercise, further supporting the notion that symptomatic burdens in this group create substantial barriers to physical activity.
In contrast, Cluster 2 represents a group of patients with no perceived health impact from inactivity and fewer functional limitations. These patients primarily cited a lack of interest in exercising (“I don’t like exercising”) as their main reason for inactivity, which aligns with psychological or behavioral factors, rather than physiological limitations, as the primary contributors to their sedentary lifestyle.31,32 Interestingly, patients in this cluster exhibited shorter sleep duration and lower sleep efficiency, raising the possibility that sleep disturbances may indirectly influence their inactivity. The association between poor sleep and reduced physical activity has been noted in previous studies,33–35 potentially contributing to fatigue, mood disturbances, and decreased motivation to engage in regular exercise. Addressing sleep quality and psychological factors may be crucial in motivating these patients to adopt more active lifestyles.
Cluster 3 was characterized by a high perceived impact of inactivity on both disease progression and quality of life, alongside a moderate recognition of exercise-limiting factors. This group's profile suggests that while they recognize the negative consequences of a sedentary lifestyle, their ability to engage in physical activity is hindered by psychological factors such as fear or discouragement. These findings echo prior research showing that anxiety, depression, and fear of exacerbations can be significant barriers to exercise in COPD patients.36,37 They suggest a complex interplay between perception, motivation, and physiological limitations, which should be considered when designing individualized interventions.
The results from the factor analysis further underscore the multidimensional nature of physical inactivity in COPD patients. The identification of two principal components, related to both the profile and the impact of inactivity, highlights the importance of addressing not only the physical limitations to exercise but also the cognitive and emotional factors that contribute to a sedentary lifestyle. Previous studies have suggested that addressing both physiological and psychological barriers to exercise is crucial for improving physical activity levels in COPD patients.10,38 For instance, the combination of pulmonary rehabilitation and psychological counseling has been shown to enhance exercise capacity and adherence to physical activity programs in COPD.39
From a clinical perspective, these findings have several important implications. First, the identification of subgroups of COPD patients with distinct physical and psychological barriers to physical activity suggests that a one-size-fits-all approach to rehabilitation may be ineffective. Instead, personalized interventions that address the specific barriers identified in each cluster may be more successful in promoting physical activity. For example, patients in Cluster 1, who face significant physical limitations, may benefit from interventions focused on improving ventilatory mechanics and dynamic hyperinflation through pulmonary rehabilitation and bronchodilator therapy.40,41 Conversely, patients in Cluster 2 may require educational and motivational strategies aimed at addressing behavioral resistance to exercise, such as motivational interviewing or tailored behavioral change interventions. For patients in Cluster 3, the most effective approach is likely to involve strategies specifically designed to promote physical activity, with an emphasis on implementing a structured multicomponent physical training program.42.
Second, the association between physical inactivity and poor sleep quality in Cluster 2 highlights the need for a more holistic approach to managing physical inactivity, considering factors such as sleep hygiene and mental health. Integrating sleep quality assessment into routine COPD management could help identify patients at risk of sleep disturbances, which may be contributing to their inactivity and overall health decline.
Finally, our findings highlight the importance of psychological support in pulmonary rehabilitation programs, particularly for patients in Cluster 3 who recognize the negative impact of inactivity but are hindered by psychological barriers such as fear and discouragement. Incorporating psychological interventions into rehabilitation programs could help alleviate these barriers and promote more active lifestyles.
Several limitations must be acknowledged. The sample size of 70 sedentary patients, while sufficient for the cluster and factor analyses, limits the generalizability of the findings to broader COPD populations. Additionally, the reliance on self-reported data from the SAQ-COPD questionnaire introduces the possibility of reporting bias, particularly in the assessment of psychological and motivational factors. On the other hand, there are currently no validated versions of the SAQ-COPD questionnaire in languages other than Spanish. Future studies should aim to replicate these findings in larger, more diverse populations and explore the potential for longitudinal interventions tailored to each cluster's specific needs.
In conclusion, this study demonstrates the heterogeneity among inactive COPD patients, with distinct physical, psychological, and motivational barriers to physical activity. Personalized interventions targeting the unique needs of each subgroup may be more effective in promoting physical activity and improving health outcomes in this population. Addressing both physiological and psychological factors, including ventilatory limitations, motivation, and sleep disturbances, is crucial for the successful management of physical inactivity in COPD.
CRediT Authorship Contribution StatementFG-R had full access to all of the data in the study and takes responsibility for the integrity of the data and the accuracy of the data analysis. JMP, CC-Z and FG-R conceived the study idea. RC, RG, EM-C, EA, CC-Z and FG-R contributed to the study conception and design. RC was the project manager. JMP, RC, RG, EM-C, EA, ED-G, MVT, CL-F, PP-M, JJS-C, CC-Z, and FG-R handled recruitment, data collection, deliverance of intervention, and assessment of all participants. JMP, RC, RG, and FGR managed the data and statistical analysis. FG-R, EA and JMP were responsible for the study management and coordination. JMP and FG-R drafted the first version of the manuscript. All authors contributed to interpretation of the data, revision of the manuscript, and approved the final manuscript and submission of the article.
Consent for PublicationNot applicable.
Ethics Approval and Consent to ParticipateParticipants provided their written consent, and the study was approved by the institutional Ethics Committee (PI-2816).
Declaration of Generative AI and AI-assisted Technologies in the Writing ProcessNone of the material has been partially or totally produced with the help of any artificial intelligence software or tool.
FundingThis study was supported by grants from Instituto de Salud Carlos III-Fondos FEDER, PI19-01612 to F García-Río.
Declaration of Competing InterestWe declare no competing interests.
Data AvailabilityAll of the individual patient data collected during the study will be shared. The data will be made available within 12 months of publication. All available data can be obtained by contacting the corresponding author (fgr01m@gmail.com). It will be necessary to provide a detailed protocol for the proposed study, to provide the approval of an ethics committee, to supply information about the funding and resources one has to carry out the study, and to consider inviting the original authors to participate in the re-analysis.
The following are the supplementary data to this article:


