


There is controversy regarding the role of blood eosinophil levels as a biomarker of exacerbation risk in chronic obstructive pulmonary disease (COPD). Our aim was to quantify blood eosinophil levels and determine the risk of exacerbations associated with these levels and their variability.
MethodsObservational, retrospective, population-based study with longitudinal follow-up in patients with COPD identified in a primary care electronic medical record database in Catalonia, Spain, covering 80% of the general population. Patients were classified into 4 groups using the following cut-offs: (a) <150cells/μl; (b) ≥150 and <300cells/μl; (c) ≥300 and <500cells/μl; (d) ≥500cells/μl.
ResultsA total of 57,209 patients were identified with a mean age of 70.2 years, a mean FEV1(% predicted) of 64.1% and 51.6% had at least one exacerbation the previous year. The number of exacerbations in the previous year was higher in patients with the lowest and the highest eosinophil levels compared with the intermediate groups. During follow-up the number of exacerbations was slightly higher in the group with the lowest blood eosinophil levels and in those with higher variability in eosinophil counts, but ROC curves did not identify a reliable threshold of blood eosinophilia to discriminate an increased risk of exacerbations.
ConclusionsOur results do not support the use of blood eosinophil count as a reliable biomarker of the risk of exacerbation in COPD in a predominantly non-exacerbating population. Of note was that the small group of patients with the highest variability in blood eosinophils more frequently presented exacerbations.
Existe cierta controversia con respecto al papel de los niveles de eosinófilos en sangre como biomarcador del riesgo de exacerbación en la enfermedad pulmonar obstructiva crónica (EPOC). Nuestro objetivo fue cuantificar los niveles de eosinófilos en sangre y determinar el riesgo de exacerbaciones asociadas con estos niveles y su variabilidad.
MétodosEstudio observacional, retrospectivo y poblacional con seguimiento longitudinal en pacientes con EPOC identificados en una base de datos electrónica de historiales médicos de atención primaria en Cataluña, España, que abarca el 80% de la población general. Los pacientes se clasificaron en 4 grupos utilizando los siguientes puntos de corte: a) <150 células/μl; b) ≥150 y <300 células/μl; c) ≥300 y <500 células/μl, y d) ≥500 células/μl.
ResultadosSe identificaron un total de 57.209 pacientes con una edad media de 70,2 años, un FEV1 medio (% del predicho) el 64,1 y el 51,6% habían sufrido al menos una exacerbación el año anterior. El número de exacerbaciones en el año previo fue mayor en aquellos pacientes con los niveles más bajos y los más altos de eosinófilos en comparación con los grupos intermedios. Durante el seguimiento, el número de exacerbaciones fue ligeramente mayor en el grupo con los niveles más bajos de eosinófilos en sangre y en aquellos con mayor variabilidad en el recuento, pero las curvas ROC no identificaron un umbral fiable de eosinofilia en sangre para discriminar un mayor riesgo de exacerbaciones.
ConclusionesNuestros resultados no apoyan el uso del recuento de eosinófilos en sangre como un biomarcador fiable del riesgo de exacerbación de la EPOC en una población predominantemente no exacerbada. Cabe destacar que el pequeño grupo de pacientes con mayor variabilidad en los niveles de eosinófilos en sangre presentaba exacerbaciones con mayor frecuencia.
Several studies have demonstrated that treatment with inhaled corticosteroids (ICS) in COPD patients with higher blood eosinophil counts results in a greater decrease in the exacerbation rate and greater improvement in lung function and quality of life compared with patients with low blood eosinophil concentrations.1–5 However, the association of high blood eosinophil levels and increased risk of exacerbations is less clear. Some studies have reported a significant risk of exacerbations in patients with high eosinophil counts,6–8 while others have not.9–12 Larger epidemiological studies are required to investigate the relationship between eosinophil levels and the risk of exacerbation in COPD. The use of population-based databases can help to increase the knowledge on real-life patterns of blood eosinophilia and their relationship with exacerbations.
The aims of the study were to quantify blood eosinophil levels, describe the characteristics of patients with different blood eosinophil levels and determine the risk of exacerbations associated with eosinophil blood levels and their variability in patients with COPD.
MethodThis was an observational, retrospective, population-based study with longitudinal follow-up. The data used in this study was obtained from the SIDIAP (System for the Development of Research in Primary Care) database, a computerised database containing the anonymized patient records of 5.8 million people registered in one of the 279 primary care centres of the Catalan Health Service (approximately 80% of the population of Catalonia, Spain).13 All the general practitioners in the Catalan Health Service use the same specific software called ECAP to record the clinical information of their patients. Health professionals gather this information using ICD-10 codes and structured forms designed for the collection of variables, such as smoking history and body mass index (BMI), as well as test results such as blood tests and spirometries.
The index date for each patient was defined as the date of the last blood eosinophil measurement in stable state within the baseline period from January 1st, 2014 to December 31st, 2014. Baseline information was collected from the clinical visit closest to the index date and data on health resource use (HRU) was collected from the 12-month period prior to the index date. In order to analyse the risk associated with blood eosinophil levels, information on HRU was collected from the 12 months after the index date
The study was approved by the Research and Ethics Committee of the Jordi Gol Institute of Research In Primary Care (Barcelona, Spain). Since the analysis was performed using anonymised clinical records, informed consent was not necessary.
Study populationPatients with a COPD diagnostic code (ICD-10, codes J42, J43 and J44) and at least one recorded blood eosinophil count during the baseline period were selected for the study. In order to avoid misdiagnosis of COPD, a previously validated algorithm, which combined smoking history, spirometry with forced expiratory volume in 1 second/forced vital capacity (FEV1/FVC)<0.7 and respiratory medication, as defined in previous studies was used to confirm the diagnosis of COPD.14–16 Patients with other known causes of altered blood eosinophil counts, such as aspergillosis, Churg-Strauss disease, or hypereosinophilic syndrome were excluded.
Exacerbations were identified by diagnostic codes and by treatment in patients receiving antibiotics and/or oral corticosteroids in the absence of another codified infectious event such as tonsillitis or urine infection. Patients with a previous history of asthma were classified as asthma-COPD overlap (ACO); the remaining patients were divided into frequent exacerbators if they experienced two or more exacerbations the previous year and infrequent exacerbators those with 0 or 1 exacerbation.
The measurement of blood eosinophils was considered to be in a stable state if no recording of exacerbation in the clinical record was found, and there was no prescription of oral corticosteroids within 21 days prior to the eosinophil measurements. Patients were classified into 4 groups according to blood eosinophil levels using the following arbitrary cut-offs: (a) <150cells/μl; (b) ≥150 and <300cells/μl; (c) ≥300 and <500cells/μl; (d) ≥500cells/μl [8].
Analysis of blood eosinophil stabilitySubjects with more than one blood eosinophil count in stable state during the year previous to the index date were included in the analysis of stability (see online supplement). The analysis included the baseline eosinophil count and a previous eosinophil measurement separated by at least one month. No variability was considered when both measurements were within the same level category, while little variability was considered when each measurement pertained to consecutive categories and large variability when there was a change of at least 2 categories.
Statistical analysisThe distribution of peripheral blood eosinophils was expressed as cells/μl using mean and standard deviation. A descriptive analysis of all the variables collected was performed by groups of blood eosinophilia defined with the established cut-offs. Continuous variables were described using means and standard deviations (SD). Categorical variables were described using absolute and relative frequencies. The characteristics of the different sub-groups were compared using the t-test and Wilcoxon-signed ranked test for continuous variables and chi-square test for categorical variables. The Bonferroni adjustment was used to correct for multiple comparisons.
Receiver operating characteristic (ROC) curves were used to estimate a cut point of blood eosinophil level that best identifies exacerbator patients (exacerbator/non-exacerbator/≥2 moderate–severe exacerbations and those with exacerbations/no exacerbations during the 12-month observational period after the index date).
Since the use of ICS could potentially influence outcomes differently according to blood eosinophil levels, a sensitivity analysis was performed in patients who did not receive any ICS in the year prior to and after the index date. All statistical analyses were performed using the statistical software package (SPSS version 20.0, IBM, Chicago, IL, USA).
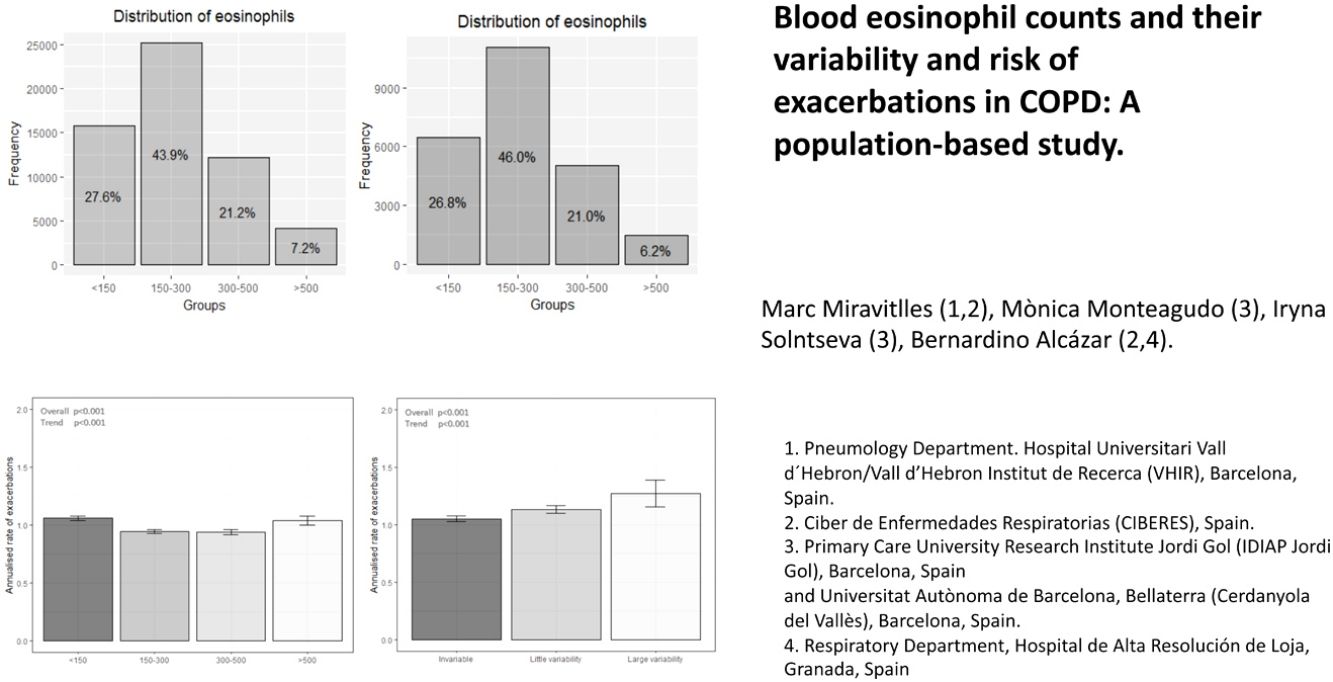
ResultsThe prevalence of COPD in the SIDIAP database is 2.70% (confidence interval [CI]95%: 2.68–2.72) in individuals of all ages and 10.5% (CI95%: 10.4–10.6) in individuals>65 years old.13 In 2014, 57,209 COPD patients fulfilling the inclusion and exclusion criteria were identified (Fig. 1), with a mean eosinophil count of 253.9cell/μl (SD=190). The mean age was 70.2 years (SD=10.4), and 74% were men. Only 44.5% had a spirometry with a mean FEV1 (%) of 64.1% (SD=22.3%). Up to 51.6% of patients had at least one exacerbation in the year before the index date (Table 1).

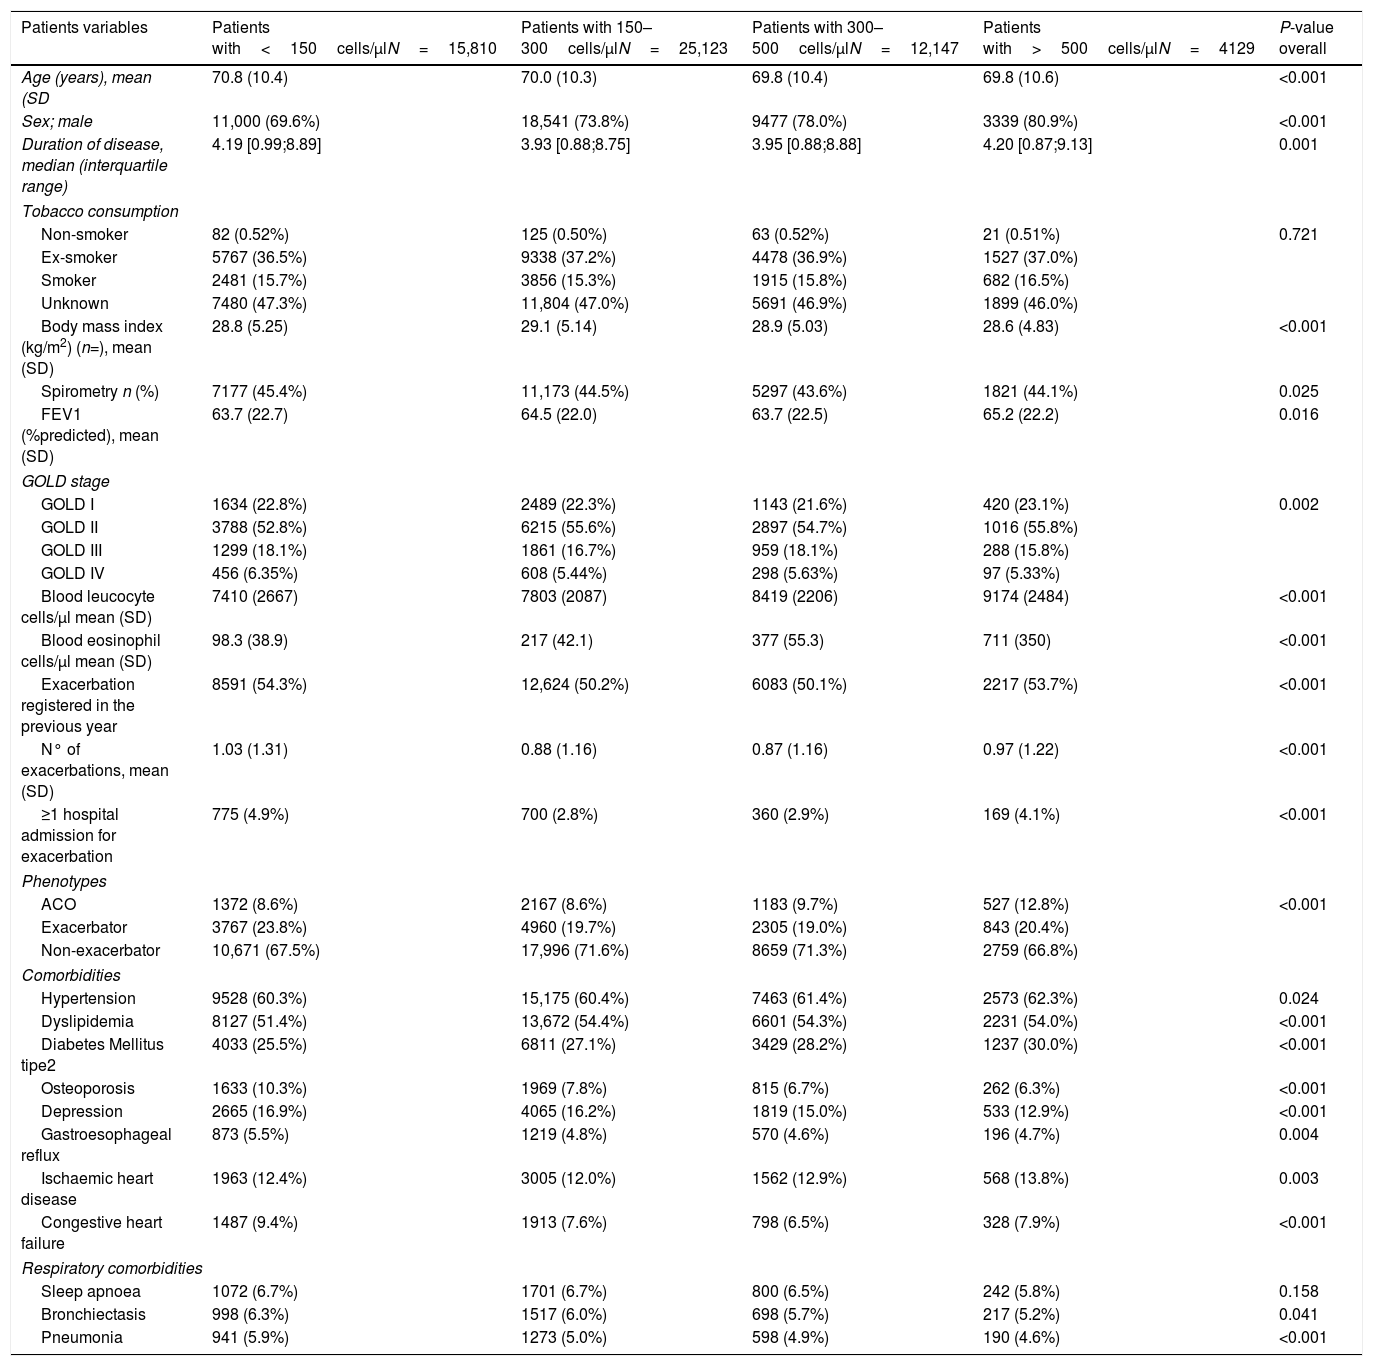
Baseline characteristics of patients according to the subgroups of peripheral blood eosinophilia.
| Patients variables | Patients with<150cells/μlN=15,810 | Patients with 150–300cells/μlN=25,123 | Patients with 300–500cells/μlN=12,147 | Patients with>500cells/μlN=4129 | P-value overall |
|---|---|---|---|---|---|
| Age (years), mean (SD | 70.8 (10.4) | 70.0 (10.3) | 69.8 (10.4) | 69.8 (10.6) | <0.001 |
| Sex; male | 11,000 (69.6%) | 18,541 (73.8%) | 9477 (78.0%) | 3339 (80.9%) | <0.001 |
| Duration of disease, median (interquartile range) | 4.19 [0.99;8.89] | 3.93 [0.88;8.75] | 3.95 [0.88;8.88] | 4.20 [0.87;9.13] | 0.001 |
| Tobacco consumption | |||||
| Non-smoker | 82 (0.52%) | 125 (0.50%) | 63 (0.52%) | 21 (0.51%) | 0.721 |
| Ex-smoker | 5767 (36.5%) | 9338 (37.2%) | 4478 (36.9%) | 1527 (37.0%) | |
| Smoker | 2481 (15.7%) | 3856 (15.3%) | 1915 (15.8%) | 682 (16.5%) | |
| Unknown | 7480 (47.3%) | 11,804 (47.0%) | 5691 (46.9%) | 1899 (46.0%) | |
| Body mass index (kg/m2) (n=), mean (SD) | 28.8 (5.25) | 29.1 (5.14) | 28.9 (5.03) | 28.6 (4.83) | <0.001 |
| Spirometry n (%) | 7177 (45.4%) | 11,173 (44.5%) | 5297 (43.6%) | 1821 (44.1%) | 0.025 |
| FEV1 (%predicted), mean (SD) | 63.7 (22.7) | 64.5 (22.0) | 63.7 (22.5) | 65.2 (22.2) | 0.016 |
| GOLD stage | |||||
| GOLD I | 1634 (22.8%) | 2489 (22.3%) | 1143 (21.6%) | 420 (23.1%) | 0.002 |
| GOLD II | 3788 (52.8%) | 6215 (55.6%) | 2897 (54.7%) | 1016 (55.8%) | |
| GOLD III | 1299 (18.1%) | 1861 (16.7%) | 959 (18.1%) | 288 (15.8%) | |
| GOLD IV | 456 (6.35%) | 608 (5.44%) | 298 (5.63%) | 97 (5.33%) | |
| Blood leucocyte cells/μl mean (SD) | 7410 (2667) | 7803 (2087) | 8419 (2206) | 9174 (2484) | <0.001 |
| Blood eosinophil cells/μl mean (SD) | 98.3 (38.9) | 217 (42.1) | 377 (55.3) | 711 (350) | <0.001 |
| Exacerbation registered in the previous year | 8591 (54.3%) | 12,624 (50.2%) | 6083 (50.1%) | 2217 (53.7%) | <0.001 |
| N° of exacerbations, mean (SD) | 1.03 (1.31) | 0.88 (1.16) | 0.87 (1.16) | 0.97 (1.22) | <0.001 |
| ≥1 hospital admission for exacerbation | 775 (4.9%) | 700 (2.8%) | 360 (2.9%) | 169 (4.1%) | <0.001 |
| Phenotypes | |||||
| ACO | 1372 (8.6%) | 2167 (8.6%) | 1183 (9.7%) | 527 (12.8%) | <0.001 |
| Exacerbator | 3767 (23.8%) | 4960 (19.7%) | 2305 (19.0%) | 843 (20.4%) | |
| Non-exacerbator | 10,671 (67.5%) | 17,996 (71.6%) | 8659 (71.3%) | 2759 (66.8%) | |
| Comorbidities | |||||
| Hypertension | 9528 (60.3%) | 15,175 (60.4%) | 7463 (61.4%) | 2573 (62.3%) | 0.024 |
| Dyslipidemia | 8127 (51.4%) | 13,672 (54.4%) | 6601 (54.3%) | 2231 (54.0%) | <0.001 |
| Diabetes Mellitus tipe2 | 4033 (25.5%) | 6811 (27.1%) | 3429 (28.2%) | 1237 (30.0%) | <0.001 |
| Osteoporosis | 1633 (10.3%) | 1969 (7.8%) | 815 (6.7%) | 262 (6.3%) | <0.001 |
| Depression | 2665 (16.9%) | 4065 (16.2%) | 1819 (15.0%) | 533 (12.9%) | <0.001 |
| Gastroesophageal reflux | 873 (5.5%) | 1219 (4.8%) | 570 (4.6%) | 196 (4.7%) | 0.004 |
| Ischaemic heart disease | 1963 (12.4%) | 3005 (12.0%) | 1562 (12.9%) | 568 (13.8%) | 0.003 |
| Congestive heart failure | 1487 (9.4%) | 1913 (7.6%) | 798 (6.5%) | 328 (7.9%) | <0.001 |
| Respiratory comorbidities | |||||
| Sleep apnoea | 1072 (6.7%) | 1701 (6.7%) | 800 (6.5%) | 242 (5.8%) | 0.158 |
| Bronchiectasis | 998 (6.3%) | 1517 (6.0%) | 698 (5.7%) | 217 (5.2%) | 0.041 |
| Pneumonia | 941 (5.9%) | 1273 (5.0%) | 598 (4.9%) | 190 (4.6%) | <0.001 |
The data are expressed as %, unless otherwise indicated. P-values adjusted for multiple comparisons using Bonferroni correction.
Abbreviations: COPD: Chronic obstructive pulmonary disease; SD: Standard deviation; ACO: asthma COPD overlap; FEV1: forced expiratory volume in 1 second.
Characteristics of the patients according to different blood eosinophil levels.
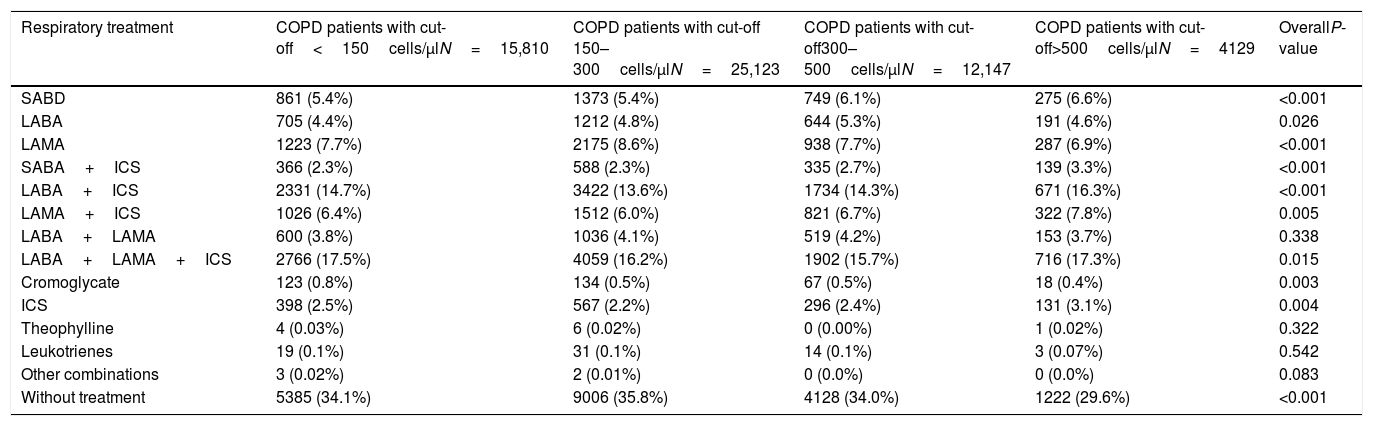
The distribution of blood eosinophils in the 4 subgroups is depicted in Fig. 2a. The mean number of exacerbations in the previous year was higher in patients with the lowest and the highest eosinophil levels (1.03 [SD=1.31] and 0.97 [SD=1.22], respectively) compared with the intermediate groups (0.88 [SD=1.16] and 0.87 [SD1.16], respectively) (Table 1, Fig. 3a). The percentage of patients admitted for an exacerbation followed the same distribution. The treatment administered to the patients in the different groups was very similar (Table 2).
 distribution in the global population; (b) distribution in the study population without inhaled corticosteroids.")
 group of baseline blood eosinophil count; (b) variability in blood eosinophil count during the previous year.")
Baseline respiratory treatment of patients according to the subgroups of peripheral blood eosinophilia.
| Respiratory treatment | COPD patients with cut-off<150cells/μlN=15,810 | COPD patients with cut-off 150–300cells/μlN=25,123 | COPD patients with cut-off300–500cells/μlN=12,147 | COPD patients with cut-off>500cells/μlN=4129 | OverallP-value |
|---|---|---|---|---|---|
| SABD | 861 (5.4%) | 1373 (5.4%) | 749 (6.1%) | 275 (6.6%) | <0.001 |
| LABA | 705 (4.4%) | 1212 (4.8%) | 644 (5.3%) | 191 (4.6%) | 0.026 |
| LAMA | 1223 (7.7%) | 2175 (8.6%) | 938 (7.7%) | 287 (6.9%) | <0.001 |
| SABA+ICS | 366 (2.3%) | 588 (2.3%) | 335 (2.7%) | 139 (3.3%) | <0.001 |
| LABA+ICS | 2331 (14.7%) | 3422 (13.6%) | 1734 (14.3%) | 671 (16.3%) | <0.001 |
| LAMA+ICS | 1026 (6.4%) | 1512 (6.0%) | 821 (6.7%) | 322 (7.8%) | 0.005 |
| LABA+LAMA | 600 (3.8%) | 1036 (4.1%) | 519 (4.2%) | 153 (3.7%) | 0.338 |
| LABA+LAMA+ICS | 2766 (17.5%) | 4059 (16.2%) | 1902 (15.7%) | 716 (17.3%) | 0.015 |
| Cromoglycate | 123 (0.8%) | 134 (0.5%) | 67 (0.5%) | 18 (0.4%) | 0.003 |
| ICS | 398 (2.5%) | 567 (2.2%) | 296 (2.4%) | 131 (3.1%) | 0.004 |
| Theophylline | 4 (0.03%) | 6 (0.02%) | 0 (0.00%) | 1 (0.02%) | 0.322 |
| Leukotrienes | 19 (0.1%) | 31 (0.1%) | 14 (0.1%) | 3 (0.07%) | 0.542 |
| Other combinations | 3 (0.02%) | 2 (0.01%) | 0 (0.0%) | 0 (0.0%) | 0.083 |
| Without treatment | 5385 (34.1%) | 9006 (35.8%) | 4128 (34.0%) | 1222 (29.6%) | <0.001 |
P-values adjusted for multiple comparisons using Bonferroni correction.
Abbreviations: COPD: Chronic obstructive pulmonary disease; SABD: Short-acting bronchodilators; LABA: long-acting beta-2 agonists; LAMA: long-acting antimuscarinic agents; ICS: Inhaled corticosteroids.
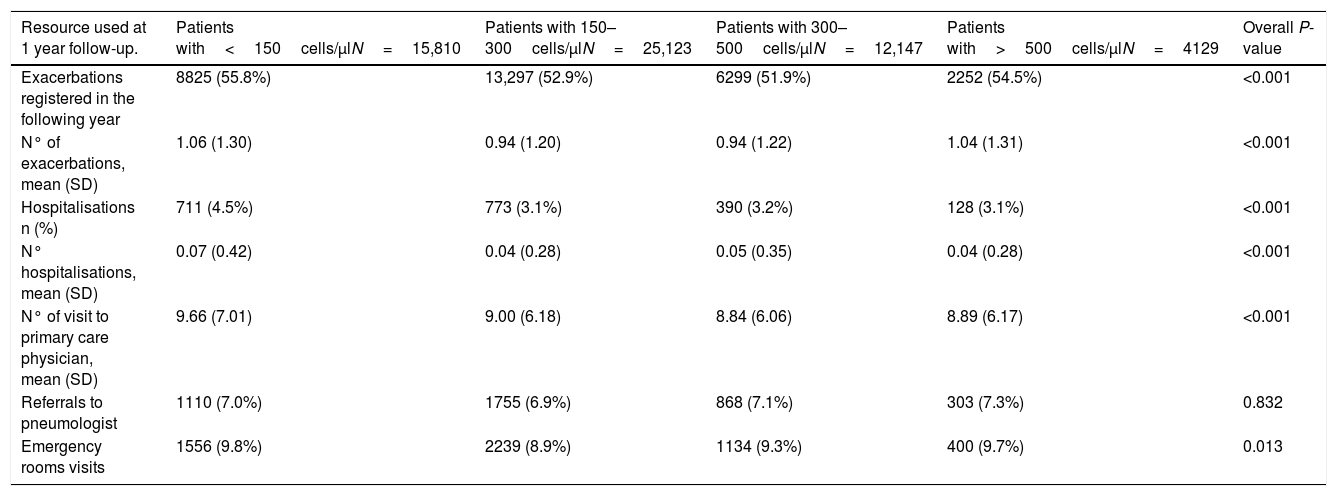
Although the HRU for COPD was similar among groups, the highest frequency of exacerbations and hospitalisations for COPD was observed in patients with the lowest blood eosinophil levels (Table 3). The ROC curve for the level of blood eosinophils that could discriminate between patients with or without exacerbations during follow-up showed an area under the curve (AUC) of 0.544 (CI95%: 0.530–0.557), with a sensitivity of 0.31, specificity of 0.76 and a positive predicted values (PPV) of 0.046. Likewise, the AUC for the discrimination between frequent and infrequent exacerbators was 0.515 (CI95%: 0.510–0.521) with a sensitivity of 0.32, specificity of 0.72 and PPV of 0.273; and therefore, a reliable threshold of blood eosinophilia could not be established.
Resources used at 1 year of follow-up according to the subgroups of peripheral blood eosinophilia.
| Resource used at 1 year follow-up. | Patients with<150cells/μlN=15,810 | Patients with 150–300cells/μlN=25,123 | Patients with 300–500cells/μlN=12,147 | Patients with>500cells/μlN=4129 | Overall P-value |
|---|---|---|---|---|---|
| Exacerbations registered in the following year | 8825 (55.8%) | 13,297 (52.9%) | 6299 (51.9%) | 2252 (54.5%) | <0.001 |
| N° of exacerbations, mean (SD) | 1.06 (1.30) | 0.94 (1.20) | 0.94 (1.22) | 1.04 (1.31) | <0.001 |
| Hospitalisations n (%) | 711 (4.5%) | 773 (3.1%) | 390 (3.2%) | 128 (3.1%) | <0.001 |
| N° hospitalisations, mean (SD) | 0.07 (0.42) | 0.04 (0.28) | 0.05 (0.35) | 0.04 (0.28) | <0.001 |
| N° of visit to primary care physician, mean (SD) | 9.66 (7.01) | 9.00 (6.18) | 8.84 (6.06) | 8.89 (6.17) | <0.001 |
| Referrals to pneumologist | 1110 (7.0%) | 1755 (6.9%) | 868 (7.1%) | 303 (7.3%) | 0.832 |
| Emergency rooms visits | 1556 (9.8%) | 2239 (8.9%) | 1134 (9.3%) | 400 (9.7%) | 0.013 |
The data are expressed as %, unless otherwise indicated. P-values adjusted for multiple comparisons using Bonferroni correction.
Abbreviations: SD: Standard deviation.
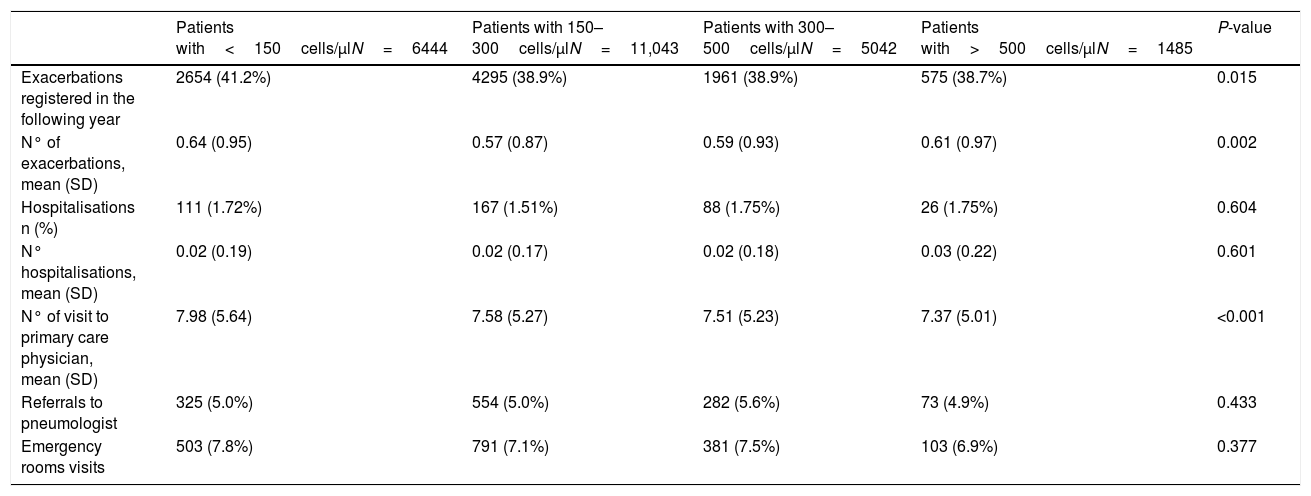
This analysis included 24,014 patients (41.9% of the total sample) (Fig. 1). Their characteristics were very similar to those of the total population (Fig. 2b and supplementary Tables 1S and 2S). The distribution of exacerbations, hospital admissions and emergency visits followed the same distribution as in the global population, with the highest frequency again being found in patients with the lowest eosinophil counts (Table 4).
Resources used at 1 year of follow-up in patients not taking inhaled corticosteroids (ICS) in the year prior to the index date and during the year of follow-up (n=24,014).
| Patients with<150cells/μlN=6444 | Patients with 150–300cells/μlN=11,043 | Patients with 300–500cells/μlN=5042 | Patients with>500cells/μlN=1485 | P-value | |
|---|---|---|---|---|---|
| Exacerbations registered in the following year | 2654 (41.2%) | 4295 (38.9%) | 1961 (38.9%) | 575 (38.7%) | 0.015 |
| N° of exacerbations, mean (SD) | 0.64 (0.95) | 0.57 (0.87) | 0.59 (0.93) | 0.61 (0.97) | 0.002 |
| Hospitalisations n (%) | 111 (1.72%) | 167 (1.51%) | 88 (1.75%) | 26 (1.75%) | 0.604 |
| N° hospitalisations, mean (SD) | 0.02 (0.19) | 0.02 (0.17) | 0.02 (0.18) | 0.03 (0.22) | 0.601 |
| N° of visit to primary care physician, mean (SD) | 7.98 (5.64) | 7.58 (5.27) | 7.51 (5.23) | 7.37 (5.01) | <0.001 |
| Referrals to pneumologist | 325 (5.0%) | 554 (5.0%) | 282 (5.6%) | 73 (4.9%) | 0.433 |
| Emergency rooms visits | 503 (7.8%) | 791 (7.1%) | 381 (7.5%) | 103 (6.9%) | 0.377 |
The data are expressed as %, unless otherwise indicated. P-values adjusted for multiple comparisons using Bonferroni correction.
Abbreviations: SD: Standard deviation.
More than one eosinophil count in stable state during the year before the index date was available in 15,769 patients (27.5% of the total sample) (Fig. 1). Of these, the different measurements were considered stable in 9784 (62%), while in 5310 patients (33.6%) were classified as little variability and 675 (4.3%) were classified as large variability. The characteristics of patients in these three groups are shown in supplementary Tables 3S and 4S. The frequency of exacerbations significantly increased with the increase in variability (Fig. 3b).
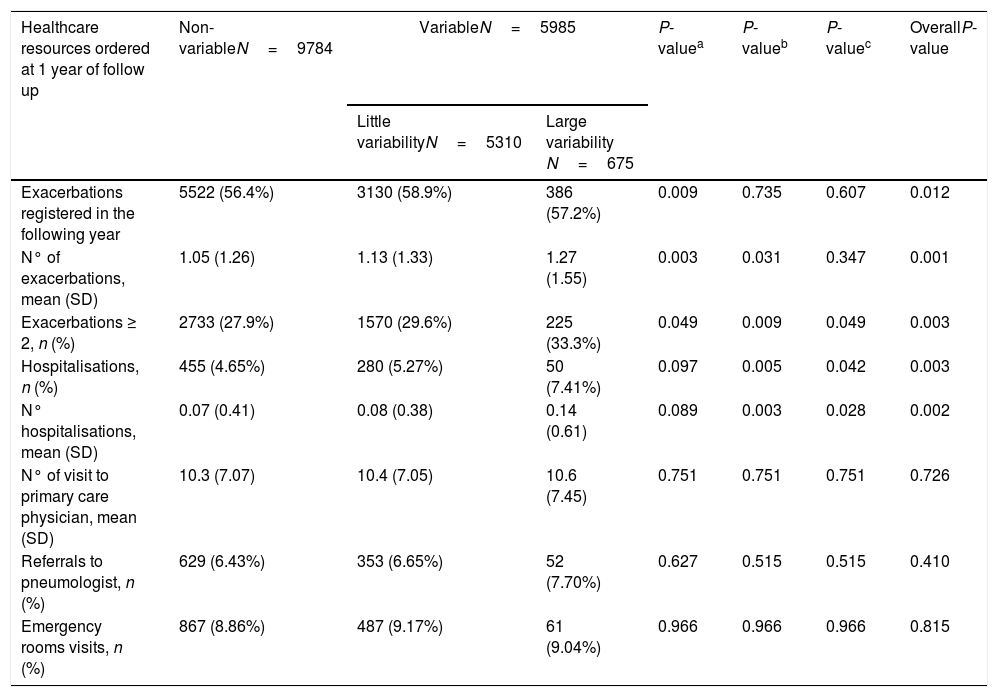
During follow-up, the group with high variability in blood eosinophil counts presented more exacerbations, hospitalisations and a higher frequency of patients with 2 or more exacerbations (Table 5).
Resources used at 1 year of follow-up for COPD according to the level of variability of peripheral blood eosinophilia (n=15,769).
| Healthcare resources ordered at 1 year of follow up | Non-variableN=9784 | VariableN=5985 | P-valuea | P-valueb | P-valuec | OverallP-value | |
|---|---|---|---|---|---|---|---|
| Little variabilityN=5310 | Large variability N=675 | ||||||
| Exacerbations registered in the following year | 5522 (56.4%) | 3130 (58.9%) | 386 (57.2%) | 0.009 | 0.735 | 0.607 | 0.012 |
| N° of exacerbations, mean (SD) | 1.05 (1.26) | 1.13 (1.33) | 1.27 (1.55) | 0.003 | 0.031 | 0.347 | 0.001 |
| Exacerbations ≥ 2, n (%) | 2733 (27.9%) | 1570 (29.6%) | 225 (33.3%) | 0.049 | 0.009 | 0.049 | 0.003 |
| Hospitalisations, n (%) | 455 (4.65%) | 280 (5.27%) | 50 (7.41%) | 0.097 | 0.005 | 0.042 | 0.003 |
| N° hospitalisations, mean (SD) | 0.07 (0.41) | 0.08 (0.38) | 0.14 (0.61) | 0.089 | 0.003 | 0.028 | 0.002 |
| N° of visit to primary care physician, mean (SD) | 10.3 (7.07) | 10.4 (7.05) | 10.6 (7.45) | 0.751 | 0.751 | 0.751 | 0.726 |
| Referrals to pneumologist, n (%) | 629 (6.43%) | 353 (6.65%) | 52 (7.70%) | 0.627 | 0.515 | 0.515 | 0.410 |
| Emergency rooms visits, n (%) | 867 (8.86%) | 487 (9.17%) | 61 (9.04%) | 0.966 | 0.966 | 0.966 | 0.815 |
P-values adjusted for multiple comparisons using Bonferroni correction.
In the present study, the mean blood eosinophil concentrations in patients with COPD was 254cells/μl, with concentrations>300cell/μl in 28.4%. Patients with the lowest blood eosinophil levels (<150cells/μl) presented the highest frequency of exacerbations and hospitalisations, both the year before and after eosinophil measurement, followed by patients with the highest eosinophil levels (>500cells/μl). These results remained unchanged on analysing only patients who did not receive ICS in either the year prior to or after eosinophil measurement. The classification of patients in the four categories of blood eosinophil counts was quite stable, with 62% remaining within the same category and only 4.3% showing large variability, defined as two measurements belonging to non-consecutive categories. Interestingly, patients with the greatest variability were those with more frequent exacerbations and hospitalisation during the follow-up year.
There is increasing interest in the use of blood eosinophil count as a biomarker in COPD.1,17–20 Although no definitive prospective studies have yet been conducted, and there is no agreement on the most effective eosinophil cut-off level to identify responders to ICS, there is increasing recognition that high blood eosinophil counts are associated with better response to ICS in a dose-response fashion.3–5 However, the use of blood eosinophil levels as a biomarker of increased risk of exacerbations is more controversial.1,17–20
Some of the differences observed in demographic or clinical characteristics were statistically significant due to the large sample size, but most were small at less than 10%. Patients with a higher eosinophil count had more leukocytes and more frequently had an ACO phenotype.21–23 The lack of significant or relevant differences in the characteristics of COPD patients with different blood eosinophil levels has consistently been reported in previous studies, despite the different cut-offs used.10–12,24,25 The possible use of eosinophil level as a predictor of risk of exacerbations and hospitalisations is of greater interest. In the present study, patients with the lowest eosinophil levels (<150cells/μl) had the highest number of moderate and severe exacerbations, followed by those with the highest eosinophil concentrations (>500cells/μl). Differences in the frequency of exacerbations in patients in the intermediate groups were significant, albeit of small magnitude. Our results are in contrast with those observed in a study using electronic medical records and insurance claims data in the US, in which patients with ≥150cells/μl had higher all-cause and COPD-related HRU.26 However, the U-shape distribution in the risk of moderate exacerbations observed in our study was also found in a Copenhagen cohort of 7225 patients.8 In that study, patients with less than 130cells/μl and those with more than 340cells/μl showed the highest frequency of moderate exacerbations. However, the risk of severe exacerbations was only increased in those with high eosinophil counts, and the cut-off of 340cells/μl demonstrated an AUC of 0.63 to identify patients with increased risk of exacerbations. Interestingly, this increased risk was relevant for severe exacerbations (OR=1.76), but quite modest for moderate exacerbations (OR=1.15). In contrast, we were unable to identify any cut-off value that could reliably indicate an increased risk for either exacerbations or frequent exacerbations. These results concur with others performed in different COPD populations. In a series of 294 patients, Turato et al.24 did not observe an increased risk of exacerbations in those with eosinophil levels greater than 150cells/μl, and no significant difference was found in blood eosinophil counts in exacerbators compared with non-exacerbators. Similarly, Shin et al.25 did not find any difference in eosinophil counts in exacerbators and non-exacerbators in a sample of 299 COPD patients. The same results were observed in the CHAIN and BODE cohorts,10 as well as in the BPCO French cohort,11 the SPIROMIC cohort,12 a recent study on hospitalised patients,27 and in a large population of 27,557 patients from the UK database.9 In these studies, no differences were found in exacerbation history using different blood eosinophil cut-offs.
The possible increased risk of severe exacerbations with increased eosinophil counts also contradicts the consistent finding in several studies conducted in different populations of a better survival associated with higher blood eosinophil levels.10,24,25,28 These controversial results indicate that blood eosinophils may either be a very poor predictor of exacerbation risk or they may be a reasonable predictor of risk only in a subgroup of patients with COPD, namely the frequent exacerbators; in fact, our population was predominantly made up of non-exacerbators. In a recent study analysing data from the ECLIPSE and the COPDGene cohorts, a blood eosinophil concentration>300cells/μl was a good predictor of future risk of exacerbations only in patients with frequent exacerbations, but not in patients with 0 or 1 exacerbation in the previous year.6 Finally, it is possible that only patients with a persistently high eosinophil count have an increased risk of exacerbations,29 but the need for more than one determination makes the implementation of the use of eosinophils levels difficult in clinical practice.
In contrast, there is greater agreement regarding the possible role of blood eosinophil counts as a predictor of response to ICS in COPD. Different studies have consistently shown that increased blood eosinophil concentrations are a reliable biomarker for better clinical response to ICS in COPD.3–5 In order to evaluate the possible confounding effect of the use of ICS, we replicated the analysis in a subgroup of more than 24,000 patients who had not received any ICS in the year prior to and after the baseline date. The results obtained were practically identical to those found with the total sample, thereby ruling out the influence of ICS use on the results, as suggested in previous studies.27,30
Biological measurements are subject to variability, but in the case of biomarkers, large variability may jeopardise their usefulness in clinical practice. Interestingly, different studies have suggested good reproducibility of blood eosinophil measurements, with interclass correlation coefficient (ICC) of measurements of blood eosinophils of around 0.8.31,32 In the ECLIPSE and COPDGene, the ICC of repeated blood eosinophil measurements in stable state was 0.57.6 However, other studies have highlighted the possible switching of categories (high/low eosinophil counts) in between 13% and 43% of patients.8,10,25,32 In our study, blood eosinophil measurements were quite stable, with repeated measurements belonging to the same category in nearly two thirds of the patients, and only 4.3% of measurements jumped at least two categories. This is important because a switch in category may not always represent a biological change; i.e. a change from 295 to 305cells/μl is defined as a switch in category if the threshold is 300cells/μl, but this does not represent a significant biological change. Our results concur with those of Southworth et al.32 who observed a change between the lowest and highest categories of blood eosinophils in only 1.7% of their patients, and Greulich et al.33 found that eosinophil counts were quite stable especially when the counts were low (<150cells/μl). Similarly, our results also concur with those obtained in large databases, such as the Clinical Practice Research Datalink in the Netherlands, which includes the data of +39,000 COPD patients. In this latter study, stability, defined as values persistently above or below 340cells/μl, was reported in 85% of patients at 6 months and in 62% at 2 years.34
A novel observation of our study was the increased risk of HRU in the small subgroup of patients with large variability in blood eosinophil counts. This “instability” in blood eosinophil counts may be a marker of clinical instability; nonetheless, further studies are needed to confirm these results.
It was interesting to observe that approximately 30% of patients with a diagnosis of COPD were not receiving regular treatment. This high percentage of patients without treatment was also observed in previous studies14 in primary care and is very different from the data obtained in respiratory departments22,35 and indicated that guidelines are not well implemented in primary care.
The current study has some limitations. As in most database studies, full categorisation of COPD patients is not always possible, as spirometry was available in less than half of the patients; however, a validated diagnostic algorithm was used to try to minimise the risk of misclassification. Although we attempted to capture all the episodes of exacerbations, there is a risk of underreporting. Notwithstanding, this underreporting should affect all the categories of blood eosinophils equally, and therefore, should not significantly affect the results of the study. The population was predominantly of non-exacerbators, and therefore, specific studies in a population with a high frequency of exacerbations are required. Variability in eosinophil counts was only analysed in patients in whom more than one measurement was available, and therefore, it is possible that these patients are the most severe and require greater medical attention. However, the clinical characteristics of this subgroup were not significantly different from the remaining patients; nevertheless, this circumstance would have biased the results towards more HRU in this subgroup, which was not the case. In contrast, the strength of this study is its representativeness, since more than 80% of the general population is included in this database, and blood eosinophil values were collected from lab reports, thereby excluding any possible transcription errors. Eosinophils were only analysed in absolute numbers, but the quartiles described correspond to a distribution of mean percentages of approximately 1%, 2.5%, 4.5% and 7%.
In summary, our results do not support the use of blood eosinophil counts as a marker of risk for HRU in the general COPD population at low risk of exacerbations, although an increased risk was observed in association with large variability of blood eosinophil levels. Nonetheless, this should be confirmed in other studies. These results extend our understanding of the role of eosinophils as a biomarker in COPD.
FundingThis study was funded by GlaxoSmithKline (study HO-16-6446).
Conflict of interestMarc Miravitlles has received personal fees from GlaxoSmithKline during the conduct of the study and has received speaker or consulting fees from AstraZeneca, Bial, Boehringer Ingelheim, Chiesi, Cipla, CSL Behring, Laboratorios Esteve, Ferrer, Gebro Pharma, GlaxoSmithKline, Grifols, Menarini, Mereo Biopharma, Novartis, pH Pharma, Rovi, TEVA, Verona Pharma and Zambon, and research grants from GlaxoSmithKline and Grifols.
Bernardino Alcázar-Navarrete reports personal fees from GSK, grants, personal fees and non-financial support from Novartis AG, personal fees and non-financial support from Boehringer Ingelheim, personal fees and non-financial support from Chiesi, grants, personal fees and non-financial support from Laboratorios Menarini, personal fees from Gebro, personal fees from AstraZeneca, outside the submitted work. The remaining authors have no relevant competing interests to disclose.
The following are the supplementary data to this article:


