

Air pollution is associated with a substantial burden on human health; however, the most important pollutants may vary with location. Proper monitoring is necessary to determine the effect of these pollutants on respiratory health.
ObjectivesThis study was designed to evaluate the role of outdoor, indoor and personal exposure to combustion-related pollutants NO2 and O3 on respiratory health of children in a non-affluent urban area of São Paulo, Brazil.
MethodsLevels of NO2 and O3 were continuously measured in outdoor and indoor air, as well as personal exposure, for 30 days using passive measurement monitors. Respiratory health was assessed with a Brazilian version of the ISAAC questionnaire.
ResultsComplete data were available from 64 children, aged 6–10 years. Respiratory morbidity was high, with 43 (67.2%) reporting having had wheezing at any time, 27 (42.2%) wheezing in the last month, 17 (26.6%) asthma at any time and 21 (32.8%) pneumonia at any time. Correlations between levels of NO2 and O3 measured in the three locations evaluated were poor. Levels of NO2 in indoor air and personal exposure to O3 were independently associated with asthma (both cases P=.02), pneumonia (O3, P=.02) and wheezing at any time (both cases P<.01). No associations were seen between outdoor NO2 and O3 and respiratory health.
ConclusionsExposure to higher levels of NO2 and O3 was associated with increased risk for asthma and pneumonia in children. Nonetheless, the place where the pollutants are measured influences the results. The measurements taken in indoor and personal exposure were the most accurate.
La contaminación atmosférica se asocia a una carga sustancial para la salud humana; sin embargo, los contaminantes de mayor importancia pueden variar según el lugar. Es necesaria una monitorización adecuada para determinar el efecto de dichos contaminantes sobre la salud respiratoria.
ObjetivosEste estudio se diseñó para evaluar el papel de la exposición en el exterior, en el interior y personal a los contaminantes derivados de la combustión NO2 y O3 sobre la salud respiratoria de los niños en una zona urbana económicamente poco favorecida de São Paulo (Brasil).
MétodosSe determinaron de forma continua los niveles de NO2 y O3 en el aire del exterior, el interior, y también en la exposición personal, durante 30 días con el empleo de aparatos de medición pasiva. Se evaluó la salud respiratoria con una versión en brasileño del cuestionario ISAAC.
ResultadosSe dispuso de datos completos de 64 niños de 6 a 10 años de edad. La morbilidad respiratoria fue alta, con 43 (67,2%) niños en los que había habido sibilancias en alguna ocasión, 27 (42,2%) con sibilancias en el mes anterior, 17 (26,6%) con asma en alguna ocasión y 21 (32,8%) con neumonía en alguna ocasión. Las correlaciones entre los niveles de NO2 y O3 determinados en las 3 localizaciones evaluadas fueron bajas. Los niveles de NO2 en el área de interior y la exposición personal a O3 mostraron una asociación independiente con el asma (p=0,02 en ambos casos), la neumonía (O3, p=0,02) y la presencia de sibilancias en alguna ocasión (p<0,01 en ambos casos). No se observaron asociaciones entre el NO2 y el O3 del exterior y la salud respiratoria.
ConclusionesLa exposición a niveles más elevados de NO2 y O3 se asoció a un aumento del riesgo de asma y neumonía en los niños; sin embargo, el lugar en el que se determinan los contaminantes influye en los resultados. Las determinaciones realizadas en el interior y las determinaciones personales fueron las más exactas.
Air pollution is associated with a considerable burden for human health worldwide; however, the most relevant toxic factors may differ according to location. The World Health Organization reports that there are more than 2 million premature deaths annually that may be attributable to air pollution, and half occur in developing countries.1
São Paulo is the largest city in South America. With more than 11 million inhabitants, there are more than 7 million registered cars, trucks, motorcycles and public buses, which are all an important source of air pollution.2 The number of vehicles that circulate in the city has grown immensely in the last decade. The estimated commute time for those who move around the city using one of these means of transportation to get to work has also increased to an average of 2.4h per day in 2009, which is an increase of 74% over 2007. Over the course of the last 30 years, traffic speed has decreased 60% in urban areas, resulting in important repercussions in the inhalation exposure times for the population at large.3 It is known that children are more sensitive to air pollution as their ventilation requirements (related to body weight) are higher than those of adults, both at rest as well as during exercise.4 It has been reported that children with asthma present increased respiratory morbidity when exposed to particulate material (PM), nitrogen dioxide (NO2), carbon monoxide and ozone (O3).5–9
With the aim to exactly determine the repercussions of toxic products in the air in clinical results, pollution determinations should reliably reflect the actual environmental exposure patterns of the populations being studied.10 Nevertheless, the exposure of children is generally estimated based on data obtained at monitoring stations.5,8 Some studies use geographical information systems (GIS) or even very sophisticated models like land-use regression (LUR) maps.11 The search for better models of adjustment for the association between traffic-related pollutants and clinical respiratory results in children are aimed at determining these products as closely as possible to the individuals in question, thus evaluating the personal exposure in real life. Recent advances in the evaluation of personal exposure in children include the identification of coal in the macrophages of the respiratory tract and the use of simple devices that children can carry during daily activities.12,13
In the present study we have used new, simple and inexpensive atmospheric gas detectors that were developed and validated by the University of São Paulo14 in order to evaluate the repercussions of NO2 (an indicator of primary pollutants) and O3 (which correlates with secondary pollutants generated by photochemical processes) on highly prevalent clinical respiratory results, such as pneumonia and asthma. Our hypothesis was that, in a population of children from poor areas who are exposed to intense automobile traffic, air pollution is an independent risk factor for respiratory morbidity if appropriate monitoring is used.
MethodsWe selected a specific residential district of the city of São Paulo for the study for its intense exposure to automobile traffic. As a place for taking samples, we chose a primary care health clinic that is operated by the public administration because it is representative of the average population treated in the region. All the children from ages 6 to 10 who had a scheduled morning appointment at the clinic between August and October 2009 and their parents were invited to participate, and they constitute the study sample. In this population, data were obtained from a questionnaire and pollution determinations were made. The questionnaires were based on a validated Brazilian ISAAC protocol and were administered to the children's mothers by a specially trained interviewer at their homes.15 The main health state variables evaluated in this study were based on the following questions: “Has your child ever had an episode of wheezing?”, “Has your child been diagnosed with asthma by a physician?”, “Has your child ever been diagnosed with pneumonia?”, “Has your child used any asthma medicine in the last 12 months?”, “Has your child had any wheezing in the last 12 months?” and “Has your child not attended school at any time in the last 12 months due to wheezing/respiratory problems?”
The parents or legal guardians of the selected subjects gave their informed consent for the study. This study was approved by the ethics committee of the Hospital das Clínicas of the School of Medicine at the University of São Paulo.
Evaluation of the ExposureExposure to air pollutants was evaluated in the interior of the homes with validated filters (methodology described in another publication14). Each home was visited on 3 occasions (at the start, middle and end of the study) in order to install, change and collect the filters for determining air pollution, which were then stored in small recycled-plastic camera film containers, with the cover off. For the indoor (IN) and outdoor (OUT) determinations, these devices were attached to common clothes hangers and placed out of the reach of children at a height of 3m. The indoor filters were installed in the living room, while the outdoor devices were placed on balconies or similar exterior spaces within 3m of the outside wall of the home and protected from direct rain exposure. The personal determinations (PNL) were done with the filters placed on plastic discs and attached to the outside of the children's school bags. The bags were kept in different places within the home when the children were not at school, but most of the time the school bags were kept in the children's rooms. The exposure was evaluated for a continuous 30-day period; the NO2 filters were changed after 15 days due to the expiration date of the chemical substances they contained.
The concentrations of NO2 and O3 in the filters were determined in the following manner: the cellulose filters were treated chemically at the pollution research laboratories of the School of Medicine at the University of São Paulo, and they were analyzed with spectrophotometry and reflectance. The preciseness of the determinations was established by comparing the data from the filter with those at a permanent atmospheric monitoring station at the CETESB (official environmental agency of the State of São Paulo). In these tests, the filters were exposed for 12h/day, from days 1 to 7, close to the permanent CETESB stations at positions similar to those used in the children's homes. Quality controls were also done in the interior for a period of 30 days, and these data were compared with the data from the stations (data not presented).
Statistical AnalysisThe variables for health results were initially reported according to prevalence (%), mean (standard deviation) or median (interquartile range). The exposure to pollution was classified as low, intermediate or high according to the concentration tertiles of NO2 and O3 for the mean value of the 30 days of exposure of the filters. Spearman's correlation coefficients (R) were calculated to evaluate the correlation of the exposure determinations in different contexts (IN, OUT, PNL). The association between exposure and health results was analyzed with the χ2 test for linear tendency. Logistic regression models were used to calculate the univariate and multivariate analyses (adjusted for sociodemographic factors, adjusted for family factors and adjusted for environmental factors). Given the sample size, these multivariate models were not additives, but they instead were analyzed independently. The exposure to pollution variable was used as a continuous variable, which means that the effect goes from one exposure tertile to a higher tertile. The sample size was calculated based on the supposition that the prevalence of asthma in the studied area would be higher than that of the normal population of the city of São Paulo, which has previously been observed to be around 7%.16 Predicting a prevalence of 20%, a probability of alpha error of 5% and a statistical power of 80%, the study would need a sample of 42 subjects in order to establish the correlation between pollutants derived from combustion and clinical respiratory results.
The analyses were done with the STATA 10.0® program.
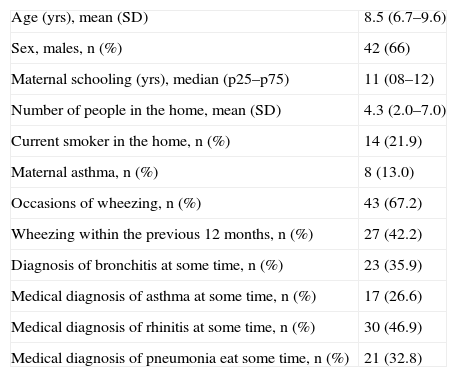
ResultsPopulationSeventy children between the ages of 6 and 10 participated in the study. Six were later excluded from the final analysis due to the fact that the filters had minor physical damage that could have affected the preciseness of the NO2 and O3 determinations. The clinical characteristics of the study population (n=64) are shown in Table 1.
Characteristics of the Overall Population and Frequency of Respiratory Symptoms and Clinical Diagnoses, According to the Responses Given to the Questionnaire (n=64).
| Age (yrs), mean (SD) | 8.5 (6.7–9.6) |
| Sex, males, n (%) | 42 (66) |
| Maternal schooling (yrs), median (p25–p75) | 11 (08–12) |
| Number of people in the home, mean (SD) | 4.3 (2.0–7.0) |
| Current smoker in the home, n (%) | 14 (21.9) |
| Maternal asthma, n (%) | 8 (13.0) |
| Occasions of wheezing, n (%) | 43 (67.2) |
| Wheezing within the previous 12 months, n (%) | 27 (42.2) |
| Diagnosis of bronchitis at some time, n (%) | 23 (35.9) |
| Medical diagnosis of asthma at some time, n (%) | 17 (26.6) |
| Medical diagnosis of rhinitis at some time, n (%) | 30 (46.9) |
| Medical diagnosis of pneumonia eat some time, n (%) | 21 (32.8) |
The prevalence of respiratory morbidity in the study population was high, with 43 (67.2%) children who had had wheezing at some time and 27 (42.2%) with wheezing in the previous 12 months (Table 1).
Out of the participants who referred having presented wheezing on some occasions, 37.5% (16/43) had experienced the first episode of wheezing during the first year of life. However, only 11 (45.8%) later evolved into an asthma diagnosis. Almost 40% of the children had missed some days of school due to respiratory diseases. The fact of having presented wheezing at some time was significantly associated with the use of asthma medication (38 [88.4%]). During the previous 12 months, 14 (32.5%) of the children who had presented wheezing were attended in the emergency room on at least one occasion due to respiratory problems and 4 had to be hospitalized.
Determinations of NO2 and O3 ExposureThe distribution of the accumulative concentrations indicated by the NO2 and O3 readings are presented in Fig. 1.
, outdoor (OUT) and personal (PNL).")
A weak correlation was observed between the determinations done in different places, both for NO2 as well as O3. The Spearman's correlation coefficients were less than 0.35 for the comparisons of OUT- and PNL-NO2, and IN-, OUT- and PNL-O3. The levels of IN-NO2 in those homes where there were smokers showed even lower correlation levels compared with the OUT-NO2 values (R=0.13). There was a moderate correlation between the levels of OUT- and IN-NO2 (R=0.42).
PNL-NO2 showed concentration levels that were significantly lower than the IN-NO2 levels (mean, SD=12.6±3.6μg/m3 versus 17.6±3.9μg/m3, P<.01).
Associations of NO2 and O3 With Respiratory VariablesFig. 2 shows that the exposure to high levels of IN-NO2 and PNL-O3 was associated with the medical diagnosis of asthma (P=.02 in both cases) and the medical diagnosis of pneumonia (PNL-O3; P=.02). Having presented wheezing at any time (P<.01 in both cases) as well as the use of medication for asthma in the previous 12 months were associated with the level of PNL-O3 (P=.05). Having missed school due to respiratory symptoms was also significantly associated with both parameters (data not presented). There was a tendency towards a positive association between these measurements and the presence of wheezing in the previous 12 months, although without reaching statistical significance.
, medium (MED) and high (H). (A) Respiratory results “on occasion”. MD: medical diagnosis; Pneu: pneumonia; *P=.02; **P=.55; # .01; ##P<.01 (χ2 for the tendency). (B) Respiratory results in the previous 12 months. Absences: days of school missed due to asthma or respiratory symptoms in the previous 12 months; asthma med: use of asthma medication in the previous 12 months; wheezing 12m: wheezing in the previous 12 months; *P<.04; **P=.16; ***P=.05; #P=.09; ##P=.35; ###P=.38 (×2 for the tendency).")
Associations between exposure levels to IN-NO2 and PNL-O3 and respiratory results in children; univariate analyses by tertiles of exposure levels as low (L), medium (MED) and high (H). (A) Respiratory results “on occasion”. MD: medical diagnosis; Pneu: pneumonia; *P=.02; **P=.55; # .01; ##P<.01 (χ2 for the tendency). (B) Respiratory results in the previous 12 months. Absences: days of school missed due to asthma or respiratory symptoms in the previous 12 months; asthma med: use of asthma medication in the previous 12 months; wheezing 12m: wheezing in the previous 12 months; *P<.04; **P=.16; ***P=.05; #P=.09; ##P=.35; ###P=.38 (×2 for the tendency).
None of the pollution determinations done outside the homes showed an association with the respiratory variables (data not presented). The IN-O3 did not show any association with any of the clinical results that were evaluated.
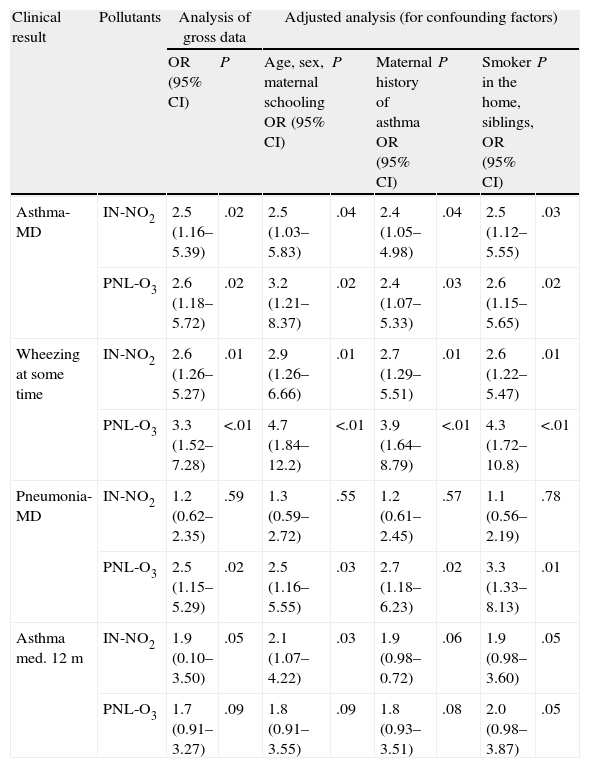
In the multivariate analyses, the exposure to IN-NO2 and PNL-O3 was evaluated in association with the clinical respiratory results (medical diagnosis of asthma, medical diagnosis of pneumonia, wheezing at some time and medication for asthma in the last 12 months), after introducing a control for possible confounding factors (age, sex, maternal schooling, smoking in the home and presence of siblings) in 4 analytical models, as indicated in Table 2.
Risk for Medical Diagnosis of Asthma, Medical Diagnosis of Pneumonia, Wheezing at Some Time and Use of Asthma Medication in the Previous 12 Months According to the Change in Level of the Exposure Profile for IN-NO2 and PNL-O3.
| Clinical result | Pollutants | Analysis of gross data | Adjusted analysis (for confounding factors) | ||||||
| OR (95% CI) | P | Age, sex, maternal schooling OR (95% CI) | P | Maternal history of asthma OR (95% CI) | P | Smoker in the home, siblings, OR (95% CI) | P | ||
| Asthma-MD | IN-NO2 | 2.5 (1.16–5.39) | .02 | 2.5 (1.03–5.83) | .04 | 2.4 (1.05–4.98) | .04 | 2.5 (1.12–5.55) | .03 |
| PNL-O3 | 2.6 (1.18–5.72) | .02 | 3.2 (1.21–8.37) | .02 | 2.4 (1.07–5.33) | .03 | 2.6 (1.15–5.65) | .02 | |
| Wheezing at some time | IN-NO2 | 2.6 (1.26–5.27) | .01 | 2.9 (1.26–6.66) | .01 | 2.7 (1.29–5.51) | .01 | 2.6 (1.22–5.47) | .01 |
| PNL-O3 | 3.3 (1.52–7.28) | <.01 | 4.7 (1.84–12.2) | <.01 | 3.9 (1.64–8.79) | <.01 | 4.3 (1.72–10.8) | <.01 | |
| Pneumonia-MD | IN-NO2 | 1.2 (0.62–2.35) | .59 | 1.3 (0.59–2.72) | .55 | 1.2 (0.61–2.45) | .57 | 1.1 (0.56–2.19) | .78 |
| PNL-O3 | 2.5 (1.15–5.29) | .02 | 2.5 (1.16–5.55) | .03 | 2.7 (1.18–6.23) | .02 | 3.3 (1.33–8.13) | .01 | |
| Asthma med. 12m | IN-NO2 | 1.9 (0.10–3.50) | .05 | 2.1 (1.07–4.22) | .03 | 1.9 (0.98–0.72) | .06 | 1.9 (0.98–3.60) | .05 |
| PNL-O3 | 1.7 (0.91–3.27) | .09 | 1.8 (0.91–3.55) | .09 | 1.8 (0.93–3.51) | .08 | 2.0 (0.98–3.87) | .05 | |
Asthma-MD, diagnosis of asthma at any time; IN-NO2, indoor nitrogen dioxide; asthma med. 12m, asthma medication in the last 12m; pneumonia-MD, diagnosis of pneumonia at any time; PNL-O3, ozone indicators attached to school bags.
The diagnoses for asthma or wheezing at some time showed a significant association with the higher levels of both NO2 as well as O3, whichever the model that was evaluated (Table 2). The medical diagnosis of pneumonia was significantly associated only with the PNL-O3 models. The use of asthma medication in the previous 12 months was significantly associated with NO2 in some of the models and showed a marginal, although not significant, association with O3. Wheezing in the previous 12 months showed a trend in the same direction, but without a significant association with either of the 2 contaminants.
DiscussionThe exposure to the maximum levels of atmospheric NO2 and O3 concentrations showed a significant association with poor respiratory health and increased presence of wheezing, asthma and pneumonia in children living in a poor area. The sample of children evaluated in this study lived in an area with one of the highest traffic densities in São Paulo, with a mean daily volume of approximately 150000 motor vehicles.2 Our results demonstrated that indoor NO2 determinations and personal O3 determinations are highly sensitive for evaluating these associations in children, especially when considering that the population sample that we evaluated was small.
The concentration levels for indoor, outdoor and personal NO2 and O3 did not show any significant correlations. These results once again highlight the importance of determining these gases with different locations and methods because certain settings and individual behavior patterns may affect clinical respiratory results. One important result of this present study is that O3 determined at a personal level (but not NO2) seems to be an optimal marker for evaluation. It is interesting to point out that the PNL-NO2 concentration levels, which were determined close to the children, were significantly lower than those observed in the homes. NO2 determinations are very probably affected by exposure to tobacco smoke and/or indoor kitchen gases, and to a lesser degree by the traffic pollution that partially penetrates the home.17 The objective of this study was not to analyze the origins of air pollution. In this context, our determinations of IN-NO2 can be an indirect variable indicative of indoor origins that are not adequately characterized by personal determinations, especially in a setting like ours where children spend more time outdoors than indoors. In line with this reasoning, in homes where there were adult smokers, the correlation between indoor and outdoor settings was lower (R=0.13) than that observed in homes without smoking (R=0.47). This suggests that passive exposure to tobacco smoke and/or kitchen gas should be considered a significant factor contributing to respiratory morbidity in the population.
The O3 and NO2 levels associated with the toxic effects on respiratory health observed in this present study were lower than those measured by the instrumental air pollution monitoring network of the CETESB. This observation seems plausible, as the permanent measurement system for air pollution is situated outdoors and some stations are in the proximity of an avenue with intense traffic. Our determinations correspond with a mean of 30 days, including the time children spend indoors. Our results coincide with those of other studies that have later shown that personal monitoring devices do not show pollution concentrations similar to those from permanent outdoor devices.18
Another interesting observation of our study was the high fluctuation of the OUT-O3 concentration levels in children who lived in the same area of the city (Fig. 1). These differences were also observed in the PNL-O3 results, which suggest that these parameters are very close to the real life of individuals and are able to detect important differences in behavior patterns that have an important repercussion in respiratory health results. One possible explanation of the greater sensitivity of these personal O3 determinations is that the children are outdoors for long periods of time, especially during daylight hours when the temperatures and O3 concentrations are higher.19 Other authors have also reported higher O3 exposure levels in boys, possibly due in to the fact that they may be more active than girls and spend more time outside.20 Other studies concur with ours and suggest that the effects on health of O3 are directly related with the magnitude and duration of the exposure, and also with physical activity during the periods of greatest exposure.6–9,21 As in other studies, we have observed that children exposed to higher concentration levels of O3 and NO2 had a probability of presenting an asthma diagnosis that was almost 3 times higher, regardless of other known confounding factors.6–9 The experimental data have suggested that animals exposed to O3 during brief periods of time develop pulmonary morphological alterations that cause increased release of oxidative enzymes and collagen deposition.22 It has also been suggested that exposure to high O3 may likewise initiate an associated inflammatory cascade in the lungs.23 Another relevant observation in our study was that the high level of personal exposure to O3 showed a significant association with the medical diagnosis for pneumonia. It has been previously reported that there is a tripled increased risk for hospitalization due to flu and pneumonia in children exposed to high O3 levels.24 The effect of O3 on infection may also depend on the exposure time and duration.25 One question that is necessary to keep in mind is that the gas samples were taken in spring, which is a warm season and children often spend their time playing outdoors, which increases exposure to O3. In an extensive collaboration study on the environment, there has been a demonstrated increase in the number of hospitalizations due to pneumonia in the periods of greater O3 concentration in the air, above all during warm months.26 Previous studies have suggested the existence of a correlation between the high level of exposure to NO2 and O3 and the susceptibility to respiratory viral infections, which indicates a possible relationship with asthma crises and asthma-type symptoms.27 It has been suggested that in children between the ages of 5 and 10, the risk for respiratory disease increases 20% for every increase of 28.3μg/m3 in the inside NO2 concentration.21 Another study that was done in Brazil also demonstrated a positive correlation between NO2 and O3 levels and wheezing symptoms in adolescents.19 Higher levels of O3 and sulfur dioxide have been reported in inner China where coal was used as the main source of energy; the levels of pollution originating both indoors and outdoors that were found in the inside of homes and schools were high and a positive association was observed with wheezing.28 Considered together, these data emphasize the relevance of local emission patterns in order to properly identify the possible negative effect for a specific local community.
In a study that is somewhat similar to our researching PM, it was observed that the levels established with the individual determinations done inside the homes were more than double those obtained from permanent outdoor monitoring stations. This suggests that there is an underestimation of air pollution exposure levels when only the data from permanent outdoor measurement stations are used.29 The researchers have also described weak correlations between environmental and personal NO2 levels, even when sophisticated LUR models are applied in order to improve the exposure estimations.18
The novelty of this study lies in the fact that, with the use of simple, low-cost techniques, we are able to precisely measure the repercussions of traffic air pollution on asthma and pneumonia in children. We cannot rule out the presence of type-2 errors in the determinations that did not reach statistical significance because the sample size was rather small. One alternative explanation for the high risk for disease that we observe to be associated with these exposures may be the greater vulnerability to recurring respiratory infections in the study population. The rates for asthma (27%) and wheezing in the previous year (42%) found in these individuals are quite higher than that of a comparable group in the city of São Paulo. The ISAAC study reported an asthma prevalence of 7%, and wheezing from 25% to 30% in the previous year.16 Nevertheless, until now, no studies have evaluated how these air pollution concentration levels can influence (not just NO2 and O3, but also SO2 and PM2,5) high-risk populations in the appearance of asthma or other highly prevalent diseases like viral bronchiolitis at early stages of life. It is possible that the combination of early exposure to frequent and severe viral infections and a highly polluted environment is associated with the appearance of a form of persistent atopic asthma.30
This study has some limitations that need to be taken into account. The cross-sectional nature of the study does not enable us to analyze all the possible confounding factors. Nevertheless, as this population is treated by primary care groups that provide a longitudinal follow-up and frequent home visits, the most important variables, such as demographics and diagnoses, could be precisely evaluated, which reduces the possibility of bias. The results of the respiratory symptoms-related variables that were produced in the 12 months prior to medical diagnoses were probably a consequence of life-long exposure, while our evaluations were carried out over a limited period of time. It is reassuring that 95% of the families confirmed having lived in the same place during the entire previous year, therefore the air pollution measurements seem to be consistent with clinical data. The parents answered the questionnaires, and a careful training process of the nurses who performed the interviews has likely attenuated any possible bias effect of the interviewer.
Our results suggest that the exposure to NO2 was better evaluated with IN determinations, because PNL exposures were continuous during a 30-day period, which meant that the final concentrations were lower. A possible explanation is that the children spent longer periods of time outdoors, and the accumulative levels of the gases detected was therefore lower, despite the fact that the exposure time indoors was shorter, but with a higher exposure. In addition, the PNL-O3 seems to exactly represent the actual determination, given that its level varies greatly over the course of a day, and it is probable that the children were exposed during periods of higher air O3 concentrations.In conclusion, the present study indicates a strong association between exposure to high levels of NO2 and O3 and adverse clinical respiratory results. The place where air pollutants are determined is crucial in order to obtain a reliable evaluation of the exposure. Although the results of the present study may not be directly transferable to children living in other areas, the method used could be the basis for the design of other studies. The fact that we were able to demonstrate these effects in a relatively low number of individuals suggests that the determination of personal exposure levels to pollution may be key for identifying significant associations between the traffic air pollution and respiratory morbidity in children in different settings that until now have not been well described.
Conflict of InterestsThe authors declare having no conflict of interests.
Please cite this article as: Vieira SE, et al. Los contaminantes atmosféricos urbanos son factores de riesgo significativos para el asma y la neumonía en niños: influencia del lugar de medición de los contaminantes. Arch Bronconeumol. 2012;48:389–95.
The authors SEV and RTS participated equally in the drafting of the article and should be considered both as first authors.


www.publicationethics.org.


Archivos de Bronconeumología follows the Recommendations for the Conduct, Reporting, Editing and Publication of Scholarly Work in Medical Journals