


Chronic obstructive pulmonary disease (COPD) with eosinophilic airway inflammation represents a distinct phenotype that might respond to treatment with inhaled corticosteroids. Fractional exhaled nitric oxide (FENO) might predict eosinophilic inflammation and guide treatment option. We hypothesized that COPD patients with different baseline levels of FENO might have differentiated response to treatment with salmeterol/fluticasone (SFC) or tiotropium (TIO).
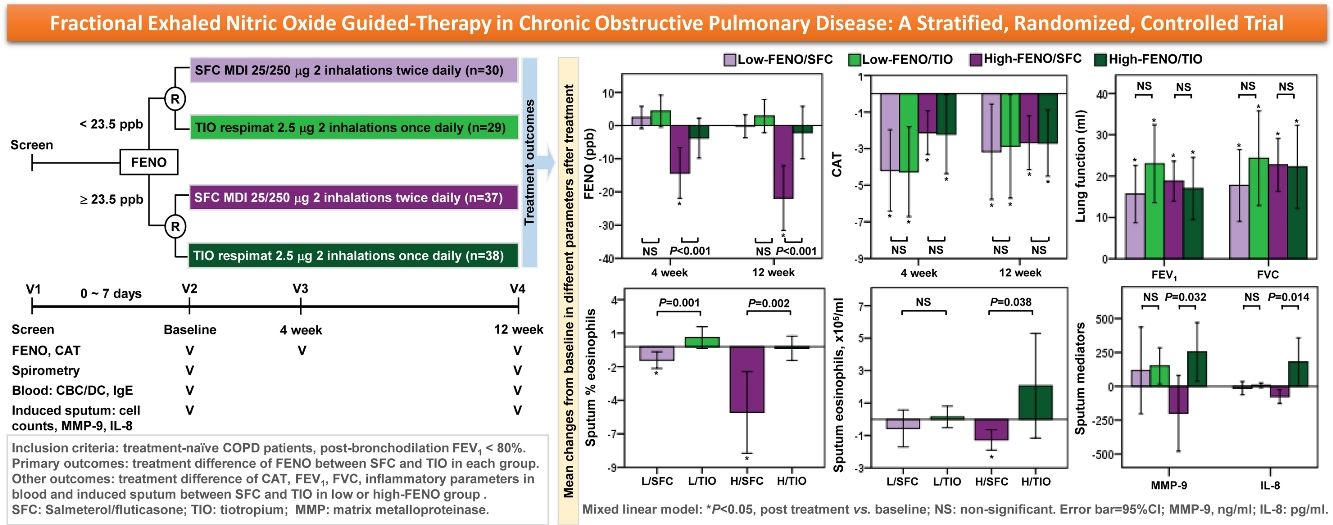
MethodsThis open-label, randomized-controlled trial enrolled treatment-naïve COPD patients who were stratified into high- (≥23.5ppb) and low-FENO group, followed by 12-week treatment with SFC or TIO. A linear mixed model with repeated measures was applied to analyze the changes in FENO (primary outcome), COPD assessment test (CAT) score, FEV1, and parameters in induced sputum and blood after treatment.
Results134 patients were divided into 4 subgroups: low-FENO/SFC (n=30), low-FENO/TIO (n=29), high-FENO/SFC (n=37), and high-FENO/TIO (n=38). At baseline, FENO 23.5ppb clearly differentiated between eosinophilic and non-eosinophilic inflammation groups based on the eosinophils in induced sputum and blood. FENO significantly correlated with sputum and blood eosinophils at baseline. High-FENO/SFC (vs. high-FENO/TIO) subgroup had significant reduction in FENO and sputum inflammation profiles (including eosinophils, macrophages, matrix metalloproteinase-9, and interlukin-8) after treatment. These differences were not replicated between low-FENO/SFC and low-FENO/TIO subgroups. The improvement in CAT and FEV1 after treatment was indiscriminate between SFC and TIO in the low- and high-FENO groups.
ConclusionHigh baseline FENO can serve as an indicator of eosinophilic airway inflammation in COPD patients who may respond favorably to treatment with inhaled corticosteroids/long-acting β2-agonists.
Trial registration numberClinicalTrials.gov Identifier: NCT02546349.
Chronic obstructive pulmonary disease (COPD) is a heterogeneous disease characterized by airway inflammation and progressive airflow limitation. The combination of inhaled corticosteroids (ICS) and long-acting β2-agonists (LABA) or inhaled long-acting muscarinic antagonists (LAMA) is widely used in COPD to improve lung function, quality of life, and to prevent acute exacerbation (AE).1 Frequent exacerbators have excessive airway inflammation and may benefit from anti-inflammatory treatment. The underlying inflammatory process in COPD is complex with increased numbers of macrophages, neutrophils, eosinophils, CD8+ lymphocytes and elevated concentrations of various cytokines such as interleukin (IL)-6, IL-8, tumor necrosis factor-α, and matrix-metalloproteinase-9 (MMP-9), coming into play.2 Treatment with salmeterol/fluticasone combination (SFC) has been shown to reduce the numbers of macrophages, neutrophils, eosinophils and CD8+ T lymphocytes in bronchial biopsy tissues and in induced sputum from COPD patients.3,4 In contrast, treatment with tiotropium (TIO) failed to reduce sputum IL-6, IL-8 and myeloperoxidase, but has been shown to reduce exacerbation frequency.5 We had previously reported that treatment with SFC (vs. TIO) for 12 weeks resulted in a greater reduction in sputum MMP-9 and IL-8, but no differences in lung function and quality of life in patients with COPD.6
There is a substantial proportion of COPD cases associated with eosinophilic airway inflammation.7–9 Blood eosinophil counts have been proposed as a biomarker responding to ICS in COPD. However, sputum eosinophilia may be a more reliable biomarker of responsiveness to ICS10 and a predictor for future exacerbation after cessation of ICS.11 Sputum induction is a time-consuming (hours) and labor-intensive method for identifying eosinophilic airway inflammation. In contrast, the measurement of fractional exhaled nitric oxide (FENO) using a hand-held analyzer is rapid and simple. The FENO level significantly correlates with eosinophilic airway inflammation,12 and it is considered a useful biomarker to guide treatment in asthma.13,14 For COPD, Papi et al.15 reported that patients with partial reversibility of airflow limitation had higher levels of FENO and sputum eosinophils. A randomized, controlled trial by Siva et al.10 showed that aggressive treatment for COPD patients designed to minimize sputum eosinophilia may decrease the frequency of hospital admissions and severe exacerbation.
Eosinophilic airway inflammation is associated with an increased risk of AE in COPD patients.16 Recently, Bernardino et al.17 reported that peripheral blood eosinophils were associated the production of FENO in stable COPD patients, and ≥3% eosinophils could identify eosinophilic COPD patients, who had a mean FENO of 24.2 parts per billion (ppb). Likewise, we previously reported that there is a significant correlation between FENO levels and sputum eosinophils observed in treatment-naïve COPD patients, who were current or ex-smokers.8 In addition, FENO at the cutoff of 23.5ppb may be predictive of sputum eosinophilia with optimal accuracy. Thus, we hypothesized that COPD patients with different baseline levels of FENO may have differentiated response to treatment with ICS/LABA or LAMA. We compared the post-treatment changes in FENO in the ICS/LABA and LAMA subgroups as the primary outcome in treatment-naïve patients who were categorized into low- and high-FENO (< or ≥23.5ppb) groups. The improvement of COPD assessment test (CAT) score, lung function, and inflammatory parameters in blood and induced sputum in each group were analyzed.
MethodsStudy designThis parallel, open-label, 12-week, randomized controlled trial (RCT) was conducted with a stratified design based on a pre-specified FENO level in a single medical center. This study was approved by the Institutional Review Board of Taipei Veterans General Hospital (ID: 2014-06-005B). A written informed consent was obtained from all participants. The study algorithm is shown in Fig. 1. Eligible patients were stratified into low-FENO (<23.5ppb) and high-FENO (≥23.5ppb) groups, followed by randomization into treatment with 2 inhalations of SFC Evohaler (25/250μg, GlaxoSmithKline, Liverpool, UK) twice daily or 2 inhalations of TIO Respimat (2.5μg, Boehringer Ingelheim, Berlin, Germany) once daily. The inhalation technique of individuals was well-trained and checked to master the respective inhaler in each visit. Randomization in the low- and high-FENO groups was performed separately. In each group, the randomization list was generated by a computer with a 1:1 allocation using a random block size of 4 by an independent researcher. The allocation sequence was concealed from the investigator enrolling the patients until interventions were assigned. The primary outcome was to compare the changes from baseline between the treatments with SFC and TIO on FENO after 4 and 12 weeks of treatment. The other objectives included determining the treatment difference (post- minus pre-treatment) and comparing the changes from baseline between the treatments with SFC and TIO on CAT, lung function, parameters in induced sputum and peripheral blood as indicated in Fig. 1, as well as AE events during treatment period. FENO and lung function were measured in accordance with the American Thoracic Society/European Respiratory Society standards (see Appendix).18,19 The definitions of COPD and AE were based on the 2017 GOLD recommendation.1 Moderate AE was characterized by the requirement of treatment with oral steroids and/or antibiotics, while severe AE was characterized by a visit to the emergency department or hospitalization. The sputum induction, processing and the measurement of mediators (IL-8, MMP-9) were described elsewhere (Appendix).6,7

The study algorithm. CAT: COPD assessment test; CBC: complete blood count; DC: differential count; FENO: fractional exhaled nitric oxide; IgE: immunoglobulin E; IL: interleukin; MDI: metered dose inhaler; MMP: matrix metalloproteinase; R: randomization; SFC: salmeterol/fluticasone; TIO: tiotropium.
Symptomatic (meeting the initial presentations of dyspnea, or chronic cough, or sputum production, or a combination thereof) and treatment-naïve COPD patients were enrolled from outpatient clinics in the national medical center (Taipei Veterans General Hospital) between October 17, 2014 and February 6, 2020. Patients were eligible for the study if they met all the following criteria: newly diagnosed or previously diagnosed COPD patients (indicated by post-bronchodilation ratio of forced expiratory volume in the first second [FEV1] over forced vital capacity [FVC]<0.7) without any treatment for at least 3 months before enrollment, aged between 40 and 90 years, current or ex-smokers with smoking intensity≥20 pack-years, and post-bronchodilation FEV1≤80% of the predicted value. Patients were excluded if they had any one of the following conditions: active allergic rhinitis; currently or previously physician-diagnosed asthma; clinically overt bronchiectasis, lung cancer, active tuberculosis, or other known specific pulmonary disease; uncontrolled underlying disease or abnormalities that could interfere with the study; alcohol or medication abuse; upper or lower respiratory tract infections 4 weeks before enrollment; exacerbation with the use of systemic steroids or antibiotics 4 weeks before enrollment; or unable or unwilling to comply with all the study protocol.
Statistical analysisThe sample size calculation, using a power of 0.80 and a type I error of 0.05, was performed with the G-power 3.1 software (Franz Faul, University Kiel, Germany). Based on previous reports20–24 and preliminary data from our previous study,8 we assumed that the treatment differences between SFP and TIO were 6 and 4 in the high- and low-FENO groups, respectively. The estimated sample size was 33 in each high-FENO subgroup and 24 in each low-FENO subgroup (see Appendix for details). Given a drop-out rate of 10%, the required sample size was finalized as 37 and 27 for each high- and low-FENO subgroup, respectively.
Statistical analysis was performed using SPSS Statistics for Windows, Version 20.0 (IBM Corp., Armonk, NY, USA). Body mass index and lung function at baseline passed the test of normality. Data are presented as mean±SD or mean (95% conference interval) or median (interquartile) for continuous variables, and numbers (percentage) for categorical variables, as appropriate. Comparisons between continuous variables were performed using the Student's t-test or Mann–Whitney U test; the Chi-square test was used for categorical variables. The association between two continuous variables was assessed using the Spearman's rank correlation test. As to treatment outcomes, tests for repeated measures using the linear mixed models were applied to analyze treatment changes from baseline at 4 (FENO and CAT) and 12 (all parameters) weeks (Fig. 1). Additionally, time, treatment (SFC or TIO), and the interaction between time and treatment served as fixed effects. Whenever AE occurred, individual episodes of AE had to be separated by a gap of at least 7 days. A two-sided P value<.05 was considered significant.
ResultsBaseline characteristicsA total of 134 consecutive patients were enrolled, including 59 and 75 patients in the low- and high-FENO groups, respectively. The flow chart of patient enrollment is illustrated in Fig. 2, and the demographic details are shown in Table 1. The baseline characteristics across the 4 subgroups were similar except for significantly higher FENO, percentage of eosinophils in sputum and blood in the 2 high-FENO subgroups, as compared with the 2 low-FENO subgroups (Table 1). The total sputum and blood eosinophils tended to increase in the 2 high-FENO subgroups (vs. the 2 low-FENO subgroups). The proportion of current smokers was significantly higher in low FENO subgroups than in high FENO subgroups. If the patients were simply categorized into low- and high-FENO groups, those in the high-FENO group had significantly higher FENO, eosinophil percentage and total eosinophils in sputum and blood, respectively (vs. the low-FENO group, see Table S1 in Appendix).

Baseline characteristics of study patients.
| Total | Low FENO | High FENO | P value* | |||
|---|---|---|---|---|---|---|
| SFC | TIO | SFC | TIO | |||
| Numbers | 134 | 30 | 29 | 37 | 38 | |
| Age, years | 70 (62–80) | 66 (62–76) | 63 (59–80) | 72 (64–85) | 73 (66–81) | .069 |
| Male, N (%) | 125 (93) | 27 (90) | 27 (93) | 34(92) | 37 (97) | .649b |
| BMI | 24.8±4.3 | 25±4.4 | 24.8±4.9 | 25.2±4.3 | 24.4±4 | .731 |
| Current smoker, N (%) | 45 (34)) | 15 (50) | 13 (45)‡‡ | 6 (16) | 11 (29)‡‡ | .014b |
| Smoking pack-years | 40 (21–53) | 40 (27–50) | 45 (30–56) | 43 (20–57) | 35 (20–50) | .754 |
| FENO, ppb | 27 (15–38) | 14 (11–17) | 15 (11–18) | 37 (30–53)†,‡ | 35 (30–46)†,‡ | <.001 |
| CAT | 6 (3–10) | 7 (4–11) | 5 (4–10) | 4 (2–9) | 7 (4–9) | .17 |
| Blood parameters | ||||||
| Total WBC, /μl | 7100 (6000–8600) | 7350 (6300–9000) | 7400 (6500–8800) | 7100 (6100–8000) | 6900 (5310–8400) | .355 |
| % Eosinophils | 2.1 (1.2–3.5) | 2 (0.9–2.3) | 1.5 (0.9–2.3) | 2.7 (1.4–4.1)†,‡ | 2.4 (1.6–3.7)†,‡ | .007 |
| Total eosinophils, /μl | 147 (83–237) | 128 (68–202) | 117 (59–189) | 182 (99–346)‡ | 161 (120–222) | .048 |
| Atopy,cN (%) | 44 (33) | 10 (33) | 11 (38) | 13 (35) | 10 (26) | .761b |
| Total IgE, IU/ml | 87 (35–225) | 75 (14–228) | 66 (38–151) | 79 (23–232) | 120 (61–204) | .178 |
| Post-bronchodilation spirometry | ||||||
| FEV1, L | 1.56±0.46 | 1.56±0.49 | 1.7±0.47 | 1.53±0.45 | 1.49±0.42 | .321 |
| Predicted FEV1, % | 66±13 | 66±15 | 69±11 | 66±12 | 63±12 | .185 |
| FVC, L | 2.57±0.69 | 2.58±0.73 | 2.75±0.72 | 2.51±0.7 | 2.47±0.61 | .423 |
| Predicted FVC, % | 79±14 | 81±19 | 82±12 | 78±13 | 76±13 | .352 |
| FEV1/FVC, % | 61±9 | 60±10 | 62±9 | 61±9 | 60±8 | .746 |
| Bronchoreversibility | ||||||
| ΔFEV1, ml | 63±81 | 59±76 | 82±129 | 56±54 | 57±60 | .786 |
| % FEV1 change | 4±6 | 4±5 | 5±8 | 3±3 | 4±6 | .676 |
| Positive BR,dN (%) | 18 (13) | 4 (13) | 5 (17) | 5 (14) | 4 (11) | .888b |
| Induced sputum parameters | ||||||
| Numbers with sputum | 99 | 22 | 22 | 27 | 28 | |
| % Macrophages | 12.1 (6.3–19) | 17.2 (10.8–22) | 12.5 (8.8–16) | 11.7 (6–19.6) | 4.7 (1.9–16.6)† | .005 |
| % Neutrophils | 81.9 (73–89.4) | 78 (75.8–85) | 85.1 (78.4–89) | 76.7 (69–89.6) | 85 (73.9–93.2) | .222 |
| % Eosinophils | 2.7 (1.4–5.1) | 1.4 (0.9–4.7) | 2 (0.5–2.6) | 4.6 (2.3–7.2)†,‡ | 4.2 (2–8.8)†,‡ | <.001 |
| Macrophages, ×105/mla | 3.6 (1.6–7.1) | 4.9 (1.8–9.2) | 5.3 (2.1–9.6) | 3.3 (1.5–5.9) | 2.1 (1.3–5.5) | .090 |
| Neutrophils, ×105/mla | 25 (12.2–70) | 21 (13.9–65.7) | 34.3 (13.7–81) | 16.7 (6.8–37) | 37.4 (14.5–74) | .190 |
| Eosinophils, ×105/mla | 1 (0.1–2) | 0.3 (0.2–0.8) | 0.7 (0.2–1) | 0.9 (0.6–2)† | 1.6 (0.8–5.7)†,‡ | .001 |
| MMP-9, ng/mla | 55 (20–224) | 35 (9–111) | 51 (23–146) | 40 (20–224) | 163 (52–362) | .091 |
| IL-8, pg/mla | 134 (100–171) | 133 (114–161) | 128 (107–149) | 106 (82–166) | 139 (110–233) | .258 |
BMI: body mass index; BR: bronchoreversibility; CAT: COPD assessment test; FENO: fraction exhaled nitric oxide; FEV1: forced expiratory volume in first second; FVC: forced vital capacity; GOLD: global initiative for chronic obstructive lung disease; IgE: immunoglobulin E; IL-8: interleukin-8; MMP: Matrix metalloproteinase; SFC: salmeterol/fluticasone combination; TIO: tiotropium; WBC: white blood cell.
Data are presented as N (%) for categorical variables, or median (interquartile range) for non-parametric variables, or mean±SD for parametric variables.
In terms of the primary outcome, the high-FENO/SFC subgroup had a significant reduction in FENO at 4 weeks and 12 weeks, as compared to that observed in the high-FENO/TIO subgroup. However, this difference was not replicated between the low-FENO/SFC and low-FENO/TIO subgroups. Moreover, changes from the baseline FENO level exhibited a significant reduction only in the high-FENO/SFC subgroup (Fig. 3A). As to CAT score, FEV1 and FVC, changes from the baselines were significantly improved in the 4 subgroups. However, there were no treatment differences between SFC and TIO in the low- and high-FENO groups (Fig. 3B and C). For inflammation profiles in induced sputum, the high-FENO/SFC subgroup had a significant reduction in sputum eosinophils, macrophages, MMP-9, and IL-8 levels, as compared to those in the high-FENO/TIO subgroup. However, these differences were absent between the low-FENO/SFC and low-FENO/TIO subgroups (except for the larger reduction in % sputum eosinophils in low-FENO/SFC subgroup). Additionally, changes from the baseline level of sputum eosinophils exhibited a significant reduction only in the high-FENO/SFC subgroup (Table 2). As to blood eosinophils and IgE, there were no treatment changes from the baseline in the 4 subgroups and no differences between SFC and TIO in the high- and low-FENO groups (Table 2).
 of FENO (A) and CAT score (B) at 4 weeks and 12 weeks, as well as lung function (C) at 12 weeks. The error-bar chart indicates mean and 95% confidence interval. *P<.05, **P<.01, ***P<.001, linear mixed model for comparisons within individual subgroups (post-treatment vs. baseline) and between-drug subgroups (Low-FENO/SFC vs. Low-FENO/TIO or High-FENO/SFC vs. High-FENO/TIO) at the indicated times.")
Comparisons of changes from baseline (post-minus pre-treatment) of FENO (A) and CAT score (B) at 4 weeks and 12 weeks, as well as lung function (C) at 12 weeks. The error-bar chart indicates mean and 95% confidence interval. *P<.05, **P<.01, ***P<.001, linear mixed model for comparisons within individual subgroups (post-treatment vs. baseline) and between-drug subgroups (Low-FENO/SFC vs. Low-FENO/TIO or High-FENO/SFC vs. High-FENO/TIO) at the indicated times.
Comparative efficacy between SFC and TIO in low- or high-FENO groups.
| Low FENO | P value* | High FENO | P value* | |||
|---|---|---|---|---|---|---|
| SFC | TIO | SFC | TIO | |||
| Changes of blood parameters form baseline | ||||||
| Total WBC, /ml | 25 (−802, 851) | −682 (−1630, 265) | .207 | −197 (−607, 213) | −89 (−660, 482) | .805 |
| % Eosinophils | 0.2 (−0.3, 0.7) | 0.7 (−0.2, 1.6) | .206 | −0.5 (−1.3, 0.4) | −0.3 (−0.9, 0.2) | .829 |
| Total eosinophils,/ml | 13 (−26, 51) | 49 (−17, 115) | .23 | −39 (−106, 29) | −23 (−69, 23) | .817 |
| Total IgE, IU/ml | −29 (−110, 51) | 24 (−57, 106) | .3 | 22 (−37, 81) | −40 (−82, 1) | .081 |
| Changes of induced sputum parameters from baseline | ||||||
| % Macrophages | −7.9 (−14.5, −1.2) | −0.5 (−4.9, 3.8) | .062 | 3.8 (−0.8, 8.5) | 2.8 (0, 5.6) | .527 |
| % Neutrophils | 1.8 (−11.3, 14.9) | −0.3 (−4.7, 4.1) | .754 | 0.6 (−5.4, 6.7) | −3.9 (−7.9, 0.1) | .278 |
| % Eosinophils | −1 (−1.6, −0.4)† | 0.7 (−0.1, 1.5) | .001 | −4.9 (−7.9, −1.9)† | −0.1 (−1, 0.8) | .002 |
| Macrophages, ×105/mla | −3 (−16.4, 10.4) | −0.8 (−5.1, 3.4) | .735 | −3.6 (−6.4, −0.8) | 3.9 (0, 7.9) | .003 |
| Neutrophils, ×105/mla | 23.5 (−14.5, 61.5) | −21.8 (−55.5, 12) | .073 | −41.8 (−80.1, −4) | 16.1 (−27.4, 59.6) | .083 |
| Eosinophils, ×105/mla | −0.6 (−1.7, 0.6) | 0.1 (−0.5, 0.8) | .18 | −1.3 (−1.9, −0.6)† | 2.1 (−1.2, 5.3) | .038 |
| MMP-9, ng/mla | 116 (−204, 436) | 151 (17, 284) | .859 | −199 (−480, 81) | 254 (37, 470) | .032 |
| IL-8, pg/mla | −14 (−63, 35) | 8 (−10, 25) | .321 | −76 (−127, −24) | 180 (3, 357) | .014 |
| Moderate to severe AE during study period | ||||||
| Patients with ≥1 AE event, N (%) | 3 (10) | 1 (3.4) | .612b | 1 (2.7) | 6 (15.8) | .108b |
AE: acute exacerbation. Refer to Table 1 for other abbreviations.
Data are presented as mean (95% conference interval).
At baseline, as compared to patients without a history of any moderate-to-severe AE 1 year before enrollment, those with AE history were older and had greater airway inflammation status, including higher FENO, sputum eosinophils, neutrophils, IL-8, and MMP-9 levels. However, no difference was found in CAT score, FEV1, FVC, and blood eosinophils (Table 3). The occurrence of AE events during the study period is documented in Table 2 (see Appendix for more information).
Baseline characteristics in patients with or without acute moderate to severe exacerbation 1 year prior to enrollment.
| AE (−) | AE (+) | P value* | |
|---|---|---|---|
| Patient numbers | 115 | 19 | |
| AE numbers | 0 | 1 (1–2) | |
| Age, years | 69 (61–78) | 80 (64–85) | .03 |
| BMI | 25±4.3 | 24±4.7 | .461 |
| FENO, ppb | 24 (15–35) | 38 (27–56) | .002 |
| CAT | 6 (4–10) | 6 (2–9) | .554 |
| Blood test parameters | |||
| Total WBC, /μl | 7100 (5900–8600) | 7100 (6200–9300) | .648 |
| % Eosinophils | 2 (1–3.1) | 2.4 (1.5–3.9) | .201 |
| Total eosinophils, /μl | 145 (76–222) | 180 (110–346) | .166 |
| Total IgE, IU/ml | 90 (34–225) | 78 (50–232) | .972 |
| Post-bronchodilation spirometry | |||
| FEV1, L | 1.58±0.47 | 1.46±0.37 | .26 |
| Predicted FEV1, % | 65±13 | 69±12 | .148 |
| FVC, L | 2.6±0.71 | 2.37±0.49 | .191 |
| Predicted FVC, % | 79±15 | 80±11 | .38 |
| % FEV1 change | 4±6 | 2±4 | .76 |
| % FVC change | 6±7 | 5±6 | .222 |
| Induced sputum parameters | |||
| Numbers with sputum | 84 | 15 | |
| % Macrophages | 13 (7.6–19.5) | 4.6 (1.9–10.1) | .001 |
| % Neutrophils | 81.7 (72.4–88.6) | 85.5 (80.7–90.1) | .122 |
| % Eosinophils | 2.4 (1.3–5) | 4 (2.7–13.7) | .043 |
| Macrophages, ×105/mla | 3.7 (1.8–7.4) | 1.5 (1–5) | .099 |
| Neutrophils, ×105/mla | 21 (11.4–60.1) | 67.4 (26.5–84.6) | .046 |
| Eosinophils, ×105/mla | 0.8 (0.3–1.4) | 4.1 (1.4–6.7) | .002 |
| MMP-9, ng/mla | 186 (114–354) | 307 (181–624) | .02 |
| IL-8, pg/mla | 48 (17–187) | 207 (51–556) | .021 |
AE: acute exacerbation (at least one moderate to severe exacerbation). Refer to Table 1 for other abbreviations.
Data are presented with median (interquartile range) for non-parametric variables or mean±SD for parametric variables.
For all patients at baseline, the FENO level correlated significantly with sputum and blood eosinophils (Fig. 4A and B). The relationship between sputum and blood eosinophils was also significant (Fig. 4C and D). The FENO level had no correlations with CAT, FEV1, FVC, sputum MMP-9, and IL-8 (any P>.05). The levels of MMP-9 and IL-8 significantly correlated with the sputum neutrophils (Fig. 4E and F).
Correlations of treatment changes
For all patients, the reduction in FENO significantly correlated with the decrease in sputum eosinophils after treatment (Fig. 5A). The changes in blood eosinophils did not correlate with the changes in FENO or sputum eosinophils (both P>.05). The changes in MMP-9, IL-8 and sputum neutrophils had significant positive correlations (Fig. 5B–D). The suppression of the eosinophilic airway inflammation markers (FENO and sputum eosinophils) did not correlate with the improvement in FEV1, FVC and CAT score (any P>.05).
Discussion
This stratified RCT demonstrates the use of baseline FENO as a guide for management of COPD. The major results showed that treatment-naïve COPD patients with high baseline FENO levels (≥23.5ppb) could benefit from SFC rather than TIO, in terms of greater reduction in FENO and airway inflammation profiles (including total sputum macrophages and eosinophils, sputum MMP-9 and IL-8 levels). However, these differences were not replicated in the low-FENO group. CAT, FEV1, and FVC failed to show treatment differences between the 2 active treatment agents (SFC and TIO) without consideration of airway inflammation patterns. Therefore, FENO appears to be a good biomarker to guide treatment option in a simple and non-invasive way.
Unlike asthma, only a few small, single-arm20,25,26 or placebo-controlled21 studies investigated the ICS responsiveness on FENO and its association with FEV1 in stable COPD patients to date. These studies showed that those with high baseline FENO (26.2–46.5ppb) consistently exhibited effects on the reduction of FENO after a short-term (2–12 weeks) treatment with ICS or ICS/LABA20,21,25,26; however, the results applying baseline FENO level or post-treatment changes of FENO to predict FEV1 responsiveness were conflicting. The discrepancy may be ascribed to the patients’ heterogeneity, such as baseline characteristics, treatment medication, and the different cut-off value of FENO. These cut-off values largely varied because they were retrospectively determined and not prospectively validated. By contrast, we previously reported that the FENO level (23.5ppb) was able to differentiate between eosinophilic and non-eosinophilic groups based on induced sputum in a retrospective study,8 and which is prospectively validated currently. Furthermore, we demonstrated that those with FENO≥23.5ppb benefited from SFC through reduction in airway inflammation. Meanwhile, the conventional outcomes, such as CAT score and FEV1 was of no difference. Similarly, Y.K. Wu et al. conducted a FENO (25ppb)-stratified observational study in stable COPD patients treated with various ICS/LABA or LAMA for 12 weeks.27 They also reported that the high-FENO ICS/LABA subgroup had the most reduction of FENO across the 4 subgroups. The reduction of FENO linked to improvement in CAT score, but not in FEV1. Taken together, baseline high FENO can serve as an indicator for ICS responsiveness in FENO reduction. However, the association between FENO reduction and clinical important outcomes, such as FEV1, or patient-reported outcomes, or AE events, needs large-scale studies to validate.
Interestingly, our data showed that in the low-FENO subgroups, the reduction of FENO was insignificant between SFC and TIO, which was identical to the report by Y.K. Wu et al.27 The median FENO in our low-FENO COPD patients is 14ppb, which is much lower than the mean FENO (27.9ppb) in normal adult population in Taiwan.28 Moreover, it was reported that FENO is reduced by smoking in COPD subjects who are current smokers,29 which is consistent with our findings that the proportion of current smokers was significantly higher in the low-FENO group than in the high-FENO group. Therefore, the effect of SFC on FENO reduction in low baseline FENO patients is difficult to be observed. However, the reduction of % sputum eosinophils was more prominent in the low-FENO/SFC subgroup than in the low-FENO/TIO subgroup. This observation suggests that in the low-FENO group, SFC, as compared to TIO, might have some anti-inflammatory effect, but it is beyond the scope of FENO reaction. Moreover, previous studies also showed that ICS responsiveness of FENO reduction in COPD patients with lower baseline FENO totally failed to reflect the improvement of FEV1,20,25–27 and CAT.26,27 Thus, applying FENO to reflect treatment outcomes in low baseline FENO COPD patients seems inadequate.
The variable anti-inflammatory effects of SFC have been reported in several studies. Bourbeau et al.3 reported that although treatment with SFC significantly reduced CD8+ T-cells and CD68+ macrophages in bronchial biopsy tissues compared with placebo, the neutrophil and eosinophil counts were not affected. In contrast, the same dose of SFC with a similar treatment duration (12–13 weeks) significantly reduced neutrophils, eosinophils, and CD8+ T-cells in biopsies in a study by Barnes et al.4 This study demonstrated the benefits of treatment with SFC in high-FENO COPD patients, including greater reductions in total sputum eosinophils, macrophages, MMP-9, IL-8, and FENO, as compared to those observed in patients treated with TIO.
The sputum neutrophil counts, MMP-9, and IL-8 are elevated in COPD patients.6 Particularly, IL-8, a chemoattractant for neutrophils and eosinophils,30 may further increase during exacerbation.2 The increase in MMP-9 has been found released from both neutrophils and alveolar macrophages in the airways of COPD patients.31 The levels of MMP-9 were associated with emphysema formation32 and lung remodeling.33 In this study, sputum neutrophil counts were positively correlated with IL-8 and MMP-9 levels. Patients with AE history had significantly higher levels of FENO, IL-8, MMP-9 and total sputum neutrophils and eosinophils than those in patients without AE. The reductions in the total sputum eosinophils, macrophages and inflammatory mediators observed in this study may explain the higher frequencies of exacerbations requiring oral corticosteroids in patients being treated with TIO, as reported in the INSPIRE study.34 The anti-inflammatory effects of SFC may contribute to the clinical benefits of AE reduction in COPD patients who experience frequent exacerbations.
Exacerbations are linked to excessive airway inflammation. In addition to neutrophils, eosinophils may play an important role in the exacerbations of COPD. Exacerbated COPD patients had elevated FENO and sputum and blood eosinophils, and these were associated with corticosteroid responsiveness.35,36 A recent meta-analysis revealed that blood eosinophil count is a marker of ICS effectiveness in preventing COPD exacerbation. The reduction in exacerbation rate varied with a range of blood eosinophil thresholds.37 Suissa et al.38 reported that an initial COPD treatment with ICS/LABA resulted in fewer moderate-to-severe exacerbations than treatment with LAMA alone in patients with high blood eosinophils (>4% or >300/μL) in a population-based cohort. Pavord et al.39 performed a retrospective analysis and showed that baseline blood eosinophil levels≥2% were associated with a greater reduction in exacerbations in COPD patients with a history of moderate-to-severe exacerbations undergoing ICS/LABA therapy. Similarly, our data showed that COPD patients with high FENO had more reduction in airway inflammation profiles when treated with ICS/LABA than when treated with LAMA. This finding supports the missing piece in past observations of a link between reduction of airway inflammation by ICS/LABA and fewer exacerbations. Additionally, the reduction in FENO significantly correlated with a decrease in sputum eosinophils, but not with blood eosinophils. FENO could be a marker for monitoring anti-inflammatory response in COPD with eosinophilic inflammation.
A recent, large cohort of patients with varying COPD severities suggested that a high sputum eosinophil level was a better biomarker than a high blood eosinophil level for identifying patient subgroups with more severe disease and frequent exacerbations.40 In addition, the increased sputum eosinophil counts were related to an improvement in post-bronchodilation FEV1 following treatment with ICS in COPD.41 In this study, FENO levels showed a significant association with sputum eosinophils. As sputum induction is a complex procedure, FENO measurement could be an alternative and simple approach for identifying eosinophilic COPD patients.
The strength of this study is that we enrolled treatment-naïve patients and excluded patients with asthma to minimize factors which might interfere with FENO and other airway inflammation parameters. This study also has limitations. The sample size was relatively small and this study was conducted in a single institute. Most study subjects were less symptomatic (low average CAT score). The drop-out rate (14.2%) was slightly higher than we presumed (10%). Hence this study may be potentially underpowered. The treatment duration was short and needs further validation. A large-scale and long-term study is required to validate the treatment outcomes.
ConclusionFENO can differentiate between eosinophilic from non-eosinophilic COPD in treatment-naïve patients. The reduction in FENO is associated with a decrease in sputum eosinophils after treatment. COPD patients with high baseline FENO treated with ICS/LABA, compared with those treated with LAMA, can result in significant reduction of FENO, which links to more reduction in sputum inflammation profiles. High baseline FENO may serve as an indicator of eosinophilic airway inflammation in COPD patients who may have favorable responsiveness to treatment with ICS/LABA.
Authors’ contributionsConception and design: DWP and KCS; Acquisition, analysis, or interpretation of data: HKK, KTC, YHH, YWC, WKY, SWP, and JYF; Drafting of the manuscript: KS and HKK; Critical revision of the manuscript for important intellectual content: DWP.
FundingThis work was supported by GlaxoSmithKline (GSK). The funder had no role in study design, data collection and analysis, decision to publish, or preparation of the manuscript.
Conflict of interestsAll authors declare that they have no conflict of interests.
The authors thank all the study participants. We are grateful to Dr. Shang-Liang Wu, a statistical modeling consultant, from the School of Medicine, Griffith University, Gold Coast, Australia for his assistance in the statistical analysis.
The following are the supplementary data to this article:


