


Chronic obstructive pulmonary disease (COPD) is a dynamic disease with a high socioeconomic burden. Using data collected prospectively from the general population, we examined factors related to the transition of at-risk individuals to COPD.
MethodsWe used the Korean Genome Epidemiology Study (KoGES) database, defining pre-COPD based on respiratory symptoms and radiological abnormalities suggestive of COPD; the preserved ratio impaired spirometry (PRISm) was defined as a forced expiratory volume in 1s (FEV1)/forced vital capacity ratio≥70% and FEV1<80%, as predicted by spirometry. We determined group differences in the rate of lung function decline, risk of future airflow obstruction (AFO).
ResultsThe study included 4762 individuals, and longitudinal analysis revealed distinct trends in pulmonary function indicators. Compared to the normal group, the pre-COPD group showed a more rapid decline in lung function, while the PRISm group showed a slower decline. In the pre-COPD and PRISm groups, 4.4% and 3.5%, and 13.6% and 10.8%, respectively, of patients had progressed to COPD at the first and second visits. Pre-COPD and PRISm contributed to an earlier time to first AFO, but consideration of comorbid cardiovascular disease weakened this relationship in the PRISm group. Multivariate logistic regression showed that pre-COPD and PRISm are significant risk factors for future development of COPD (OR 1.80, p<0.001; OR 4.26, p<0.001, respectively).
ConclusionPre-COPD and PRISm patients showed different trends in lung function changes over time and both were significant risk factors for future development of COPD.

Chronic obstructive pulmonary disease (COPD) is a progressive disease characterized by persistent airflow limitation and chronic respiratory symptoms. As a chronic disease, COPD interventions aim to reduce the risk of acute exacerbation and relieve symptoms in overt, advanced disease. Cigarette smoke inhalation is the main risk factor for developing COPD; other factors include poor lung growth and subsequently low maximal forced expiratory volume in 1s (FEV1), biomass exposure, and air pollution, especially in those who are at risk. Several recent studies have focused on patients with early disease; those with symptoms or physiological or radiological abnormalities are more likely to progress to COPD. To aid early identification and preventive measures, the Global Initiative for COPD (GOLD) suggested several definitions of early COPD.1,2 COPD is recognized as a condition that progresses from upstream to downstream, and attention has focused on elucidating prodromal conditions preceding disease progression.
Preserved ratio impaired spirometry (PRISm) is defined as a FEV1<80% of the predicted value without airflow limitation, i.e., with a normal FEV1/forced vital capacity (FVC) ratio.3 This was previously defined as restrictive pulmonary function,4,5 GOLD-unclassifiable,6 or even nonspecific findings.7,8 PRISm is associated with more severe respiratory symptoms4,5,9 and a higher risk of all-cause and respiratory mortality.9–13 It is regarded as a transitional state, either progressing to overt airflow obstruction (AFO) or reverting to normal spirometry in longitudinal studies6,10 in a significant proportion of individuals.14
Studies have found associations between respiratory symptoms, such as chronic mucus production,15–17 and abnormalities on chest images.18 The concept of pre-COPD encompasses not only symptoms but also structural abnormalities compatible with those found in COPD (e.g., emphysema). Formerly referred to as GOLD 0, the most recent GOLD document labeled these symptoms and abnormalities pre-COPD.2 Although it is associated with a higher risk of developing COPD, pre-COPD can transition to other airway disease statuses, including normal spirometry.19,20
While these airway diseases are acknowledged as precursors to COPD, not all patients progress to COPD. Indeed, many patients transition to normal lung function, as alluded to above. We examined the outcomes of individuals at risk of developing COPD by analyzing data collected prospectively from the general population. This well-constructed longitudinal cohort enables us to identify lung function trends over time and factors related to the development of airflow limitation.
MethodsStudy population and eligibility criteriaWe used data from a longitudinal, population-based observational cohort study (the rural Ansung and urban Ansan cohort) that was a part of the Korean Genome Epidemiology Study (KoGES). This project recruited individuals from the general population aged 40–69 years to assess the incidence and risk factors of various chronic disorders. The initial baseline survey ran from 2001 to 2002, and subjects were followed biannually until 2014. At each visit, data on lifestyle characteristics, medical history, subjective symptoms, and disease incidence were collected. Methodological information was published previously.21
We included only participants who underwent spirometry at the baseline survey and attended at least two follow-up visits. Moreover, the participants had to have completed a questionnaire on respiratory symptoms, and radiological data used to define pre-COPD had to be available.
Clinical variablesAt the baseline assessment, demographic and socioeconomic data were obtained, including age, sex, body mass index (BMI), smoking history and pack-years, biomass exposure, residence (urban vs. rural), education level, and income. Anthropometric parameters (height and weight) were measured. A systematic questionnaire was used to assess medical history at the baseline visit, including symptoms (chronic bronchitis symptom and modified Medical Research Council [mMRC] dyspnea score), quality of life (EQ-5D-5L), and comorbidities (hypertension, diabetes mellitus, coronary artery disease [CAD], congestive heart failure [CHF], dyslipidemia, kidney disease, cerebrovascular disease, arthritis, thyroid disease, and metabolic syndrome).
Lung function measurementsPulmonary function tests were performed by a skilled technician using a standard spirometer (Vmax-2130; Sensor Medics, Yorba Linda, CA, USA). Calibration and quality control were performed regularly based on guidelines.22 Pre-bronchodilator values of FEV1 and FVC (in liters and percentage of the predicted value, respectively), the FEV1/FVC ratio, and forced expiratory flow between 25% and 75% of vital capacity (FEF25–75) were obtained.
Radiologic findingsRadiologic findings from chest X-rays were collected from radiologists. Patients who were reported to have emphysema, interstitial lung abnormalities, hyperinflation, or bronchiectasis at least once were considered to possess these features.
Definition of airway diseaseAirway disease is classified into distinct respiratory disorders. COPD is defined by a pre-bronchodilator FEV1/FVC ratio<0.7. PRISm is defined as a pre-bronchodilator FEV1/FVC ratio≥0.7 and a FEV1<80%. The preclinical stage, called pre-COPD, is characterized by respiratory symptoms and structural or functional abnormalities, without obvious airflow limitation at any age. Incorporating criteria for Pre-COPD were as follows: the absence of airflow limitation (FEV1/FVC≥0.7) and FEV1≥80%; abnormal imaging findings like bullae, emphysema, or hyperinflation suggestive of air trapping; or the presence of respiratory symptoms such as chronic bronchitis (defined as cough and phlegm occurring for >3 months per year for >2 years) or dyspnea.
Statistical analysisAll statistical analyses were conducted using R software (ver. 4.3.1; R Development Core Team, Vienna, Austria). The results are expressed as the mean±standard deviation for continuous variables and as numbers (percentages) for categorical variables. Clinical parameters were compared among normal, pre-COPD, PRISm, and COPD patients using ANOVA for continuous variables and the χ2 test for categorical variables. Linear mixed models were used to analyze group differences in annual rates of lung function decline over a 12-year period, as indicated by FEV1, FVC, the FEV1/FVC ratio, and FEF25–75; covariates included age, sex, BMI, smoking history, and baseline FEV1. Changes in airway disease categories during follow-up are shown using Sankey diagrams.
Survival analysis was performed to identify the time to first AFO, defined as an FEV1/FVC ratio<0.7 in the normal, pre-COPD, and PRISm groups. Cox regression models were used to calculate hazard ratios (HRs) of pre-COPD and PRISm (compared to the normal group) for the time to first AFO. Model 1 was adjusted for age, sex, BMI, smoking history and FEV1, and model 2 was further adjusted for comorbid cardiovascular disease (CVD; the presence of hypertension, CAD, or CHF).
Multivariate logistic regression was performed to evaluate differences in the risk of future AFO among the normal, pre-COPD, and PRISm groups. We analyzed AFO according to its occurrence at least once during the 12-year study period and its occurrence at the last visit (year 12). The covariates included age, sex, BMI, and smoking history in model 1, with comorbid CVD added in model 2.
ResultsBaseline characteristics of the airway disease groupFrom the entire KOGES cohort of 10,030 individuals, 4762 were included in the analysis; we excluded those for whom classification of airway disease, and transition thereof, would be challenging due to missing pulmonary function, imaging, and respiratory symptom data. There were 66, 866, 289, and 3541 individuals in the PRISm, pre-COPD, COPD, and normal groups, respectively (Fig. S1).
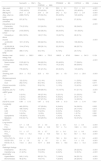
Table 1 summarizes the baseline characteristics of the four groups. The COPD group was the oldest, had the highest proportions of males (80.6%) and smokers, and had the lowest levels of education and income. Chronic bronchitis symptoms were most prevalent in the pre-COPD and COPD groups. While dyspnea was more common in the airway disease groups compared to the normal group, the severity of dyspnea did not differ significantly among the airway disease groups. Comorbid hypertension was prevalent in both the PRISm and COPD groups, while diabetes was more prevalent in the PRISm group. Baseline spirometry in the PRISm group revealed low values FEV1 and FVC values. Both the PRISm and COPD groups had low FEF25–75 values. Emphysema, interstitial lung abnormalities, hyperinflation, and bronchiectasis were more prevalent among the PRISm, pre-COPD, and COPD groups compared to normal group. The feature of hyperinflation was more common in the pre-COPD group compared to the PRISm group, while interstitial lung abnormalities were more frequent in the PRISm group than in the pre-COPD group.
Baseline characteristics.
| Normal(N=3541) | Pre-COPD(N=866) | PRISM(N=66) | COPD(N=289) | p value | |
|---|---|---|---|---|---|
| Age, years | 49.8±7.9 | 51.2±8.6 | 50.9±9.1 | 57.2±8.3 | <0.001 |
| Sex, male | 1742 (49.2%) | 379 (43.8%) | 39 (59.1%) | 233 (80.6%) | <0.001 |
| BMI (kg/m2) | 24.9±2.8 | 24.4±3.4 | 24.2±3.2 | 24.0±2.9 | <0.001 |
| Area, urban (vs rural) | 2489 (70.3%) | 470 (54.3%) | 30 (45.5%) | 123 (42.6%) | <0.001 |
| Marriage state, unmarried | 237 (6.7%) | 72 (8.3%) | 2 (3.0%) | 27 (9.3%) | 0.083 |
| Educational level | <0.001 | ||||
| Elementary school or lower | 774 (21.9%) | 212 (24.6%) | 15 (22.7%) | 99 (34.6%) | |
| Middle or high school | 2100 (59.5%) | 502 (58.2%) | 36 (54.5%) | 161 (56.3%) | |
| University or above | 653 (18.5%) | 149 (17.3%) | 15 (22.7%) | 26 (9.1%) | |
| Income | <0.001 | ||||
| <2,000,000 KRW | 1811 (51.6%) | 536 (62.5%) | 39 (59.1%) | 199 (69.3%) | |
| ≥2,000,000 & <4,000,000 KRW | 1314 (37.4%) | 258 (30.1%) | 22 (33.3%) | 68 (23.7%) | |
| ≥4,000,000 KRW | 388 (11.0%) | 63 (7.4%) | 5 (7.6%) | 20 (7.0%) | |
| Nutrition, total energy, kcal | 1910.2±592.5 | 1936.1±753.5 | 1992.5±679.3 | 1844.4±541.3 | 0.124 |
| Smoking status | <0.001 | ||||
| Never smoker | 2125 (60.1%) | 534 (62.0%) | 32 (48.5%) | 77 (26.6%) | |
| Former smoker | 632 (17.9%) | 146 (17.0%) | 14 (21.2%) | 89 (30.8%) | |
| Current smoker | 778 (22.0%) | 181 (21.0%) | 20 (30.3%) | 123 (42.6%) | |
| Smoking, pack-years | 20.4±15.2 | 22.5±16.1 | 24.1±15.1 | 31.6±20.6 | <0.001 |
| Biomass exposure | |||||
| Chemical | 122 (3.5%) | 12 (1.4%) | 0 (0.0%) | 11 (3.8%) | 0.006 |
| Dust | 262 (7.5%) | 66 (7.9%) | 3 (4.6%) | 27 (9.6%) | 0.477 |
| Chronic bronchitis symptoms | 0 (0.0%) | 53 (6.1%) | 1 (1.5%) | 13 (4.5%) | <0.001 |
| Dyspnea, yes (%) | 0 (0%) | 589 (68.0%) | 13 (19.7%) | 61 (21.1%) | <0.001 |
| mMRC grade | 1.00 | ||||
| 0 | 0 (0.0%) | 160 (27.4%) | 3 (23.1%) | 21 (35.0%) | |
| 1 | 0 (0.0%) | 266 (45.6%) | 6 (46.2%) | 25 (41.7%) | |
| ≥2 | 0 (0.0%) | 157 (27.0%) | 4 (30.8%) | 14 (23.3%) | |
| EQ-5D-5L score | 0.89±0.13 | 0.87±0.12 | 0.90±0.13 | 0.91±0.14 | 0.021 |
| Comorbidity | |||||
| HTN | 462 (25.5%) | 137 (25.8%) | 9 (34.6%) | 54 (36.0%) | 0.032 |
| DM | 186 (10.6%) | 54 (10.6%) | 6 (27.3%) | 24 (17.0%) | 0.010 |
| CAD | 17 (1.0%) | 10 (2.0%) | 0 (0.0%) | 3 (2.2%) | 0.221 |
| CHF | 3 (0.2%) | 1 (0.2%) | 0 (0.0%) | 1 (0.7%) | 0.581 |
| Dyslipidemia | 116 (6.6%) | 27 (5.3%) | 1 (4.3%) | 6 (4.3%) | 0.550 |
| Metabolic syndrome | 618 (34.1%) | 153 (29.5%) | 8 (34.8%) | 54 (37.2%) | |
| Lung function | |||||
| FVC, L | 3.7±0.8 | 3.7±0.9 | 2.6±0.6 | 4.0±0.9 | <0.001 |
| FVC, %predicted | 104.8±13.5 | 106.8±13.9 | 70.7±7.4 | 106.5±15.5 | <0.001 |
| FEV1, L | 3.1±0.7 | 3.0±0.7 | 2.0±0.4 | 2.6±0.6 | <0.001 |
| FEV1, %predicted | 113.8±15.2 | 115.6±15.9 | 72.9±6.2 | 93.7±16.3 | <0.001 |
| FEV1/FVC (%) | 81.9±5.3 | 81.3±5.7 | 78.0±5.8 | 64.1±5.6 | <0.001 |
| FEF25–75% | 3.4±1.0 | 3.2±1.0 | 1.9±0.6 | 1.4±0.5 | <0.001 |
| FEF25–75, % pred | 110.6±29.4 | 107.7±29.9 | 60.8±16.8 | 48.4±14.4 | <0.001 |
| Radiologic findings | |||||
| Emphysema | 39 (1.9%) | 22 (4.8%0 | 1 (3.2%) | 29 (22.0%) | <0.001 |
| Interstitial lung abnormality | 41 (2.0%) | 15 (3.3%) | 2 (6.2%) | 12 (9.3%) | <0.001 |
| Hyperinflation | 240 (11.4%) | 305 (51.7%) | 7 (19.4%) | 94 (53.1%) | <0.001 |
| Bronchiectasis | 48 (2.4%) | 19 (4.1%) | 7 (20.6%) | 26 (20.0%) | <0.001 |
BMI, body mass index; CAD, coronary artery disease; CHF, congestive heart failure; COPD, chronic obstructive pulmonary disease; DM, diabetes mellitus; FEF, forced expiratory flow; FEV1, forced expiratory volume in 1s; FVC, forced vital capacity; HTN, hypertension; KRW, Korean won; mMRC, modified Medical Research Council; PRISm, preserved ratio impaired spirometry.
Fig. 1 shows the longitudinal trends in pulmonary function indicators. For FEV1, the baseline values were higher in the normal and pre-COPD groups compared to the COPD and PRISm groups. However, the rate of decline was more rapid in the pre-COPD group than in the normal group, and the rate was significantly lower in the PRISm group (−40.2, −42.6, and −12.6mL/year in the normal, pre-COPD, and PRISm groups, respectively). The rate of FEV1 decline in the PRISm group was significantly slower compared to both the normal and COPD groups.
. (A) FEV1; (B) FVC; (C) FEV1/FVC ratio; (D) FEF25–75. * vs normal (p<0.05), # vs COPD (p<0.05). COPD, chronic obstructive pulmonary disease; FEF, forced expiratory flow; FEV1, forced expiratory volume in 1s; FVC, forced vital capacity; PRISm, preserved ratio impaired spirometry.")
Differences in the rate of lung function decline over time among four different airway disease status groups (COPD, normal, pre-COPD, and PRISm). (A) FEV1; (B) FVC; (C) FEV1/FVC ratio; (D) FEF25–75. * vs normal (p<0.05), # vs COPD (p<0.05). COPD, chronic obstructive pulmonary disease; FEF, forced expiratory flow; FEV1, forced expiratory volume in 1s; FVC, forced vital capacity; PRISm, preserved ratio impaired spirometry.
The baseline FVC was lowest in the PRISm group. However, the rate of decline was more gradual in the PRISm group (−2.4mL/year) than in the normal (−33.7mL/year) and COPD (−49.9mL/year) groups.
The baseline FEV1/FVC ratio exceeded 70% in all groups except the COPD group. However, the rate of decline was more rapid in the pre-COPD group than the normal group. Compared to the COPD group, the rate of decline was faster in the normal, pre-COPD, and PRISm groups.
The baseline FEF25–75 was lower in the PRISm and COPD groups compared to the normal and pre-COPD groups. The rate of decline was more gradual in the PRISm (−37.9mL/year) and COPD (−35.9mL/year) groups compared to the normal (−83.3mL/year) and pre-COPD (−83.5mL/year) groups.
Transitions of airway group categoriesThe transitions in airway groups among the enrollment, first assessment, and second assessment timepoints are shown in Fig. 2. There was no loss to follow-up at both timepoints. Of the subjects with COPD or normal findings at enrollment, approximately 79% and 85%, respectively, showed no change in status at the second assessment. However, of those initially categorized as pre-COPD or PRISm, 65% and 53%%, respectively, transitioned to the normal group. Notably, there were higher rates of transition from PRISm to COPD (13.6%) or pre-COPD (9.1%) compared to the transition from pre-COPD to COPD (4.4%) or PRISm (0.7%). At subsequent assessments, the majority of subjects in the COPD and normal groups showed no change in status. However, among those classified as pre-COPD, approximately 66% transitioned to normal status, while 3.5% transitioned to COPD. In the PRISm group, 21.6% transitioned to normal status, while 16.2% transitioned to pre-COPD and 10.8% to COPD.
Differences in time to first AFO among the normal, pre-COPD, and PRISm groups shown using a Sankey diagram. Transitions from the (A) normal, (B) pre-COPD, (C) PRISm, and (D) COPD groups. COPD, chronic obstructive pulmonary disease; PRISm, preserved ratio impaired spirometry.")
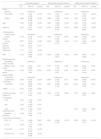
Significant group differences were observed in time to first AFO, in the order of the PRISm, pre-COPD, and normal groups (Fig. 3). Univariate and multivariate Cox regression analyses were used to evaluate factors influencing the time to first AFO (Table 2). In the univariate analyses, the pre-COPD and PRISm groups had HRs indicating elevated risk compared to the normal group. Old age, male sex, smoking status, low BMI, respiratory symptoms, comorbid CVD, and lower lung function parameters had significant associations with COPD progression. According to multivariate model 1, which considered age, sex, smoking status, BMI, smoking history, education level, income, and chronic bronchitis symptoms, both pre-COPD and PRISm significantly increased the risk of progression to COPD. However, in model 2, which also considered the presence of CVD, the impact of PRISm became non-significant.

Cox regression for time-to-first AFO.
| Univariate analysis | Multivariate analysis (model 1) | Multivariate analysis (model 2) | |||||||
|---|---|---|---|---|---|---|---|---|---|
| HR | 95% CI | p value | HR | 95% CI | p value | HR | 95% CI | p value | |
| Group | |||||||||
| Normal | (reference) | (reference) | (reference) | ||||||
| Pre-COPD | 1.704 | 1.416–2.052 | <0.001 | 1.576 | 1.291–1.923 | <0.001 | 1.751 | 1.322–2.319 | <0.001 |
| PRISm | 3.669 | 2.388–5.638 | <0.001 | 1.684 | 1.039–2.730 | 0.034 | 1.632 | 0.748–3.559 | 0.218 |
| Age | 1.055 | 1.045–1.065 | <0.001 | 1.040 | 1.026–1.053 | <0.001 | 1.038 | 1.018–1.059 | <0.001 |
| Male sex | 3.331 | 2.761–4.019 | <0.001 | 3.604 | 2.584–5.027 | <0.001 | 3.862 | 2.374–6.283 | <0.001 |
| Smoking status | |||||||||
| Never smoker | (reference) | (reference) | (reference) | ||||||
| Former smoker | 2.716 | 2.186–3.376 | <0.001 | 1.559 | 1.163–2.090 | 0.003 | 1.629 | 1.058–2.510 | 0.027 |
| Current smoker | 3.807 | 3.145–4.609 | <0.001 | 2.452 | 1.869–3.216 | <0.001 | 2.317 | 1.554–3.453 | <0.001 |
| Biomass exposure | 1.073 | 0.814–1.415 | 0.616 | ||||||
| Pack years | 1.017 | 1.011–1.022 | <0.001 | ||||||
| BMI | 0.918 | 0.892–0.945 | <0.001 | 0.949 | 0.922–0.977 | <0.001 | 0.947 | 0.907–0.989 | 0.013 |
| Educational level | |||||||||
| Elementary school or lower | (reference) | (reference) | (reference) | ||||||
| Middle or high school | 0.790 | 0.651–0.959 | 0.017 | 0.913 | 0.727–1.145 | 0.429 | 0.852 | 0.604–1.203 | 0.363 |
| University or above | 0.816 | 0.627–1.061 | 0.034 | 0.720 | 0.533–0.971 | 0.031 | 0.654 | 0.415–1.032 | 0.679 |
| Income (KRW) | |||||||||
| <2,000,000 | (reference) | (reference) | (reference) | ||||||
| ≥2,000,000 & <4,000,000 | 0.695 | 0.578–0.834 | <0.001 | 0.899 | 0.732–1.104 | 0.311 | 0.892 | 0.659–1.207 | 0.459 |
| ≥4,000,000 | 0.612 | 0.446–0.840 | 0.002 | 0.820 | 0.586–1.148 | 0.248 | 0.805 | 0.482–1.343 | 0.405 |
| mMRC≥2 | 0.913 | 0.793–1.051 | 0.206 | ||||||
| Chronic bronchitis symptoms | 1.971 | 1.112–3.491 | 0.020 | 1.408 | 0.778–2.549 | 0.258 | 1.516 | 0.695–3.307 | 0.296 |
| Comorbidity | |||||||||
| HTN | 1.357 | 1.043–1.766 | 0.023 | ||||||
| DM | 1.532 | 1.085–2.165 | 0.016 | ||||||
| CVD (HTN/CAD/CHF) | 1.329 | 1.022–1.727 | 0.034 | 1.075 | 0.808–1.431 | 0.620 | |||
| Metabolic syndrome | 1.202 | 0.933–1.548 | 0.155 | ||||||
| Lung function parameters | |||||||||
| FEV1 (L) | 1.013 | 0.898–1.144 | 0.829 | 0.603 | 0.496–0.732 | <0.001 | 0.526 | 0.387–0.715 | <0.001 |
| FVC (L) | 1.592 | 1.451–1.746 | <0.001 | ||||||
| FEV1/FVC | 0.717 | 0.701–0.732 | <0.001 | ||||||
| FEF25-75 (L) | 0.318 | 0.286–0.354 | <0.001 | ||||||
Model 1. Adjusted for age, sex, body mass index (BMI), smoking history, education level, income level, chronic bronchitis symptoms, forced expiratory volume in 1s (FEV1).
Model 2. Adjusted for age, sex, BMI, smoking history, education level, income level, chronic bronchitis symptoms, cardiovascular disease (CVD), FEV1.
BMI, body mass index; CVD, cardiovascular disease; COPD, chronic obstructive pulmonary disease; CVD, cardiovascular disease; DM, diabetes mellitus; FEF, forced expiratory flow; FEV1, forced expiratory volume in 1s; FVC, forced vital capacity; HTN, hypertension; KRW, Korean won; mMRC, modified Medical Research Council; PRISm, preserved ratio impaired spirometry.
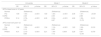
To compare the risk of future AFO among groups, we used a multivariate logistic regression model (Table 3). In the univariate analyses, the pre-COPD and PRISm groups had higher risks of developing AFO at least once during the 12-year follow-up (OR 1.89, p<0.001; OR 5.14, p<0.001, respectively) and at the last visit (year 12) (OR 1.66, p<0.001; OR 4.31, p<0.001, respectively). In the multivariate analysis adjusting for age, sex, BMI, and smoking history (model 1), both groups had significantly higher risks of future AFO at least during the 12-year follow-up (OR 1.80, p<0.001; OR 4.26, p<0.001, respectively) and at the last visit (year 12) (OR 1.54, p<0.001; OR 3.21, p<0.004, respectively). After adding the presence of CVD as a covariate, the significance remained for the pre-COPD group developing AFO at the last visit (OR 1.63, p=0.019) but was lost for the PRISm group (OR 3.29, p=0.079).
Multivariate logistic regression for future AFO in normal, Pre-COPD and PRISm group.
| Univariate | Model 1 | Model 2 | |||||||
|---|---|---|---|---|---|---|---|---|---|
| OR | 95% CI | p-Value | OR | 95% CI | p-Value | OR | 95% CI | p-Value | |
| AFO at least once in 12 years | |||||||||
| Normal | (Reference) | (Reference) | (Reference) | ||||||
| Pre-COPD | 1.89 | 1.53–2.35 | <0.001 | 1.80 | 1.40–2.30 | <0.001 | 2.06 | 1.47–2.88 | <0.001 |
| PRISm | 5.14 | 2.78–9.51 | <0.001 | 4.26 | 2.04–8.87 | <0.001 | 4.66 | 1.38–15.78 | 0.013 |
| AFO at last visit (year 12) | |||||||||
| Normal | (Reference) | (Reference) | (Reference) | ||||||
| Pre-COPD | 1.66 | 1.29–2.15 | <0.001 | 1.54 | 1.16–2.05 | <0.001 | 1.63 | 1.08–2.46 | 0.019 |
| PRISm | 4.31 | 2.15–8.64 | <0.001 | 3.21 | 1.44–7.15 | 0.004 | 3.29 | 0.87–12.44 | 0.079 |
Model 1. Adjusted for age, sex, body mass index (BMI), smoking history.
Model 2. Adjusted for age, sex, BMI, smoking history, cardiovascular disease (CVD).
AFO, airflow obstruction; CI, confidence interval; COPD, chronic obstructive pulmonary disease; CVD, cardiovascular disease; OR, odds ratio; PRISm, preserved ratio impaired spirometry.
This prospective cohort study sought to classify a substantial sample of the general population into airway groups based on lung function, respiratory symptoms, and radiological abnormalities. Group transitions were identified by analyzing follow-up data. Indicators of AFO, such as FEV1, the FEV1/FVC ratio, and FEF25–75, declined more rapidly in the pre-COPD group than in the PRISm group. Moreover, while transitions to normal status or COPD occurred in both the pre-COPD and PRISm groups, more transitions occurred in the PRISm group. Although the risk of developing COPD was much higher in the PRISm group than in the other groups, the risk was nevertheless significantly higher in both the pre-COPD and PRISm groups compared to the normal group.
This study found that the rates of decline in FEV1, the FEV1/FVC ratio, and FEF25–75 were notably higher in the pre-COPD group compared to the normal group, and the decline in FEV1 and FEF25–75 was slower in the PRISm group compared to the normal group. Moreover, there were significantly more status transitions in the pre-COPD and PRISm groups compared to the other groups. During the initial follow-up period, approximately half of the individuals in both the pre-COPD and PRISm groups transitioned to normal status. In the pre-COPD group, a similar pattern was seen during the second follow-up period, with approximately 55% of patients transitioning to normal status. However, in the PRISm group, a distinct trend emerged, with 51% of patients classified as “persistently PRISm” and >10% progressing to COPD during both the first and second follow-up periods. Other cohort studies have reported frequent transitions between PRISm and other lung function groups,5,6,10 and the reported occurrence of AFO in patients with PRISm progressing to COPD is in the range of 15–40%. In our study, however, the proportion of patients transiting from PRISm to COPD was only approximately 13%, which is lower than that reported elsewhere. Since our study included relatively young subjects (average age of 50 years) and many never-smokers compared to other studies, which often included mainly elderly patients and smokers with >10 pack-years of smoking, it is plausible to attribute these differences to age-related variation in pulmonary function and the influence of cigarette smoking.5,6,8
Given the recent interest in the earlier stages of COPD, the GOLD classified individuals with a high likelihood of developing COPD into pre-COPD and PRISm groups.23 Recently, Miguel et al.24 analyzed risk factors for the progression from pre-COPD to COPD within a cohort of smokers, identifying a low FEV1/FVC ratio, ≥30 pack-years of smoking, BMI<25kg/m2, and a history of chronic bronchitis as risk factors. Our study similarly identified smoking, low BMI, and impaired lung function as risk factors for COPD progression, and the pre-COPD and PRISm patients had higher risks of progression to COPD. However, it is noteworthy that all groups in this study had a mean BMI<25, possibly reflecting ethnic variation.
Pre-COPD and PRISm contributed to an earlier time to first AFO Another interesting finding in the present study was that both pre-COPD and PRISm significantly shortened the time to first AFO, although this was not seen in the PRISm group when CVD was considered. CVD is thought to be a comorbid condition of COPD. However, a recent Danish study based on the Copenhagen City Heart study,25 which included 1160 individuals aged 20–40 years, found that incident PRISm could increase the risk of hospitalization for CVDs, such as ischemic heart disease or heart failure. Furthermore, PRISm was associated with obesity, smoking, cardiovascular comorbidities, and increased CVD-related morbidity and mortality.12,26 Not all individuals with pre-COPD or PRISm will necessarily develop fixed airflow limitation. Particularly in PRISm patients diagnosed solely based on pulmonary function tests, without concurrent respiratory symptoms or imaging findings suggestive of COPD, clinicians should consider the presence of pre-existing CVD.
Considering the socioeconomic impact of COPD, it is necessary to define early disease and examine the effects of early intervention on these patients. However, there are few randomized controlled trials (RCTs) have addressed the early detection and treatment of such individuals who are at-risk for development of COPD. Moreover, a recent RCT reported that the use of dual-bronchodilator inhaler treatment in the PRISm group did not reduce respiratory symptoms.27
This study had several limitations. First, the KoGES cohort did not include post-BD values, necessitating the classification of airway groups based on pre-bronchodilator (BD) values. However, numerous studies have used pre-BD values as an alternative to post-BD values for evaluation of patients with COPD in terms of diagnosis, clinical features and longitudinal outcomes.28–31 Recently, respiratory symptoms were found to be more severe in a post-BD PRISm group compared to a pre-BD PRISm group whose post-BD values were normalized.32 However, there are few comparative studies of pre-BD and post-BD, and the concept of PRISm includes patients capable of transitioning. Second, radiological abnormalities were ascertained using chest radiographs, not chest computed tomography (CT). Consequently, structural abnormalities indicative of COPD beyond emphysema and bullae, such as airway wall thickening, were not discernible. However, repeated CT examinations present challenges in terms of time, resources, and radiation exposure-related risks in the general population. Third, the diffusing capacity for carbon monoxide (DLCO) values was not known. Given that DLCO can help to identify individuals with an elevated risk of developing COPD among smokers without AFO, the unavailability of this metric may have resulted in underestimation of the risk of progression to COPD. Fourth, as this cohort did not focused primarily on airway and lung diseases, there were no indicators of airway disease-specific quality of life or the severity of symptoms. However, we addressed this deficiency by using the mMRC dyspnea scale and EQ-5D-5L, derived from multiple inquiries related to dyspnea and general quality of life. Lastly, we were unable to obtain mortality information, and some patients may have passed away during the follow-up period. We have presented the number of participants at each follow-up in Table S1. From Year 0 to Year 4, there were no missing data. By Year 12, 3352 out of 4762 patients were followed up.
In conclusion, in a large cohort drawn from the general population, we found that individuals with pre-COPD and those in the PRISm group exhibited comparable differences in the longitudinal changes of lung function parameters over time. Additionally, a significant proportions of individuals in both groups transitioned to other lung function groups over time. As well as age, male sex, lower BMI, and low lung function, pre-COPD and PRISm were identified as risk factors for progression to COPD. However, in PRISm patients, the concurrent presence of CVD should be considered.
Ethics approval and consent to participateEthical approval was obtained from the Ethics Committee of Incheon St. Mary's Hospital, and the IRB number was OC23ZISI0033. The requirement for informed consent was waived by the Ethics Committee of Incheon St. Mary's Hospital.
FundingThis research was supported by Basic Science Research Program through the National Research Foundation of Korea (NRF) funded by the Ministry of Education (grant number) (NRF-2022R1I1A1A01063654).
Author's contributionsYSJ and JYC contributed to study concept/study design.
YSJ and JYC contributed to data acquisition and analysis.
All authors contributed to interpretation for the work.
YSJ and JYC contributed to drafting the work.
All authors contributed to critical revision for relevant intellectual content and final approval of this manuscript.
Conflicts of interestsNone.
Data availability statementThe raw data involved in this study will be available by the corresponding author to any qualified researcher.
Declaration of generative AI and AI-assisted technologies in the writing processNone.
- -
This study was conducted with bioresources from National Biobank of Korea, The Korea Disease Control and Prevention Agency, Republic of Korea (KBN-2023-005).
- -
Financial/nonfinancial disclosures: None of the authors have any financial relationships with a commercial entity with an interest in the subject of this manuscript.


