


This study aimed to evaluate a potential relationship between the diffusing capacity of the lung for carbon monoxide (DLCO) and the aggressiveness of lung adenocarcinoma (ADC).
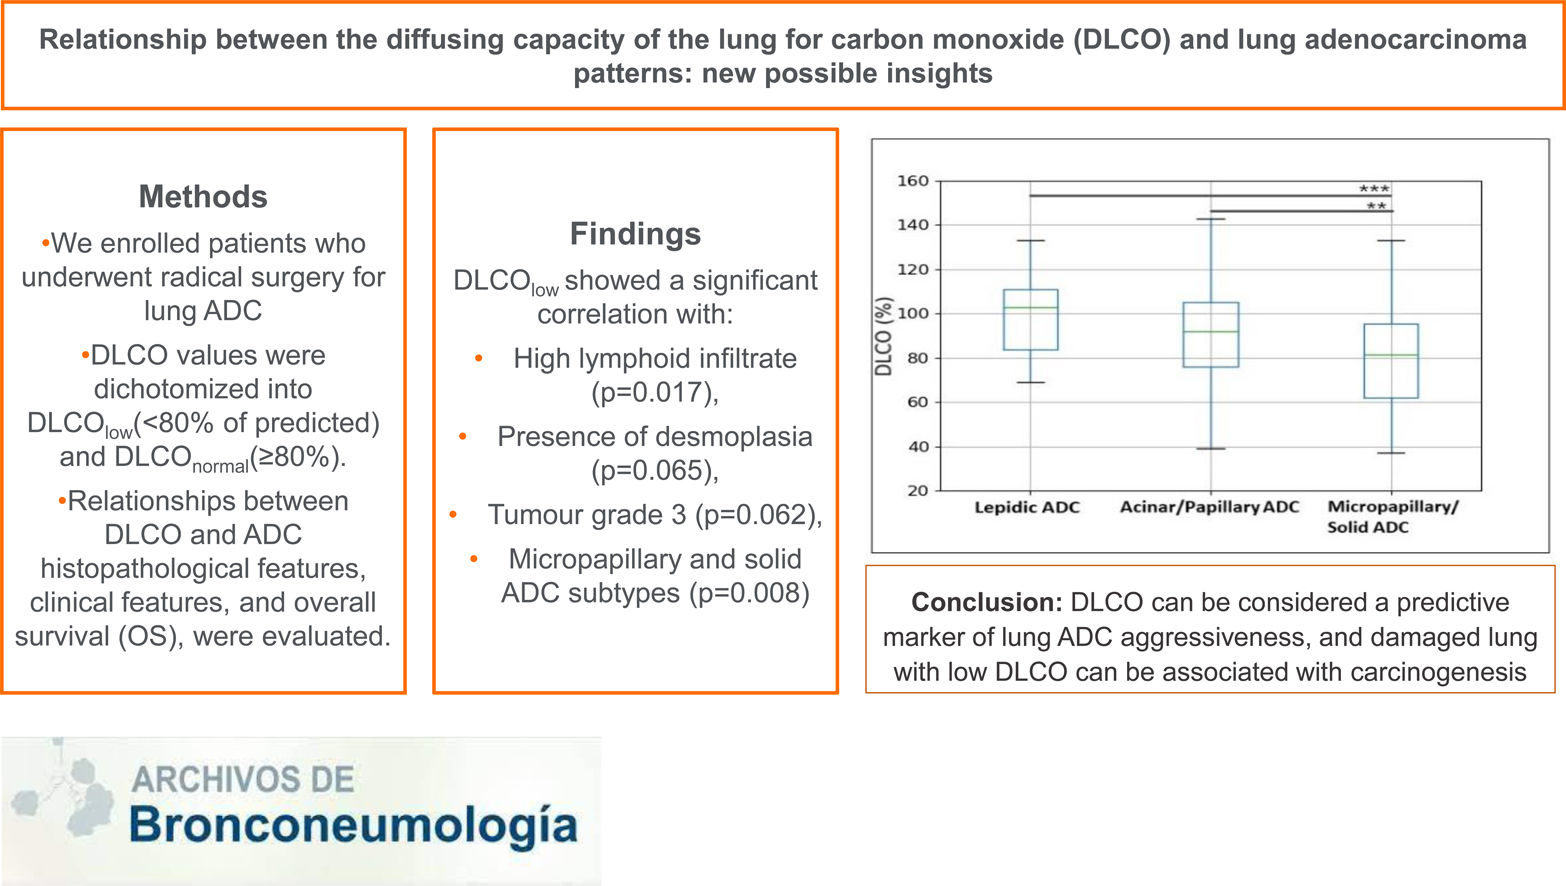
MethodsPatients who underwent radical surgery for lung ADC between 2001 and 2018 were retrospectively reviewed. DLCO values were dichotomized into DLCOlow (<80% of predicted) and DLCOnormal (≥80%). Relationships between DLCO and ADC histopathological features, clinical features, as well as with overall survival (OS), were evaluated.
ResultsFour-hundred and sixty patients were enrolled, of which 193 (42%) were included in the DLCOlow group. DLCOlow was associated with smoking status, low FEV1, micropapillary and solid ADC, tumour grade 3, high tumour lymphoid infiltrate and presence of tumour desmoplasia. In addition, DLCO values were higher in low-grade ADC and progressively decreased in intermediate and high-grade ADC (p=0.024). After adjusting for clinical variables, at multivariable logistic regression analysis, DLCOlow still showed a significant correlation with high lymphoid infiltrate (p=0.017), presence of desmoplasia (p=0.065), tumour grade 3 (p=0.062), micropapillary and solid ADC subtypes (p=0.008). To exclude the association between non-smokers and well-differentiated ADC, the relationship between DLCO and histopathological ADC patterns was confirmed in the subset of 377 former and current smokers (p=0.021). At univariate analysis, gender, DLCO, FEV1, ADC histotype, tumour grade, stage, pleural invasion, tumour necrosis, tumour desmoplasia, lymphatic and blood invasion were significantly related with OS. At multivariate analysis, only gender (p<0.001), tumour stage (p<0.001) and DLCO (p=0.050) were significantly related with the OS.
ConclusionsWe found a relationship between DLCO and ADC patterns as well as with tumour grade, tumour lymphoid infiltrate and desmoplasia, suggesting that lung damage may be associated with tumour aggressiveness.
The diffusing capacity of the lung for carbon monoxide (DLCO) is a pulmonary function test that measures the pulmonary performance for gas exchange from inhaled air into the blood stream, thus representing a marker of lung damage and mostly intended for diffuse alterations of alveolo-capillary barrier. Indeed, DLCO is reduced in patients with emphysema, interstitial lung disease and pulmonary fibrosis as well as in various other lung diseases.1 In addition, DLCO has been related to postoperative morbidity, mortality and overall survival (OS) in patients with non-small-cell lung cancer (NSCLC), with low DLCO values negatively affecting OS probably because of the occurrence of pulmonary complications.2–12 In 2011, the ATS/ERS/IASLC proposed a new classification of lung adenocarcinoma (ADC),13 which was issued by the World Organization of Health (WHO) in 2015.14 There were introduced and reclassified several different patterns of ADC with peculiar pathological features and related clinical behaviours, well demonstrated and validated by several authors15–18 and consequently holding prognostic relevance.19–22 Among them, low DLCO values – reflecting a reduced pulmonary function – have been associated to histopathological indexes of tumour aggressiveness23 and these observations suggested that lung damage may be associated with tumour carcinogenesis and aggressiveness. We aimed to investigate the relationship between DLCO and lung ADC histopathological aggressiveness and to evaluate if more aggressive patterns of ADC develop in more severely damaged lung.
Materials and MethodsPatientsPatients undergoing curative surgery for primary lung ADC between January 2001 and December 2018 were retrospectively reviewed, and their clinical characteristics, smoking status, tumour location, surgical procedure, lung cancer histology, lung cancer staging, and survival time were recorded. All patients were considered suitable for surgery after assessment of medical status, based upon evaluation of general condition and comorbidities, including physical examinations, blood and urine tests, cultures, assessment of both cardiac (electrocardiography, echocardiogram) and pulmonary function (spirometry with quantification of FEV1 and DLCO). After surgery, follow-up was set to last 5 years, with chest computed tomography (CT) scan every 6 months in the first 2 years and every year in the next 3 years. In addition, the patients were followed up through outpatient department visits or telephone calls.
DLCO AssessmentDLCO testing was performed by the single-breath method, through an inhalational mixture of 0.3% carbon monoxide (CO) and 0.3% methane.24 Patients were instructed to hold their breath for 10s, followed by a complete and consistent exhalation, at which time an alveolar sample of exhaled gas was analyzed to measure the uptake of CO. The test was repeated after 5min The mean value of two acceptable DLCO tests within 2ml/min/mmHg was reported.25 The standard comparison set of Morris/Polgar acted as normal reference values. The cut-off values of DLCO and FEV1 (forced expiratory volume in 1s) were set to 80%, based on the clinical guidelines, thus resulting in DLCOlow (<80% of predicted) and DLCOnormal (≥80% of predicted) groups, FEV1low (<80% of predicted) and FEV1normal (≥80% of predicted) groups.8,12
Histological ClassificationAll the pathology slides of the study period were retrospectively reviewed by two pathologist of our thoracic oncology group and reclassified accordingly to the IASLC/ATS/ERS classification13 issued by the World Organization of Health (WHO) in 2015.14 It is important to note that pure adenocarcinomas (ADCs), composed by a single subtype, are relatively infrequent, since the majority are composed by at least two patterns mixed together17; in these ADCs, based on a semiquantitative analysis of the tumour, a predominant pattern (PP) might be recognized, followed by a second predominant pattern (SPP). In this regard, all ADC subtypes were recorded semi-quantitatively in 5% increments and diagnoses were reached by consensus among pathologists of our institution, blinded to the patient outcomes. In addition to this, according to these clinical peculiarities, the main patterns can be divided in the following groups15,26: the low-grade group (G1), which accounts for lepidic patterns, the intermediate grade group (G2) which accounts for the acinar and papillary pattern and the high-grade group (G3) which involves solid and micropapillary patterns. The cases were initially double-blindly reviewed by the two pathologists. There were no discordant cases during the diagnosis of the lepidic (G1) and solid-micropapillary (G3) patterns. The only discordant cases were between the acinar and papillary histotypes (G2). However, the Cohen's k coefficient was superior to 0.81 (almost perfect agreement). These last cases were reviewed in consensus by the two pathologists and a new agreed pattern was assigned (acinar/papillary). The amount of tumour-infiltrating lymphocytes (TILs) in the stromal compartment was taken into account. TILs are reported for the stromal compartment as percentage. The denominator used to determine the % stromal TILs is the area of stromal tissue (i.e. area occupied by mononuclear inflammatory cells over total intratumoral stromal area), not the number of stromal cells. Haematoxylin and eosin-stained tumours sections were evaluated under bright-field microscopy and four categories, namely absent (0%), mild (1–20%), moderate (21–40%) and severe (41–100%) tumour lymphoid infiltrate were assigned. For statistical reasons, two levels of lymphoid infiltrate, low (0–20%), and high (21–100%) were established.
All cases were staged according to the eighth edition of the International Union Against Cancer (UICC)/American Joint Committee on Cancer TNM classification.27
Statistical AnalysisFisher's exact test and Student's t-test were used to compare the distribution of categorical and continuous values between the two groups, respectively. The Kolmogorov–Smirnov test was used to assess the normality of continuous variables. Missing data were not considered during the statistical analysis. One-way analysis of variance (ANOVA), followed by Tukey's test, was applied to compare three ADC patterns. The alpha level was set at 0.05. A multivariable logistic regression analysis with stepwise method was performed to estimate the odds ratios (ORs) and 95% confidence intervals (CI) for each of the histopathological indexes using the following clinical variables: age, gender, smoking status, DLCO and FEV1 status. OS was calculated from the time of diagnosis of the lung cancer to the patient's death or last follow-up. The Kaplan–Meier method was used to estimate the OS, and the log-rank test was used to compare the survival curves. A univariable and multivariable Cox regression analysis with stepwise method was performed to estimate the hazard ratios (HRs) and 95% CIs of each variables for the OS. Analyses were performed on the whole study population and in the subset of former and current smokers to exclude the association between non-smokers and the development of well-differentiated ADC. Statistical significance was defined as p<0.05. All statistical analyses were performed using SPSS version 27.0 (SPSS Inc., Chicago, IL).
Ethics StatementThe study protocol was approved by the local ethic committee (protocol number: 2520).
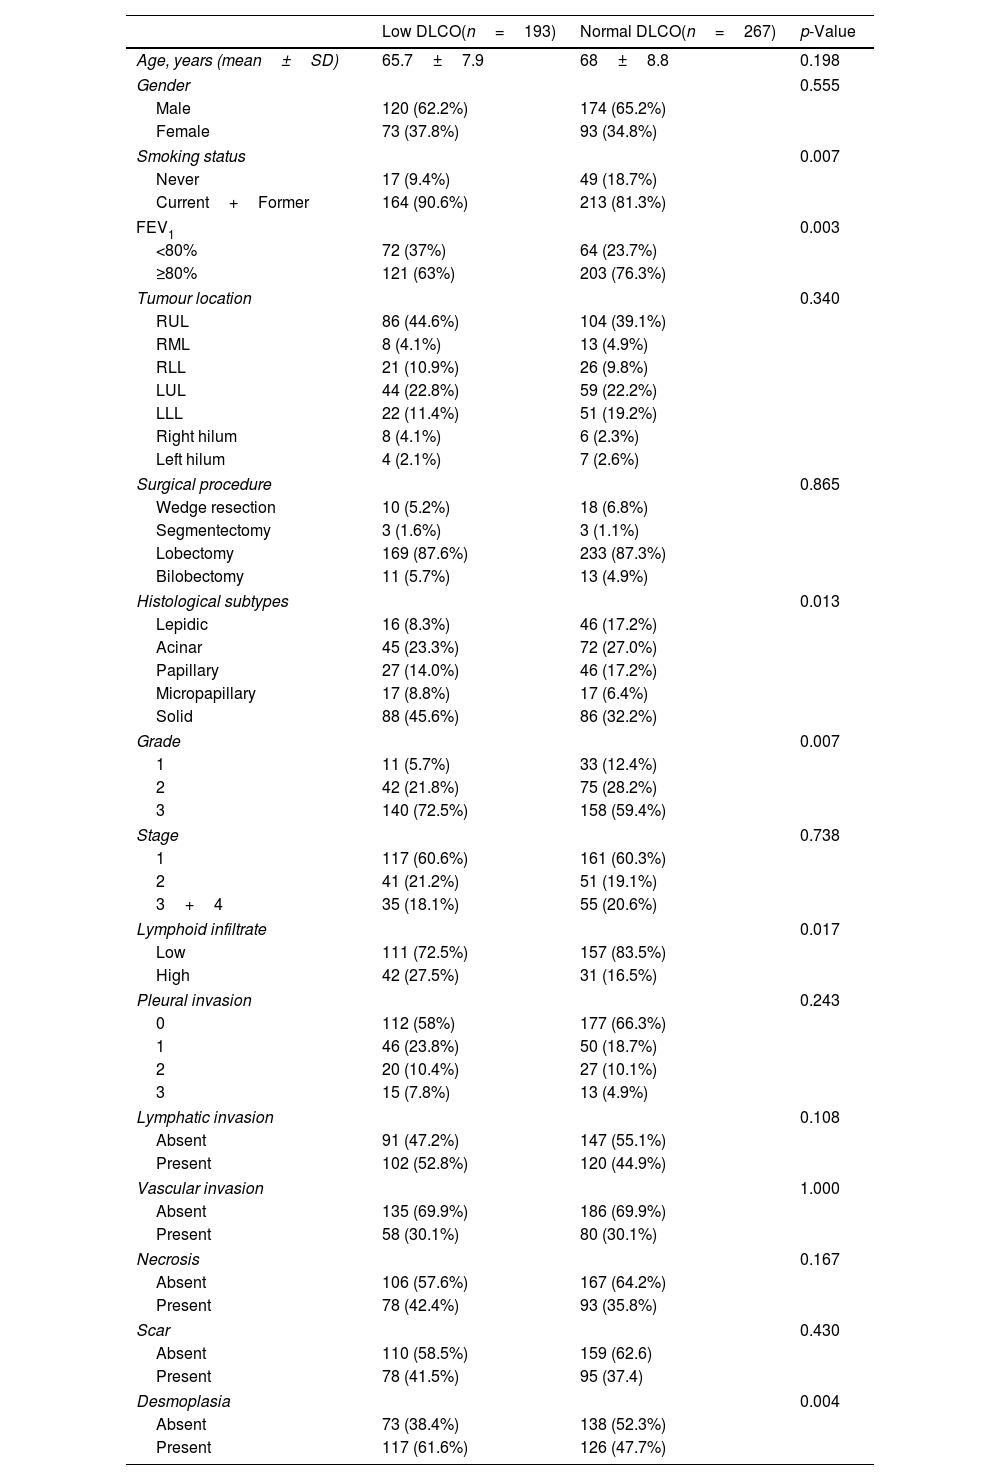
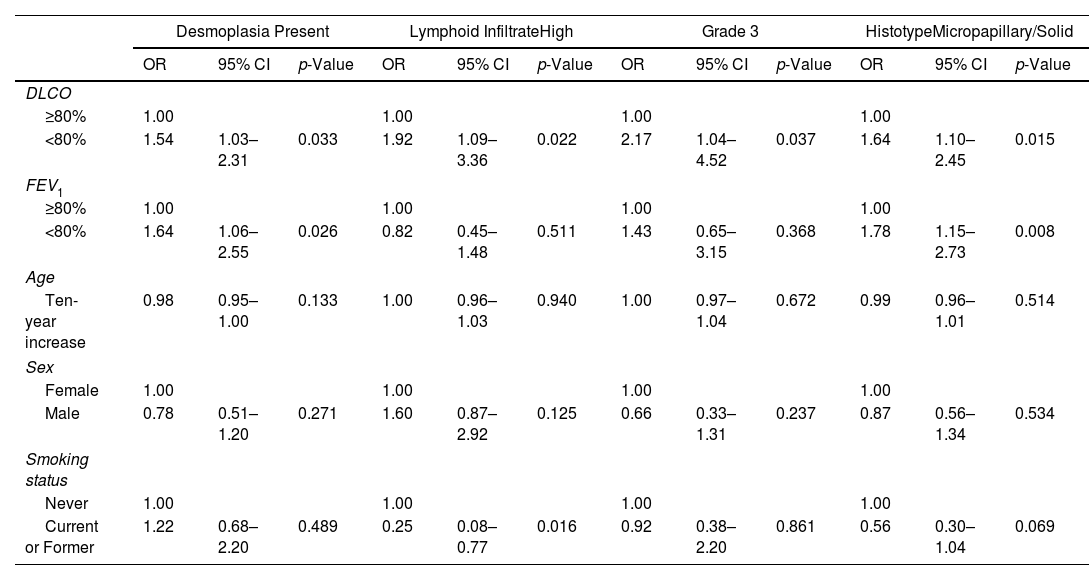
ResultsClinicopathological CharacteristicsFour-hundred and sixty patients with complete clinicopathological data were retrospectively selected. Table 1 shows the clinicopathological characteristics of the 193 (42%) patients with DLCOlow and 267 (58%) patients with DLCOnormal. Patients with DLCOlow were more frequently current or former smokers, with lower FEV1 values, and – regarding histopathological indexes – they showed higher frequency of high lymphoid infiltrate, tumour desmoplasia, micropapillary and solid ADC, and grade 3 tumour. DLCO was significantly higher in low-grade ADC, progressively decreasing in the intermediate and high-grade ADC (Fig. 1 and Table 2). A multivariable logistic regression analysis adjusted for clinical variables (age, gender, smoking status, DLCO and FEV1 groups), showed that DLCOlow remained significant predictor of presence of high lymphoid infiltrate [OR: 1.92 (95% CI: 1.09–3.36); p=0.022], desmoplasia [OR: 1.54 (95% CI: 1.03–2.31); p=0.033], micropapillary and solid ADC [OR: 1.64 (95% CI: 1.10–2.45); p=0.015], and grade 3 tumour [OR: 2.17 (95% CI: 1.04–4.52); p=0.037] (Table 3). FEV1low remained significant predictor of presence of desmoplasia and micropapillary/solid ADC, while smoking status was associated to presence of high lymphoid infiltrate (Table 3).
Clinicopathological Characteristics Classified by the DLCO Status.
| Low DLCO(n=193) | Normal DLCO(n=267) | p-Value | |
|---|---|---|---|
| Age, years (mean±SD) | 65.7±7.9 | 68±8.8 | 0.198 |
| Gender | 0.555 | ||
| Male | 120 (62.2%) | 174 (65.2%) | |
| Female | 73 (37.8%) | 93 (34.8%) | |
| Smoking status | 0.007 | ||
| Never | 17 (9.4%) | 49 (18.7%) | |
| Current+Former | 164 (90.6%) | 213 (81.3%) | |
| FEV1 | 0.003 | ||
| <80% | 72 (37%) | 64 (23.7%) | |
| ≥80% | 121 (63%) | 203 (76.3%) | |
| Tumour location | 0.340 | ||
| RUL | 86 (44.6%) | 104 (39.1%) | |
| RML | 8 (4.1%) | 13 (4.9%) | |
| RLL | 21 (10.9%) | 26 (9.8%) | |
| LUL | 44 (22.8%) | 59 (22.2%) | |
| LLL | 22 (11.4%) | 51 (19.2%) | |
| Right hilum | 8 (4.1%) | 6 (2.3%) | |
| Left hilum | 4 (2.1%) | 7 (2.6%) | |
| Surgical procedure | 0.865 | ||
| Wedge resection | 10 (5.2%) | 18 (6.8%) | |
| Segmentectomy | 3 (1.6%) | 3 (1.1%) | |
| Lobectomy | 169 (87.6%) | 233 (87.3%) | |
| Bilobectomy | 11 (5.7%) | 13 (4.9%) | |
| Histological subtypes | 0.013 | ||
| Lepidic | 16 (8.3%) | 46 (17.2%) | |
| Acinar | 45 (23.3%) | 72 (27.0%) | |
| Papillary | 27 (14.0%) | 46 (17.2%) | |
| Micropapillary | 17 (8.8%) | 17 (6.4%) | |
| Solid | 88 (45.6%) | 86 (32.2%) | |
| Grade | 0.007 | ||
| 1 | 11 (5.7%) | 33 (12.4%) | |
| 2 | 42 (21.8%) | 75 (28.2%) | |
| 3 | 140 (72.5%) | 158 (59.4%) | |
| Stage | 0.738 | ||
| 1 | 117 (60.6%) | 161 (60.3%) | |
| 2 | 41 (21.2%) | 51 (19.1%) | |
| 3+4 | 35 (18.1%) | 55 (20.6%) | |
| Lymphoid infiltrate | 0.017 | ||
| Low | 111 (72.5%) | 157 (83.5%) | |
| High | 42 (27.5%) | 31 (16.5%) | |
| Pleural invasion | 0.243 | ||
| 0 | 112 (58%) | 177 (66.3%) | |
| 1 | 46 (23.8%) | 50 (18.7%) | |
| 2 | 20 (10.4%) | 27 (10.1%) | |
| 3 | 15 (7.8%) | 13 (4.9%) | |
| Lymphatic invasion | 0.108 | ||
| Absent | 91 (47.2%) | 147 (55.1%) | |
| Present | 102 (52.8%) | 120 (44.9%) | |
| Vascular invasion | 1.000 | ||
| Absent | 135 (69.9%) | 186 (69.9%) | |
| Present | 58 (30.1%) | 80 (30.1%) | |
| Necrosis | 0.167 | ||
| Absent | 106 (57.6%) | 167 (64.2%) | |
| Present | 78 (42.4%) | 93 (35.8%) | |
| Scar | 0.430 | ||
| Absent | 110 (58.5%) | 159 (62.6) | |
| Present | 78 (41.5%) | 95 (37.4) | |
| Desmoplasia | 0.004 | ||
| Absent | 73 (38.4%) | 138 (52.3%) | |
| Present | 117 (61.6%) | 126 (47.7%) | |
DLCO: diffusing capacity of the lungs for carbon monoxide; FEV1: forced expiratory volume in 1s.
. The box length represents the interquartile range, the horizontal line displays the median value, and the whiskers mark the range of the data. One-way analysis of variance (ANOVA), followed by Tukey")
Box plot representation of DLCO value in three ADC patterns (lepidic, acinar+papillary, micropapillary+solid). The box length represents the interquartile range, the horizontal line displays the median value, and the whiskers mark the range of the data. One-way analysis of variance (ANOVA), followed by Tukey's test, was applied to compare three ADC patterns. **p<0.01, ***p<0.001 (alpha=0.05).
Multivariable Logistic Regression Analysis.
| Desmoplasia Present | Lymphoid InfiltrateHigh | Grade 3 | HistotypeMicropapillary/Solid | |||||||||
|---|---|---|---|---|---|---|---|---|---|---|---|---|
| OR | 95% CI | p-Value | OR | 95% CI | p-Value | OR | 95% CI | p-Value | OR | 95% CI | p-Value | |
| DLCO | ||||||||||||
| ≥80% | 1.00 | 1.00 | 1.00 | 1.00 | ||||||||
| <80% | 1.54 | 1.03–2.31 | 0.033 | 1.92 | 1.09–3.36 | 0.022 | 2.17 | 1.04–4.52 | 0.037 | 1.64 | 1.10–2.45 | 0.015 |
| FEV1 | ||||||||||||
| ≥80% | 1.00 | 1.00 | 1.00 | 1.00 | ||||||||
| <80% | 1.64 | 1.06–2.55 | 0.026 | 0.82 | 0.45–1.48 | 0.511 | 1.43 | 0.65–3.15 | 0.368 | 1.78 | 1.15–2.73 | 0.008 |
| Age | ||||||||||||
| Ten-year increase | 0.98 | 0.95–1.00 | 0.133 | 1.00 | 0.96–1.03 | 0.940 | 1.00 | 0.97–1.04 | 0.672 | 0.99 | 0.96–1.01 | 0.514 |
| Sex | ||||||||||||
| Female | 1.00 | 1.00 | 1.00 | 1.00 | ||||||||
| Male | 0.78 | 0.51–1.20 | 0.271 | 1.60 | 0.87–2.92 | 0.125 | 0.66 | 0.33–1.31 | 0.237 | 0.87 | 0.56–1.34 | 0.534 |
| Smoking status | ||||||||||||
| Never | 1.00 | 1.00 | 1.00 | 1.00 | ||||||||
| Current or Former | 1.22 | 0.68–2.20 | 0.489 | 0.25 | 0.08–0.77 | 0.016 | 0.92 | 0.38–2.20 | 0.861 | 0.56 | 0.30–1.04 | 0.069 |
DLCO: diffusing capacity of the lungs for carbon monoxide; FEV1: forced expiratory volume in 1s.
In the subset of former and current smokers (377 patients, 82%), patients with DLCOlow were characterized by lower FEV1 values, higher presence of lymphoid infiltrate and tumour desmoplasia, higher proportion of micropapillary and solid ADC (Supplementary Table S1). DLCO values were significantly higher in low-grade ADC, progressively decreasing in the intermediate and high-grade ADC (p=0.003; Supplementary Table S2). Similarly, after adjusting for the clinical variables (age, gender, DLCO and FEV1 groups) DLCOlow was a significant predictor for presence of high lymphoid infiltrate [OR: 2.03 (95% CI: 1.13–3.63); p=0.017], micropapillary and solid ADC [OR: 1.77 (95% CI: 1.16–2.71); p=0.008] (Supplementary Table S3).
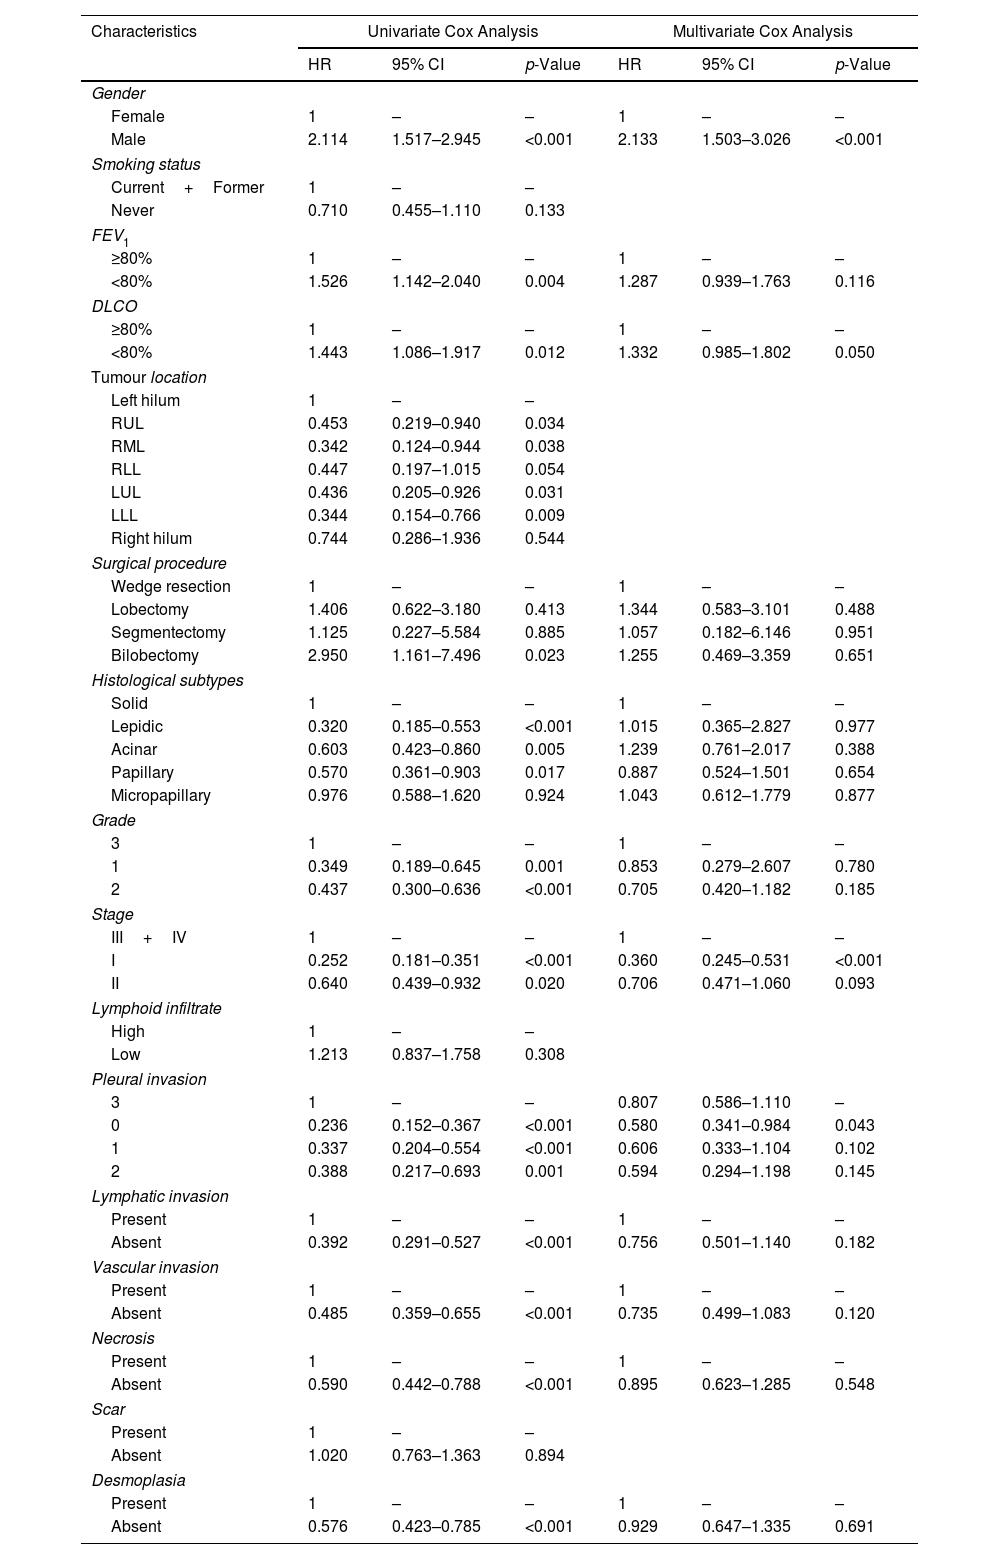
Univariate and Multivariate Analyses of PrognosisAt Kaplan–Meier analysis, gender, FEV1, DLCO, type of surgical procedure, histological subtypes, tumour stage, tumour grade, desmoplasia, necrosis, pleural, vascular and lymphatic invasion, were significantly associated to OS (Figs. 2–4). At Cox univariate analyses, gender, DLCO, FEV1, surgical procedure, histological subtypes, tumour grade and stage, pleural, lymphatic and vascular invasion, tumour necrosis and desmoplasia were significantly associated to OS. Cox multivariate analysis confirmed that gender and tumour stage were independent prognostic factors for OS, with male [HR: 2.133 (95% CI: 1.503–3.026); p<0.001], and stage 3+4 disease [HR: 0.360 (95% CI: 0.245–0.531); p<0.001] were significantly associated with poorer OS (Table 4). In addition to this, DLCOlow was correlated with a worse OS even if with a borderline statistical significance [HR: 1.332 (95% CI: 0.985–1.802); p: 0.050].


OS Univariate and Multivariate Cox Regression Analysis.
| Characteristics | Univariate Cox Analysis | Multivariate Cox Analysis | ||||
|---|---|---|---|---|---|---|
| HR | 95% CI | p-Value | HR | 95% CI | p-Value | |
| Gender | ||||||
| Female | 1 | – | – | 1 | – | – |
| Male | 2.114 | 1.517–2.945 | <0.001 | 2.133 | 1.503–3.026 | <0.001 |
| Smoking status | ||||||
| Current+Former | 1 | – | – | |||
| Never | 0.710 | 0.455–1.110 | 0.133 | |||
| FEV1 | ||||||
| ≥80% | 1 | – | – | 1 | – | – |
| <80% | 1.526 | 1.142–2.040 | 0.004 | 1.287 | 0.939–1.763 | 0.116 |
| DLCO | ||||||
| ≥80% | 1 | – | – | 1 | – | – |
| <80% | 1.443 | 1.086–1.917 | 0.012 | 1.332 | 0.985–1.802 | 0.050 |
| Tumour location | ||||||
| Left hilum | 1 | – | – | |||
| RUL | 0.453 | 0.219–0.940 | 0.034 | |||
| RML | 0.342 | 0.124–0.944 | 0.038 | |||
| RLL | 0.447 | 0.197–1.015 | 0.054 | |||
| LUL | 0.436 | 0.205–0.926 | 0.031 | |||
| LLL | 0.344 | 0.154–0.766 | 0.009 | |||
| Right hilum | 0.744 | 0.286–1.936 | 0.544 | |||
| Surgical procedure | ||||||
| Wedge resection | 1 | – | – | 1 | – | – |
| Lobectomy | 1.406 | 0.622–3.180 | 0.413 | 1.344 | 0.583–3.101 | 0.488 |
| Segmentectomy | 1.125 | 0.227–5.584 | 0.885 | 1.057 | 0.182–6.146 | 0.951 |
| Bilobectomy | 2.950 | 1.161–7.496 | 0.023 | 1.255 | 0.469–3.359 | 0.651 |
| Histological subtypes | ||||||
| Solid | 1 | – | – | 1 | – | – |
| Lepidic | 0.320 | 0.185–0.553 | <0.001 | 1.015 | 0.365–2.827 | 0.977 |
| Acinar | 0.603 | 0.423–0.860 | 0.005 | 1.239 | 0.761–2.017 | 0.388 |
| Papillary | 0.570 | 0.361–0.903 | 0.017 | 0.887 | 0.524–1.501 | 0.654 |
| Micropapillary | 0.976 | 0.588–1.620 | 0.924 | 1.043 | 0.612–1.779 | 0.877 |
| Grade | ||||||
| 3 | 1 | – | – | 1 | – | – |
| 1 | 0.349 | 0.189–0.645 | 0.001 | 0.853 | 0.279–2.607 | 0.780 |
| 2 | 0.437 | 0.300–0.636 | <0.001 | 0.705 | 0.420–1.182 | 0.185 |
| Stage | ||||||
| III+IV | 1 | – | – | 1 | – | – |
| I | 0.252 | 0.181–0.351 | <0.001 | 0.360 | 0.245–0.531 | <0.001 |
| II | 0.640 | 0.439–0.932 | 0.020 | 0.706 | 0.471–1.060 | 0.093 |
| Lymphoid infiltrate | ||||||
| High | 1 | – | – | |||
| Low | 1.213 | 0.837–1.758 | 0.308 | |||
| Pleural invasion | ||||||
| 3 | 1 | – | – | 0.807 | 0.586–1.110 | – |
| 0 | 0.236 | 0.152–0.367 | <0.001 | 0.580 | 0.341–0.984 | 0.043 |
| 1 | 0.337 | 0.204–0.554 | <0.001 | 0.606 | 0.333–1.104 | 0.102 |
| 2 | 0.388 | 0.217–0.693 | 0.001 | 0.594 | 0.294–1.198 | 0.145 |
| Lymphatic invasion | ||||||
| Present | 1 | – | – | 1 | – | – |
| Absent | 0.392 | 0.291–0.527 | <0.001 | 0.756 | 0.501–1.140 | 0.182 |
| Vascular invasion | ||||||
| Present | 1 | – | – | 1 | – | – |
| Absent | 0.485 | 0.359–0.655 | <0.001 | 0.735 | 0.499–1.083 | 0.120 |
| Necrosis | ||||||
| Present | 1 | – | – | 1 | – | – |
| Absent | 0.590 | 0.442–0.788 | <0.001 | 0.895 | 0.623–1.285 | 0.548 |
| Scar | ||||||
| Present | 1 | – | – | |||
| Absent | 1.020 | 0.763–1.363 | 0.894 | |||
| Desmoplasia | ||||||
| Present | 1 | – | – | 1 | – | – |
| Absent | 0.576 | 0.423–0.785 | <0.001 | 0.929 | 0.647–1.335 | 0.691 |
DLCO: diffusing capacity of the lungs for carbon monoxide; FEV1: forced expiratory volume in 1s.
To the best of our knowledge, this is the first study testing the relationship between DLCO and ADC patterns, each of them having different levels of aggressiveness, as already extensively reported in the literature.14–17 We have also found a correlation between the DLCO and tumour grade, presence of tumour lymphoid infiltrate and tumour desmoplasia.
DLCO and Tumour Lymphoid InfiltrateRegarding the tumour lymphoid infiltrate, it is well known that a prominent infiltration of cytotoxic T cells, high TILs density and tumour microenvironment rich in inflammatory cytokines, have higher probability to have a good response to immunotherapy and better survival. In our population, we retrospectively considered surgical patients and none of them received this kind of treatment. However, even if not statistically significant, we have seen that those patients with higher lymphoid infiltrate had better OS. This clearly demonstrates that a high inflammatory infiltrate can predispose to a better oncological outcome. On the other hand, we postulate that the inverse correlation between DLCO and tumour lymphoid infiltrate might follow the transition of pro-inflammatory lymphocytic features towards the development of fibrotic tissue, which would then cause a damage of the alveolar–capillary barrier, reducing DLCO.28,29 On the contrary, we have found an inverse correlation between DLCO and OS, and this result has already been reported in the literature.2–12 However, being a low DLCO related to several diseases, and mainly, the emphysematous lung pattern in COPD patients,1 we do not think that the inverse correlation we found between DLCO and lymphoid infiltrate is contradictory because the lower OS in patient with low DLCO can be mostly related to concurrent pulmonary diseases, such as COPD.
DLCO, FEV1 and Tumour DesmoplasiaIn a tumour environment, the tumour-induced proliferation of alpha-smooth muscle actin-positive fibroblasts is associated with an increased deposition of extracellular matrix components.30 These structural modifications might explain the relationship between DLCO status and tumour desmoplasia, as heterogeneous pulmonary structures with elastic changes would result in a damaged blood–air barrier. Ozeki et al. reported that FEV1 was not correlated with histopathological indexes23; on the other hand, in our study FEV1 predicted presence of desmoplasia (obstructive and restrictive respiratory syndrome tumour-induced?), as well as micropapillary and solid ADC.
Furthermore, smoking status was associated with high lymphoid infiltrate (smoke-related inflammatory phenomenon?).
DLCO and Lung ADC PatternsIn a previous study, Ozeki et al. reported a relationship between DLCO and histopathological aggressiveness of lung ADC, and in particular, with tumour differentiation, mitotic index, scar grade and nuclear atypia.23
In keeping with Ozeki et al., our study supports the observation that increased lung damage – as quantified by reduced DLCO – might promote carcinogenesis of lung ADC, and in particular modifications from a low-grade to a high-grade ADC. A damaged lung tissue may generate a ‘field cancerization effect’ leading to lung cancer through a multistep process. Indeed, chronic inflammation caused by emphysema or fibrosis causes epithelial cell injury, high cell turnover rates, and propagation of DNA errors, thereby promoting carcinogenesis.31 Furthermore, low DLCO values may facilitate oxygen deprivation, prompting the expression of hypoxia-inducible factors (HIFs), which has been associated with tumour aggressiveness and metastasis in lung cancer.32 Moreover, hypoxia is also known to have extensive crosstalk with signalling pathways linked to inflammation.33,34
On the other hand, we can also speculate how different histological ADCs pattern can impact on the alveolo-capillary barrier, affecting the DLCO value. In the lepidic pattern, where we have neoplastic cells resembling bland type II pneumocytes growing along the surface of the alveolar air spaces, we can potentially have a higher DLCO value compared to the micropapillary and solid pattern where the alveolar space is occupied by tumour cells. In the latter case, the gas exchange surface can be reduced and, consequently, the DLCO value.
LimitationsOur study has several limitations. First, it was retrospective and conducted in a single institution, including patients treated during a long-time interval. Second, data regarding the molecular profile of the tumour, such as driver mutation status, and the type of tumour lymphoid infiltrate were not available. Similarly, albeit through cardiac assessment (electrocardiography, echocardiogram) we were able to exclude concomitant conditions such as pulmonary hypertension, other information on comorbidities potentially influencing DLCO such as chronic obstructive pulmonary disease or idiopathic pulmonary fibrosis were not available. Thus, impaired DLCO values in lung cancer patients may suggest not only lung damage but also the possibility of co-existing comorbidities. These comorbidities may confound the impact of DLCO on the carcinogenesis of lung cancer and they should be carefully assessed for their relation to the occurrence of lung cancer. In addition to this, data about neoadjuvants and adjuvants treatments, in particular neoadjuvant chemotherapy (that could potentially affect the DLCO value) were not available. Finally, data about recurrence rate and the recurrence-free survival were not available and, for this reason, we decided to consider only the OS.
ConclusionBased on our results, DLCO can be considered a predictive marker of lung ADC aggressiveness and the relationship between DLCO and ADC patterns as well as tumour grade, presence of tumour lymphoid infiltrate and tumour desmoplasia, may suggest that damaged lung parenchyma with low DLCO can be associated with tumour carcinogenesis.
Ethics approvalThis study was performed in line with the principles of the Declaration of Helsinki.
FundingNone declared.
Conflict of interestNone declared.
The following are the supplementary data to this article:
Meeting presentation: Brompton Session I, 29th European Society of Thoracic Surgeons Meeting, 20–22 June 2021.


