Exercise intolerance significantly impacts quality of life, morbidity, and mortality in chronic obstructive pulmonary disease (COPD). While ventilation and perfusion disorders are crucial in explaining exercise intolerance, peripheral muscle dysfunction also plays a key role.1 Many studies on COPD-related peripheral muscle dysfunction focus on the quadriceps muscle, revealing that low muscle strength may be linked to exercise intolerance and poor prognosis.2,3
In studies on the quadriceps muscle in COPD patients, bicycle ergometers have been primarily used to evaluate muscle fatigue.4,5 In daily practice, the 6-minute walk test (6MWT) is used more frequently to evaluate the relationship between pulmonary and pulmonovascular diseases and exercise capacity.6 Peripheral muscle groups that play a role in flexion, inversion, and plantar flexion of the foot are more involved in the continuity of the walking action.7
The gastrocnemius muscle (GM) is a peripheral extremity muscle that is important in walking.8,9 In our study, we examined the measurement of GM by shear wave elastography (SWE) in COPD patients and its relationship with oxygenation levels, respiratory function test (PFT) parameters, and 6MWT results. This research aims to enhance management and rehabilitation strategies for COPD by improving our understanding of muscle functions and exercise tolerance in these patients.
The study involved 20 patients over 40 with group E COPD and 20 healthy controls, all with right dominant feet. Conducted at XXX University Chest Diseases Clinic (December 2023–March 2024). COPD diagnosis was confirmed via postbronchodilator PFT (Cosmed Q-Box Body Plethysmography). Patients had FEV1/FVC ratio<70%, stable for four weeks, and fingertip saturation>85% on room air. Records from the hospital or e-Nabiz were reviewed for systemic steroid therapy equivalent to 8mg/day methylprednisolone. Group E classification required two or more acute exacerbations or one hospitalization. Patients unable to perform PFT and 6MWT or with lower extremity thrombophlebitis were excluded.
All SWE examinations used an ultrasonography device (Epiq Elite, Philips Medical Systems) with a 22-2MHz transducer. The transducer was gently applied to the hydrogel-covered skin to avoid compression bias. Measurements were taken at the posteromedial section of the cruris, where the GM is thickest. Three 2mm region of interests were placed within the SWE window, and their shear modulus data were recorded in kilopascals (kPa). After SWE, a near-infrared spectroscopy probe (MOXY, Minnesota, USA) was fixed to the GM abdomen. Measurements were taken with the leg in neutral and dorsiflexed positions for one minute each, starting with the right leg.
IBM SPSS Statistics for Windows version 22.0 (IBM Corp., Armonk, NY) was used for statistical analyses. G*Power analysis determined the sample size (p<0.05, d=0.50), requiring a minimum of 20 patients. Pearson's Chi-square test was used for parametric data comparisons between groups, and the Mann–Whitney U test was used for non-normally distributed data. The Kruskal–Wallis test compared demographic data and laboratory parameters, while an independent sample t-test analyzed parameters with significant Kruskal–Wallis test results. Multivariate analysis used the MANOVA test, and Spearman correlation analysis compared laboratory parameters and radiological scores. A p-value<0.05 was considered statistically significant.
The average age of COPD patients was 63.2±11.8 years, and the control group was 61.6±12.3 years. In the COPD group, 60% were male, while in the control group, 55% were male. Statistical analysis showed no significant difference in age (p=0.22) and gender (p=0.8) between the groups.
No statistical differences were observed in height (p=0.45), weight (p=0.9), and BMI (p=0.28) between the groups. However, FVC%, FEV1%, and FEV1/FVC values were significantly higher in the control group (p<0.05 for all).
In the COPD group, no significant gender differences were observed in right and left GM SWE (p=0.57, 0.78), while the control group showed higher SWE levels in men (p=0.05, p=0.01).
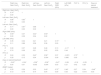
In the control group, the correlation of bilateral GM minimum and maximum SmO2, bilateral SWE, and 6MWT was positive, with a correlation between right GM SWE and 6MWT (R=0.89, p=0.01) and left GM SWE and 6MWT (R=0.76, p=0.01). A positive correlation was also observed between right maximum SmO2 and 6MWT (R=0.8, p=0.01). Table 1 shows the correlation of bilateral GM minimum and maximum SmO2, bilateral SWE, PFT parameters, 6MWT, Borg dyspnea score, and the number of days of steroid treatment in COPD patients. It was observed that right and left maximum and minimum SmO2 were negatively correlated with the number of days of steroid treatment (Right Gast.: R=−0.63, p=0.01, R=−0.54, p=0.01, Left Gast.: R=−0.58, p=0.01, R=−0.58, p=0.01).
Correlation analysis between muscle oxygenation, SWE, PFT parameters and 6MWT distances in COPD patients.
| Right max. Gast. SmO2 | Right min. Gast. SmO2 | Left max. Gast. SmO2 | Left min. Gast. SmO2 | Right SWE (kPa) | Left SWE (kPa) | FVC % | FEV1% | Days on steroid treatment | |
|---|---|---|---|---|---|---|---|---|---|
| Right min. Gast. SmO2 | |||||||||
| R | 0.74** | 1 | |||||||
| p | 0.00 | ||||||||
| Left max. Gast. SmO2 | |||||||||
| R | 0.86** | 0.83** | 1 | ||||||
| p | 0.00 | 0.00 | |||||||
| Left min. Gast. SmO2 | |||||||||
| R | 0.71** | 0.87** | 0.88 | 1 | |||||
| p | 0.00 | 0.00 | 0.00 | ||||||
| Right SWE (kPa) | |||||||||
| R | 0.59** | 0.37 | 0.44* | 0.50* | 1 | ||||
| p | 0.00 | 0.09 | 0.04 | 0.02 | |||||
| Left SWE (kPa) | |||||||||
| R | 0.35 | 0.04 | 0.21 | 0.21 | 0.73** | 1 | |||
| p | 0.11 | 0.88 | 0.36 | 0.36 | 0.00 | ||||
| FVC % | |||||||||
| R | 0.08 | 0.37 | 0.28 | 0.48 | 0.13 | −0.17 | 1 | ||
| p | 0.74 | 0.09 | 0.21 | 0.02 | 0.55 | 0.44 | |||
| FEV1% | |||||||||
| R | 0.24 | 0.33 | 0.45* | 0.58** | 0.37 | −0.001 | 0.75** | 1 | |
| p | 0.29 | 0.13 | 0.04 | 0.004 | 0.09 | 0.996 | 0.00 | ||
| Days on steroid treatment | |||||||||
| R | −0.63** | −0.54* | −0.58** | −0.58** | −0.47* | −0.28 | −0.18 | −0.25 | 1 |
| p | 0.00 | 0.01 | 0.005 | 0.004 | 0.03 | 0.21 | 0.42 | 0.26 | |
| 6MWT (meter) | |||||||||
| R | 0.33 | 0.29 | 0.33 | 0.45* | 0.72** | 0.46* | 0.27 | 0.54 | −0.48** |
| p | 0.13 | 0.19 | 0.14 | 0.04 | 0.00 | 0.03 | 0.22 | 0.010 | 0.03 |
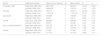
Table 2 shows a multivariate analysis of right and left GM SWE levels in the COPD and control groups with age, gender, and number of days of steroid treatment. The right GM SWE level showed a statistically significant difference with both the number of days of steroid use (p=0.01) and gender (p=0.02).
Multivariate analysis of right and left GM SWE levels in the COPD and control groups.
| Source | Dependent variable | Type III sum of squares | df | Mean square | F | p |
|---|---|---|---|---|---|---|
| Corrected model | Right Gast. SWE (kPa) | 2507.365a | 4 | 626.841 | 14.276 | 0.001 |
| Left Gast. SWE (kPa) | 1898.605b | 4 | 474.651 | 7.412 | 0.001 | |
| Intercept | Right Gast. SWE (kPa) | 1924.77 | 1 | 1924.77 | 43.834 | 0.001 |
| Left Gast. SWE (kPa) | 1.743.136 | 1 | 1.743.136 | 27.221 | 0.001 | |
| Age (years) | Right Gast. SWE (kPa) | 105.659 | 1 | 105.659 | 2.406 | 0.13 |
| Left Gast. SWE (kPa) | 153.37 | 1 | 153.37 | 2.395 | 0.13 | |
| Gender | Right Gast. SWE (kPa) | 268.662 | 1 | 268.662 | 6.118 | 0.02 |
| Left Gast. SWE (kPa) | 99.094 | 1 | 99.094 | 1.547 | 0.22 | |
| Days on steroid treatment | Right Gast. SWE (kPa) | 320.136 | 1 | 320.136 | 7.291 | 0.01 |
| Left Gast. SWE (kPa) | 104.907 | 1 | 104.907 | 1.638 | 0.21 | |
| Groups | Right Gast. SWE (kPa) | 77.346 | 1 | 77.346 | 1.761 | 0.19 |
| Left Gast. SWE (kPa) | 151.016 | 1 | 151.016 | 2.358 | 0.13 | |
6MWT is more practical than the bicycle ergometer in assessing exercise capacity in COPD patients.10 The quadriceps muscle has been frequently used in studies on muscle strength and exercise capacity.9 However, the bicycle ergometer did not show as much of a relationship with fatigue as the walking test.11 It has also been observed that the muscles that contribute to dorsal and plantar flexion from the peripheral extremities are more prone to fatigue in walking.12 In addition, Type 2 muscle fibers, which are involved in forced breathing, are more dense in the GM, making them more susceptible to fatigue.13 These factors were effective in choosing GM in our study.14
In the correlation analysis performed in the control group, bilateral GM SWE levels were highly correlated with the 6MWT. However, this correlation decreased and remained statistically significant in the COPD group. Additionally, the correlation between SmO2 level and 6MWT in the control group was not observed in the COPD group. PFT parameters, strength level in respiratory muscles and other muscles affecting walking, and dyspnea level may also have affected the decrease in 6MWT level in COPD patients. Additionally, steroid treatment applied to COPD patients may have affected the SmO2 level and GM SWE level, causing a decrease in the correlation compared to the control group. In multivariate analysis, the effect of the number of days of steroid treatment on SWE level confirms this. The higher level of SWE in men in the control group may have affected the relationship between gender and SWE level. The dominance of this foot may have played a role in the higher right foot correlation in the groups.
The evaluation of GM oxygenation and SWE levels was focused on group E COPD patients. Studies including group A and B COPD patients can support these results. Additionally, gender effects on SWE must be considered for this group, which actively uses peripheral extremity muscles.
As a result, steroid treatment applied to group E COPD patients affects the GM SWE level less than the SmO2 level. It evaluates individuals’ 6MWT levels better than PFT and SmO2 levels. Therefore, GM SWE may be a follow-up parameter that can be used to evaluate patients’ exercise capacity.
Ethical approvalAll procedures performed in studies involving human participants were in accordance with the ethical standards of the institutional and/or national research committee and with the 1964 Helsinki declaration and its later amendments or comparable ethical standards. The research protocol was approved by the XXX University Ethics Committee (B.30.2.ATA.0.01.00/427).
FundingThe study was supported by the Research Fund of Ataturk University (Project Number: 11581).
Informed consentInformed consent was obtained from all individual participants included in the study.
Conflict of interestThe authors declare that they have no conflict of interest to the publication of this article.