
With the progression of the coronavirus disease 2019 pandemic (COVID-19), evidence has pointed critically ill survivors as one of the populations most at risk of experiencing long-term impairment and persistent COVID-19 symptoms.1,2 Despite the large number of ICU admissions that COVID-19 has caused and the impact of this on health care systems worldwide,3 ICU patient cohorts remain underrepresented in studies of COVID-19 survivors.1 Additionally, studies focusing on post-ICU COVID-19 patients are limited to one-year follow-up periods without exploring all health care outcome domains and their trajectories.2–4 For these reasons, our objective was to explore 24-month health outcomes in a cohort of patients who required ICU admission to describe the longitudinal progress of (1) pulmonary function tests, (2) radiological abnormalities, (3) symptoms and (3) quality of life, as well as to determine their (4) impact on health care resources consumption during the follow-up. This was a prospective observational study among patients who required ICU admission due to severe COVID-19 between March and December 2020 at the University Hospitals Arnau de Vilanova and Santa Maria of Lleida, Catalonia, Spain. This study was a substudy of the CIBERESUCICOVID study (ClinicalTrials.gov Identifier: NCT04457505) and details of the protocol and follow-up were previously described.5–7
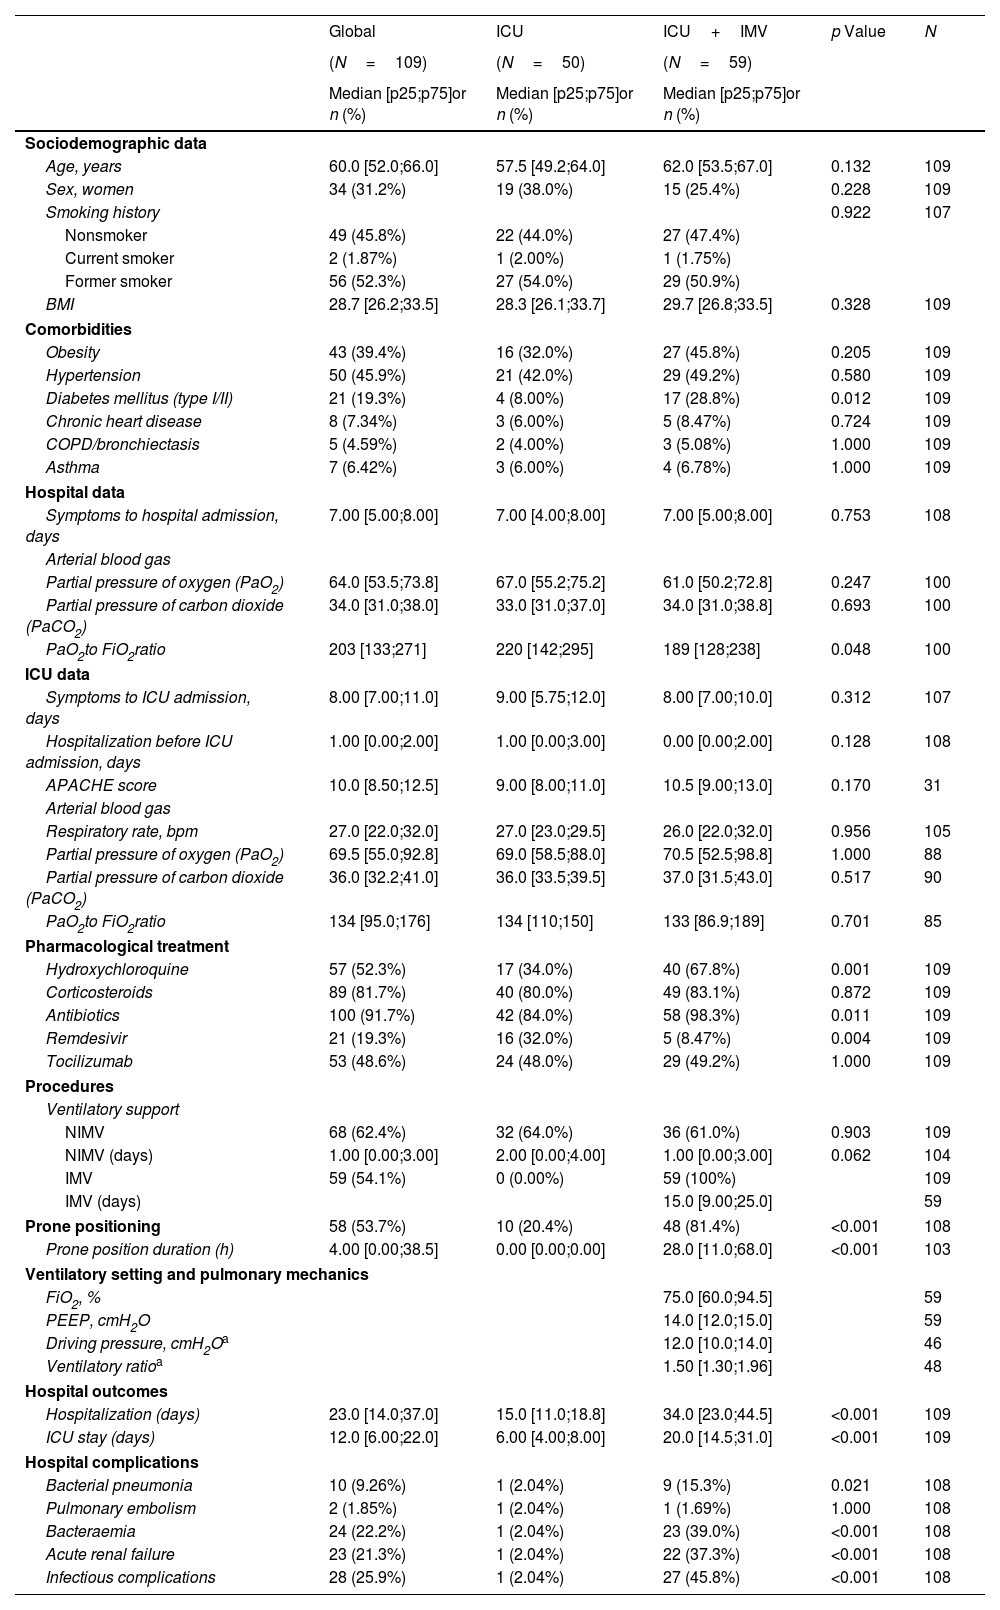
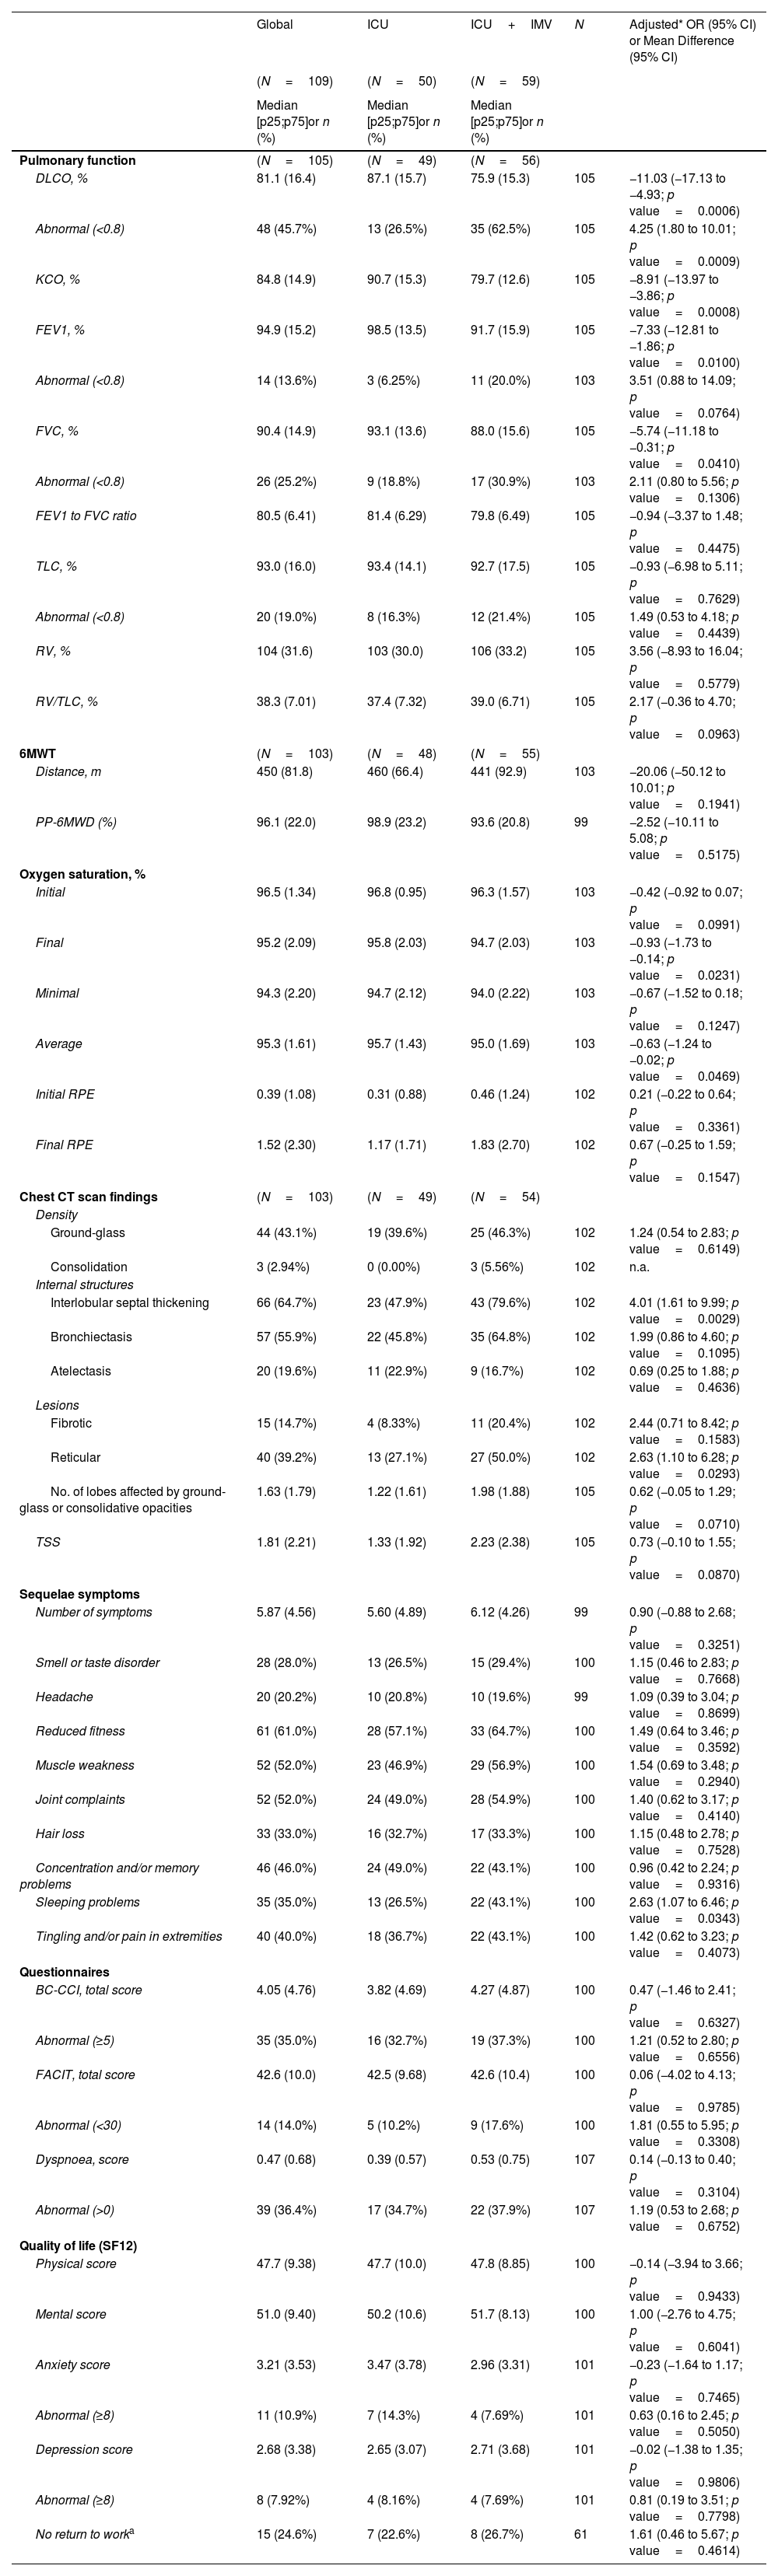
During the study period, a total of 209 critical COVID-19 patients survived, and 180 were eligible to be followed in the post-COVID consultation. Patients were evaluated at 6, 12 and 24 months after hospital discharge. Finally, 109 completed all visits over 24 months after hospital discharge. Five patients died during the follow-up. Baseline characteristics and ICU data are summarized in Table 1A. Over 2 years, patients showed a progressive recovery of lung function and exercise capacity (Fig. 1). However, at 24 months, there were still 45.7% with impairment in lung diffusing capacity (DLCO), and 18.7% of them was moderate to severe (Table 1A). Importantly, patients who required invasive mechanical ventilation (IMV) showed worse DLCO values with an adjusted difference (95% confidence interval (CI)) of −11.03% (−17.03 to −4.93; p<0.001) compared to non-intubated patients. Furthermore, these patients had a higher risk of presenting impairment of other lung function parameters and in the six-minute walking test (6MWT) (Table 1B). Something similar happens regarding radiological abnormalities (Table 1B and Fig. 1). At 2 years, more than half of the patients (53.9%) presented some type of lesion (39.2% reticular lesions and 12.7% fibrotic involvement). Again, pulmonary lesions were more prevalent among intubated patients, with an adjusted odds ratio (OR) (95% CI) of 2.63 (1.10–6.28; p value=0.0293) for reticular lesions and 4.01 (1.61–9.99; p value=0.0029) for interlobular septal thickening. The fibrotic pattern was more frequent among intubated patients (20.4% vs. 8.3%), and the mean (SD) total severity score (TSS) was higher (2.23 [2.38] vs. 1.33 [1.92]) (Table 1B).
Baseline Sociodemographic and Clinical Characteristics (at Hospital and ICU Admission) According to Invasive Mechanical Ventilation Requirement at the 24-Month Follow-up Visit.
| Global | ICU | ICU+IMV | p Value | N | |
|---|---|---|---|---|---|
| (N=109) | (N=50) | (N=59) | |||
| Median [p25;p75]or n (%) | Median [p25;p75]or n (%) | Median [p25;p75]or n (%) | |||
| Sociodemographic data | |||||
| Age, years | 60.0 [52.0;66.0] | 57.5 [49.2;64.0] | 62.0 [53.5;67.0] | 0.132 | 109 |
| Sex, women | 34 (31.2%) | 19 (38.0%) | 15 (25.4%) | 0.228 | 109 |
| Smoking history | 0.922 | 107 | |||
| Nonsmoker | 49 (45.8%) | 22 (44.0%) | 27 (47.4%) | ||
| Current smoker | 2 (1.87%) | 1 (2.00%) | 1 (1.75%) | ||
| Former smoker | 56 (52.3%) | 27 (54.0%) | 29 (50.9%) | ||
| BMI | 28.7 [26.2;33.5] | 28.3 [26.1;33.7] | 29.7 [26.8;33.5] | 0.328 | 109 |
| Comorbidities | |||||
| Obesity | 43 (39.4%) | 16 (32.0%) | 27 (45.8%) | 0.205 | 109 |
| Hypertension | 50 (45.9%) | 21 (42.0%) | 29 (49.2%) | 0.580 | 109 |
| Diabetes mellitus (type I/II) | 21 (19.3%) | 4 (8.00%) | 17 (28.8%) | 0.012 | 109 |
| Chronic heart disease | 8 (7.34%) | 3 (6.00%) | 5 (8.47%) | 0.724 | 109 |
| COPD/bronchiectasis | 5 (4.59%) | 2 (4.00%) | 3 (5.08%) | 1.000 | 109 |
| Asthma | 7 (6.42%) | 3 (6.00%) | 4 (6.78%) | 1.000 | 109 |
| Hospital data | |||||
| Symptoms to hospital admission, days | 7.00 [5.00;8.00] | 7.00 [4.00;8.00] | 7.00 [5.00;8.00] | 0.753 | 108 |
| Arterial blood gas | |||||
| Partial pressure of oxygen (PaO2) | 64.0 [53.5;73.8] | 67.0 [55.2;75.2] | 61.0 [50.2;72.8] | 0.247 | 100 |
| Partial pressure of carbon dioxide (PaCO2) | 34.0 [31.0;38.0] | 33.0 [31.0;37.0] | 34.0 [31.0;38.8] | 0.693 | 100 |
| PaO2to FiO2ratio | 203 [133;271] | 220 [142;295] | 189 [128;238] | 0.048 | 100 |
| ICU data | |||||
| Symptoms to ICU admission, days | 8.00 [7.00;11.0] | 9.00 [5.75;12.0] | 8.00 [7.00;10.0] | 0.312 | 107 |
| Hospitalization before ICU admission, days | 1.00 [0.00;2.00] | 1.00 [0.00;3.00] | 0.00 [0.00;2.00] | 0.128 | 108 |
| APACHE score | 10.0 [8.50;12.5] | 9.00 [8.00;11.0] | 10.5 [9.00;13.0] | 0.170 | 31 |
| Arterial blood gas | |||||
| Respiratory rate, bpm | 27.0 [22.0;32.0] | 27.0 [23.0;29.5] | 26.0 [22.0;32.0] | 0.956 | 105 |
| Partial pressure of oxygen (PaO2) | 69.5 [55.0;92.8] | 69.0 [58.5;88.0] | 70.5 [52.5;98.8] | 1.000 | 88 |
| Partial pressure of carbon dioxide (PaCO2) | 36.0 [32.2;41.0] | 36.0 [33.5;39.5] | 37.0 [31.5;43.0] | 0.517 | 90 |
| PaO2to FiO2ratio | 134 [95.0;176] | 134 [110;150] | 133 [86.9;189] | 0.701 | 85 |
| Pharmacological treatment | |||||
| Hydroxychloroquine | 57 (52.3%) | 17 (34.0%) | 40 (67.8%) | 0.001 | 109 |
| Corticosteroids | 89 (81.7%) | 40 (80.0%) | 49 (83.1%) | 0.872 | 109 |
| Antibiotics | 100 (91.7%) | 42 (84.0%) | 58 (98.3%) | 0.011 | 109 |
| Remdesivir | 21 (19.3%) | 16 (32.0%) | 5 (8.47%) | 0.004 | 109 |
| Tocilizumab | 53 (48.6%) | 24 (48.0%) | 29 (49.2%) | 1.000 | 109 |
| Procedures | |||||
| Ventilatory support | |||||
| NIMV | 68 (62.4%) | 32 (64.0%) | 36 (61.0%) | 0.903 | 109 |
| NIMV (days) | 1.00 [0.00;3.00] | 2.00 [0.00;4.00] | 1.00 [0.00;3.00] | 0.062 | 104 |
| IMV | 59 (54.1%) | 0 (0.00%) | 59 (100%) | 109 | |
| IMV (days) | 15.0 [9.00;25.0] | 59 | |||
| Prone positioning | 58 (53.7%) | 10 (20.4%) | 48 (81.4%) | <0.001 | 108 |
| Prone position duration (h) | 4.00 [0.00;38.5] | 0.00 [0.00;0.00] | 28.0 [11.0;68.0] | <0.001 | 103 |
| Ventilatory setting and pulmonary mechanics | |||||
| FiO2, % | 75.0 [60.0;94.5] | 59 | |||
| PEEP, cmH2O | 14.0 [12.0;15.0] | 59 | |||
| Driving pressure, cmH2Oa | 12.0 [10.0;14.0] | 46 | |||
| Ventilatory ratioa | 1.50 [1.30;1.96] | 48 | |||
| Hospital outcomes | |||||
| Hospitalization (days) | 23.0 [14.0;37.0] | 15.0 [11.0;18.8] | 34.0 [23.0;44.5] | <0.001 | 109 |
| ICU stay (days) | 12.0 [6.00;22.0] | 6.00 [4.00;8.00] | 20.0 [14.5;31.0] | <0.001 | 109 |
| Hospital complications | |||||
| Bacterial pneumonia | 10 (9.26%) | 1 (2.04%) | 9 (15.3%) | 0.021 | 108 |
| Pulmonary embolism | 2 (1.85%) | 1 (2.04%) | 1 (1.69%) | 1.000 | 108 |
| Bacteraemia | 24 (22.2%) | 1 (2.04%) | 23 (39.0%) | <0.001 | 108 |
| Acute renal failure | 23 (21.3%) | 1 (2.04%) | 22 (37.3%) | <0.001 | 108 |
| Infectious complications | 28 (25.9%) | 1 (2.04%) | 27 (45.8%) | <0.001 | 108 |
Abbreviations: COPD, chronic obstructive pulmonary disease; NIMV, noninvasive mechanical ventilation; IMV, invasive mechanical ventilation.
. Estimated marginal means (±standard errors) of outcomes over time are described in the figure. Statistically significant differences between groups are indicated with an asterisk. Longitudinal progression of lung function and exercise capacity at follow-up points (3, 6, 12 and 24 months). Note: Lung function and exercise capacity parameters were classified as invasive mechanical ventilation (IMV) required (ICU+IMV) and non-intubated patients (ICU). Longitudinal progression of CT scan findings at follow-up points (3, 6, 12 and 24 months). Note: Total severity score and number of lobes affected were classified as IMV required (ICU+IMV) and non-intubated patients (ICU). Abbreviations: DLCO, diffusing capacity for carbon monoxide; IMV, invasive mechanical ventilation; KCO, carbon monoxide transfer coefficient; 6MWT, six-minute walking test; CT, computed tomography. Longitudinal progression of anxiety, depression and quality of life during the follow-up. Outcome evolution was fitted using linear mixed models that were adjusted for confounding factors (age, sex and body mass index). Estimated marginal means (±standard errors) of outcomes over time are described in the figure. Statistically significant differences between groups are indicated with an asterisk. Abbreviations: ICU, intensive care unit; IMV, invasive mechanical ventilation; HADS, Hospital Anxiety and Depression Scale.")
Longitudinal progression of outcomes according to severity. Outcome evolution was fitted using linear mixed models that were adjusted for confounding factors (age, sex and body mass index). Estimated marginal means (±standard errors) of outcomes over time are described in the figure. Statistically significant differences between groups are indicated with an asterisk. Longitudinal progression of lung function and exercise capacity at follow-up points (3, 6, 12 and 24 months). Note: Lung function and exercise capacity parameters were classified as invasive mechanical ventilation (IMV) required (ICU+IMV) and non-intubated patients (ICU). Longitudinal progression of CT scan findings at follow-up points (3, 6, 12 and 24 months). Note: Total severity score and number of lobes affected were classified as IMV required (ICU+IMV) and non-intubated patients (ICU). Abbreviations: DLCO, diffusing capacity for carbon monoxide; IMV, invasive mechanical ventilation; KCO, carbon monoxide transfer coefficient; 6MWT, six-minute walking test; CT, computed tomography. Longitudinal progression of anxiety, depression and quality of life during the follow-up. Outcome evolution was fitted using linear mixed models that were adjusted for confounding factors (age, sex and body mass index). Estimated marginal means (±standard errors) of outcomes over time are described in the figure. Statistically significant differences between groups are indicated with an asterisk. Abbreviations: ICU, intensive care unit; IMV, invasive mechanical ventilation; HADS, Hospital Anxiety and Depression Scale.
Pulmonary Function, Exercise Test, CT Findings, Symptoms and Quality of Life, Anxiety, and Depression Questionnaire Results at the 24-Month Follow-up Visit.
| Global | ICU | ICU+IMV | N | Adjusted* OR (95% CI) or Mean Difference (95% CI) | |
|---|---|---|---|---|---|
| (N=109) | (N=50) | (N=59) | |||
| Median [p25;p75]or n (%) | Median [p25;p75]or n (%) | Median [p25;p75]or n (%) | |||
| Pulmonary function | (N=105) | (N=49) | (N=56) | ||
| DLCO, % | 81.1 (16.4) | 87.1 (15.7) | 75.9 (15.3) | 105 | −11.03 (−17.13 to −4.93; p value=0.0006) |
| Abnormal (<0.8) | 48 (45.7%) | 13 (26.5%) | 35 (62.5%) | 105 | 4.25 (1.80 to 10.01; p value=0.0009) |
| KCO, % | 84.8 (14.9) | 90.7 (15.3) | 79.7 (12.6) | 105 | −8.91 (−13.97 to −3.86; p value=0.0008) |
| FEV1, % | 94.9 (15.2) | 98.5 (13.5) | 91.7 (15.9) | 105 | −7.33 (−12.81 to −1.86; p value=0.0100) |
| Abnormal (<0.8) | 14 (13.6%) | 3 (6.25%) | 11 (20.0%) | 103 | 3.51 (0.88 to 14.09; p value=0.0764) |
| FVC, % | 90.4 (14.9) | 93.1 (13.6) | 88.0 (15.6) | 105 | −5.74 (−11.18 to −0.31; p value=0.0410) |
| Abnormal (<0.8) | 26 (25.2%) | 9 (18.8%) | 17 (30.9%) | 103 | 2.11 (0.80 to 5.56; p value=0.1306) |
| FEV1 to FVC ratio | 80.5 (6.41) | 81.4 (6.29) | 79.8 (6.49) | 105 | −0.94 (−3.37 to 1.48; p value=0.4475) |
| TLC, % | 93.0 (16.0) | 93.4 (14.1) | 92.7 (17.5) | 105 | −0.93 (−6.98 to 5.11; p value=0.7629) |
| Abnormal (<0.8) | 20 (19.0%) | 8 (16.3%) | 12 (21.4%) | 105 | 1.49 (0.53 to 4.18; p value=0.4439) |
| RV, % | 104 (31.6) | 103 (30.0) | 106 (33.2) | 105 | 3.56 (−8.93 to 16.04; p value=0.5779) |
| RV/TLC, % | 38.3 (7.01) | 37.4 (7.32) | 39.0 (6.71) | 105 | 2.17 (−0.36 to 4.70; p value=0.0963) |
| 6MWT | (N=103) | (N=48) | (N=55) | ||
| Distance, m | 450 (81.8) | 460 (66.4) | 441 (92.9) | 103 | −20.06 (−50.12 to 10.01; p value=0.1941) |
| PP-6MWD (%) | 96.1 (22.0) | 98.9 (23.2) | 93.6 (20.8) | 99 | −2.52 (−10.11 to 5.08; p value=0.5175) |
| Oxygen saturation, % | |||||
| Initial | 96.5 (1.34) | 96.8 (0.95) | 96.3 (1.57) | 103 | −0.42 (−0.92 to 0.07; p value=0.0991) |
| Final | 95.2 (2.09) | 95.8 (2.03) | 94.7 (2.03) | 103 | −0.93 (−1.73 to −0.14; p value=0.0231) |
| Minimal | 94.3 (2.20) | 94.7 (2.12) | 94.0 (2.22) | 103 | −0.67 (−1.52 to 0.18; p value=0.1247) |
| Average | 95.3 (1.61) | 95.7 (1.43) | 95.0 (1.69) | 103 | −0.63 (−1.24 to −0.02; p value=0.0469) |
| Initial RPE | 0.39 (1.08) | 0.31 (0.88) | 0.46 (1.24) | 102 | 0.21 (−0.22 to 0.64; p value=0.3361) |
| Final RPE | 1.52 (2.30) | 1.17 (1.71) | 1.83 (2.70) | 102 | 0.67 (−0.25 to 1.59; p value=0.1547) |
| Chest CT scan findings | (N=103) | (N=49) | (N=54) | ||
| Density | |||||
| Ground-glass | 44 (43.1%) | 19 (39.6%) | 25 (46.3%) | 102 | 1.24 (0.54 to 2.83; p value=0.6149) |
| Consolidation | 3 (2.94%) | 0 (0.00%) | 3 (5.56%) | 102 | n.a. |
| Internal structures | |||||
| Interlobular septal thickening | 66 (64.7%) | 23 (47.9%) | 43 (79.6%) | 102 | 4.01 (1.61 to 9.99; p value=0.0029) |
| Bronchiectasis | 57 (55.9%) | 22 (45.8%) | 35 (64.8%) | 102 | 1.99 (0.86 to 4.60; p value=0.1095) |
| Atelectasis | 20 (19.6%) | 11 (22.9%) | 9 (16.7%) | 102 | 0.69 (0.25 to 1.88; p value=0.4636) |
| Lesions | |||||
| Fibrotic | 15 (14.7%) | 4 (8.33%) | 11 (20.4%) | 102 | 2.44 (0.71 to 8.42; p value=0.1583) |
| Reticular | 40 (39.2%) | 13 (27.1%) | 27 (50.0%) | 102 | 2.63 (1.10 to 6.28; p value=0.0293) |
| No. of lobes affected by ground-glass or consolidative opacities | 1.63 (1.79) | 1.22 (1.61) | 1.98 (1.88) | 105 | 0.62 (−0.05 to 1.29; p value=0.0710) |
| TSS | 1.81 (2.21) | 1.33 (1.92) | 2.23 (2.38) | 105 | 0.73 (−0.10 to 1.55; p value=0.0870) |
| Sequelae symptoms | |||||
| Number of symptoms | 5.87 (4.56) | 5.60 (4.89) | 6.12 (4.26) | 99 | 0.90 (−0.88 to 2.68; p value=0.3251) |
| Smell or taste disorder | 28 (28.0%) | 13 (26.5%) | 15 (29.4%) | 100 | 1.15 (0.46 to 2.83; p value=0.7668) |
| Headache | 20 (20.2%) | 10 (20.8%) | 10 (19.6%) | 99 | 1.09 (0.39 to 3.04; p value=0.8699) |
| Reduced fitness | 61 (61.0%) | 28 (57.1%) | 33 (64.7%) | 100 | 1.49 (0.64 to 3.46; p value=0.3592) |
| Muscle weakness | 52 (52.0%) | 23 (46.9%) | 29 (56.9%) | 100 | 1.54 (0.69 to 3.48; p value=0.2940) |
| Joint complaints | 52 (52.0%) | 24 (49.0%) | 28 (54.9%) | 100 | 1.40 (0.62 to 3.17; p value=0.4140) |
| Hair loss | 33 (33.0%) | 16 (32.7%) | 17 (33.3%) | 100 | 1.15 (0.48 to 2.78; p value=0.7528) |
| Concentration and/or memory problems | 46 (46.0%) | 24 (49.0%) | 22 (43.1%) | 100 | 0.96 (0.42 to 2.24; p value=0.9316) |
| Sleeping problems | 35 (35.0%) | 13 (26.5%) | 22 (43.1%) | 100 | 2.63 (1.07 to 6.46; p value=0.0343) |
| Tingling and/or pain in extremities | 40 (40.0%) | 18 (36.7%) | 22 (43.1%) | 100 | 1.42 (0.62 to 3.23; p value=0.4073) |
| Questionnaires | |||||
| BC-CCI, total score | 4.05 (4.76) | 3.82 (4.69) | 4.27 (4.87) | 100 | 0.47 (−1.46 to 2.41; p value=0.6327) |
| Abnormal (≥5) | 35 (35.0%) | 16 (32.7%) | 19 (37.3%) | 100 | 1.21 (0.52 to 2.80; p value=0.6556) |
| FACIT, total score | 42.6 (10.0) | 42.5 (9.68) | 42.6 (10.4) | 100 | 0.06 (−4.02 to 4.13; p value=0.9785) |
| Abnormal (<30) | 14 (14.0%) | 5 (10.2%) | 9 (17.6%) | 100 | 1.81 (0.55 to 5.95; p value=0.3308) |
| Dyspnoea, score | 0.47 (0.68) | 0.39 (0.57) | 0.53 (0.75) | 107 | 0.14 (−0.13 to 0.40; p value=0.3104) |
| Abnormal (>0) | 39 (36.4%) | 17 (34.7%) | 22 (37.9%) | 107 | 1.19 (0.53 to 2.68; p value=0.6752) |
| Quality of life (SF12) | |||||
| Physical score | 47.7 (9.38) | 47.7 (10.0) | 47.8 (8.85) | 100 | −0.14 (−3.94 to 3.66; p value=0.9433) |
| Mental score | 51.0 (9.40) | 50.2 (10.6) | 51.7 (8.13) | 100 | 1.00 (−2.76 to 4.75; p value=0.6041) |
| Anxiety score | 3.21 (3.53) | 3.47 (3.78) | 2.96 (3.31) | 101 | −0.23 (−1.64 to 1.17; p value=0.7465) |
| Abnormal (≥8) | 11 (10.9%) | 7 (14.3%) | 4 (7.69%) | 101 | 0.63 (0.16 to 2.45; p value=0.5050) |
| Depression score | 2.68 (3.38) | 2.65 (3.07) | 2.71 (3.68) | 101 | −0.02 (−1.38 to 1.35; p value=0.9806) |
| Abnormal (≥8) | 8 (7.92%) | 4 (8.16%) | 4 (7.69%) | 101 | 0.81 (0.19 to 3.51; p value=0.7798) |
| No return to worka | 15 (24.6%) | 7 (22.6%) | 8 (26.7%) | 61 | 1.61 (0.46 to 5.67; p value=0.4614) |
Abbreviations: ICU, intensive care unit; IMV, invasive mechanical ventilation; DLCO, diffusing capacity for carbon monoxide; KCO, carbon monoxide transfer coefficient; FEV1, forced expiratory volume in one second; FVC, forced vital capacity; TLC, total lung capacity; RV, residual volume; 6MWT, six-minute walking test; PP-6MWT, percentile predicted six-minute walking test; RPE, rate of perceived exertion scale; CT, computed tomography; TSS, total severity score; BC-CCI, British Columbia Cognitive Complaints Inventory; FACIT, Functional Assessment of Chronic Illness Therapy; SF-12, 12-Item Short Form Survey.
A global progressive improvement was observed in symptoms, anxiety, depression, quality of life and cognition levels (Fig. 1), with scores and punctuations similar to those of general population (Table 1B). Nevertheless, 35%, 14%, 10.9%, and 7.9% had persistently abnormal scores for fatigue, cognition, anxiety and depression at 2 years, respectively. There were no differences between intubated or non-intubated patients (Table 1B). Additionally, at this time point, patients presented a mean (SD) number of persisting symptoms of 5.87 (4.56), with a total of 54.3% of patients meeting the post-COVID syndrome or long COVID definition.8 The burden of symptoms and comorbidities was associated with quality of life and with consumption of health resources, but not with lung functional status or radiological abnormalities on the chest CT (data not shown). During the second year, a significant reduction was observed in outpatient clinic visits compared to the previous year (mean difference of −7.21 [5.35–9.06; p<0.001]) and in emergency visits (37.64% at first-year follow-up vs. 21.27% at two-year follow-up; p<0.001). A total of 61 (57.54%) patients attended a pulmonary rehabilitation program during the follow-up and 24.6% had not returned to work two years after hospital discharge.
In addition to COVID-191 and SARS,9 long-term studies of patients who survive to an acute respiratory distress syndrome (ARDS) have yielded similar results. One of the largest and most important studies,10 which followed 64 patients with ARDS for 5 years, curiously found worse functional results than ours at 24 months, with mean DLCO values of 78% (IQR: 63–89) and a percentile predicted six-minute walking distance (PP-6MWD) of 68%. The study also demonstrated an alteration in quality of life, and the proportion of patients who returned to work was lower (65%). Persistent symptoms were also present, and the number of comorbidities was also related to high health care consumption during follow-up. Additionally, mechanical ventilation11,12 and its adjunctive therapies (neuromuscular blockade, sedation, prone positioning, recruitment manoeuvres, etc.),13 as well as its classic complications (ventilator-induced pneumonia, sepsis, multiorgan failure, etc.),14 increase patients’ susceptibility to long-term sequelae.15 Thus, severe lung injury implies important long-term multidimensional sequelae that go beyond respiratory involvement. Research priorities must include a deep understanding of severe lung injury consequences to develop more effective follow-up involving rehabilitation programs for long-term outcomes after critical illness.
Regarding symptoms and post-COVID syndrome our results are in line with others.1 Curiously, despite the high number of symptoms and cases of long COVID, most survivors returned to work, as previously described in COVID-19 and SARS.16 Due to the heterogeneity of follow-up and the definition of long COVID in the studies, comparing symptoms, mental disorders, quality of life and the proportion of patients with post-COVID syndrome is methodologically challenging. Additionally, most symptoms are unspecific, and quality of life and mental disorders are influenced by multiple factors, such as isolation, loss of loved ones, financial crises, and baseline comorbidities.17 In general, patients progress and tend to return to normal daily life1; however, as our results suggest, symptom burden is related to health care consumption. For this reason, it is urgent to advance the knowledge of the pathogenesis of long COVID to apply effective interventions and improve the follow-up of survivors.
Our study has some limitations. First, this was a small observational study from a single city conducted during the early stages of the pandemic, which may reduce the generalizability of the findings and might not directly extend to the long-term consequences of patients infected with later SARS-CoV-2 variants. However, patients were well characterized, and the data were thoroughly revised and validated, in contrast to registry-based studies. The loss to follow-up implied that patients who did not participate had fewer symptoms, which might result in an overestimated prevalence of long COVID symptoms. However, great effort was made to avoid loss to follow-up, and our proportion was lower than that in other studies. Finally, there was no information on pulmonary function test, symptoms or quality of life prior to infection.
In conclusion, critical COVID-19 survivors showed longitudinal improvements in respiratory symptoms and quality of life, and most of them returned to work within 2 years. However, there was still a high proportion of patients with functional and radiological abnormalities, especially intubated patients. A high burden of symptoms and post-COVID syndrome were present in the long term, affecting quality of life and implying high health care consumption. These results highlight the urgent need to explore in depth the pathogenesis not only of long COVID but also of the sequelae of severe lung injury.
Ethical ApprovalThe study was approved by the Medical Ethics Committee (CEIC/2273) and complies with the tenets of the Declaration of Helsinki. Informed consent was acquired from all patients in accordance with the ethics approval guidelines for the study.
Authors’ ContributionsFerran Barbé is the guarantor of the paper, taking responsibility for the integrity of the work as a whole, from inception to publication of the article. Jessica González, Maria Zuil, Ivan de Benítez, David de Gonzalo, Jordi de Batlle, Antoni Torres, and Ferran Barbe were responsible for the conception, design, interpretation, and drafting of the manuscript for important intellectual content. Statistical analyses were performed by Ivan de Benítez. Patient recruitment and evaluation were performed by Maria Aguilà, Sally Santisteve, Aida Monge, Natalia Varvara, Anna Montcusí, Faty Seck, Clara Gort-Paniello, Rafaela Vaca, Olga Mínguez, Jesus Caballero and Carmen Barberà.
FundingFinancial support was provided by the Instituto de Salud Carlos III (CIBERESUCICOVID, COV20/00110), with cofunding from Fondo Europeo de Desarrollo Regional (FEDER), “Una manera de hacer Europa”; Centro de Investigación Biomédica en Red-Enfermedades Respiratorias (CIBERES); Donation Program “Estar preparados”, UNESPA, Madrid, Spain. JdB acknowledges receiving financial support from the Instituto de Salud Carlos III (ISCIII; Miguel Servet 2020: CP19/00108), with cofunding from the European Social Fund (ESF), “Investing in your future”. DdGC acknowledges receiving financial support from the Instituto de Salud Carlos III (ISCIII; Miguel Servet 2020: CP20/00041), with cofunding from the European Social Fund (ESF), “Investing in your future”. None of the funding sources had a role in the study design; in the collection, analysis, or interpretation of the data; in the writing of the report; or in the decision to submit the article for publication.
Competing InterestsNone declared.
The authors are indebted to Maria Arguimbau, Raquel Campo, Natalia Jarillo, Javier Muñoz and Silvia Ortega for their extensive support in project management and article preparation.


