

The socioeconomic impact of obstructive sleep apnea-hypopnea syndrome (OSAHS) is considerable. The aim of this study was to evaluate the cost-effectiveness of treating OSAHS with continuous positive airway pressure (CPAP) and the impact of CPAP compliance.
MethodsThis was a retrospective, case-crossover study of 373 patients with OSAHS receiving CPAP. We compared changes in costs, Epworth score and health-related quality of life (EQ-5D questionnaires) between the year before treatment and the year after treatment. The incremental cost-effectiveness ratio (ICER) for the first year of treatment was estimated, and projections were made for the second year, using different effectiveness and cost scenarios.
ResultsThe visual analog scale score for the EQ-5D questionnaire increased by 5 points and the Epworth score fell by 10 points during the year of CPAP treatment. Mean gain in quality-adjusted life years (QALY) was 0.05 per patient per year (P<.001): 0.07 among compliers and –0.04 among non-compliers. ICER was €51,147/QALY during the first year of CPAP treatment and €1544/QALY during the second year.
ConclusionCPAP treatment in patients with moderate-severe OSAHS improves the quality of life of compliant patients, and is cost-effective as of the second year.
El síndrome de apnea-hipopnea durante el sueño (SAHS) supone un gran impacto socioeconómico. El objetivo de este estudio es evaluar el coste-efectividad del tratamiento del SAHS con presión positiva continua de la vía aérea superior (CPAP) y estimar la influencia que tiene el cumplimiento de la CPAP.
MétodosEstudio retrospectivo de «casos cruzados» de 373 pacientes SAHS tratados con CPAP. Se calcularon variaciones en costes, puntuación en el test de Epworth y calidad de vida relacionada con la salud (cuestionario EQ-5D) entre el año previo al tratamiento y el año después del mismo. Se estimó la ratio de coste-efectividad incremental (RCEI) para el primer año de tratamiento y se realizó una proyección para el segundo año bajo distintos escenarios de efectividad y costes.
ResultadosLa puntuación de la escala visual analógica del cuestionario EQ-5D aumentó en 5 puntos y el test de Epworth disminuyó en 10 puntos al año del tratamiento con CPAP, con una ganancia media en años de vida ajustados por calidad (AVAC) de 0,05 por paciente y año (p0,001): 0,07 en cumplidores y –0,04 en no cumplidores. La RCEI fue de 51.147 €/AVAC durante el primer año de tratamiento con CPAP y de 1.544AVAC el segundo año.
ConclusiónEl tratamiento con CPAP en pacientes con SAHS moderado-grave mejora la calidad de vida de los pacientes cumplidores y es coste-efectivo a partir del segundo año.
Sleep apnea-hypopnea syndrome (OSAHS) affects 2%–4% of the general middle-aged population,1 and over 7 million Spaniards are at risk of developing this disease.2,3 OSAHS has been associated with increased prevalence and incidence of metabolic changes and cardiovascular diseases, such as arterial hypertension (AHT), heart failure, ischemic heart disease, stroke, and sudden death,4–6 along with higher accident rates in the workplace, at home and on the roads,7,8 making it a public health issue with a high economic burden.
Increases in healthcare spending due to continuous improvements in the diagnosis and treatment of such a prevalent disease as OSAHS are foreseeable in years to come, but these may be compensated in the long term by a reduction in cardiovascular complications and increased work productivity.
Continuous positive airway pressure (CPAP) is the treatment of choice in most OSAHS patients. It is not a curative treatment and needs to be applied continuously and indefinitely.9 The diagnosis of OSAHS and treatment with CPAP, albeit costly for the healthcare system, are essential, because undiagnosed or untreated OSAHS patients use 2–3 times more resources than the general population.10 Moreover, several studies have been published on the positive impact, both in the short and long term, of CPAP treatment on patients’ health-related quality of life (HRQoL), although these are all based on small series of patients.11–14
Cost-effectiveness studies of CPAP therapy in OSAHS estimate whether the cost of CPAP treatment is compensated by improved symptoms and quality of life. Several studies that use Markov models based on literature reviews and secondary sources to simulate the course of the disease and the use of resources have shown that CPAP is cost-effective compared to other therapeutic interventions.15–17
The main objective of this study was to analyze the cost-effectiveness of CPAP in patients with a diagnosis of OSAHS after 1 year of treatment, using primary data, and to predict the impact after 2 years of treatment. The secondary objective was to estimate the possible influence of patient compliance on the cost-effectiveness of CPAP treatment.
Materials and methodsStudy population and designThis was a retrospective, observational, case-crossover study in patients with a diagnosis of OSAHS receiving CPAP between January 2008 and February 2012 in the Sleep-Disordered Breathing Unit (SDBU) of the Hospital Universitari Sant Joan de Reus, who had been followed up for at least 1 year. The “case period” was defined as the 365 days following the clinical diagnosis of OSAHS and the “control period” was the preceding 365-day period. Of the 1790 patients seen in the SDBU due to suspected OSAHS, 373 patients with moderate or severe OSAHS treated with CPAP, with evaluable case report forms (CRF) at the beginning of treatment and at the end of the 1-year follow-up period were finally included (Fig. 1). The study was approved by the hospital's Ethics and Clinical Research Committee (code 15-03-26/3aclaobs1).

Flow chart of study design. *OSAHS diagnosis was performed by in-hospital CRPG in 34.3% of cases, on an outpatient basis in 33.2%, and by standard PSG monitored in the hospital in 32.4%. CRPG: cardiorespiratory polygraph; NIV: non-invasive ventilation; PSG: polysomnography; OSAHS: sleep apnea-hypopnea syndrome.
Exclusion criteria were: age younger than 18 years, psychophysical inability to complete questionnaires or refusal to answer them, Cheyne–Stokes syndrome, indication for uvulopalatopharyngoplasty, significant nasal obstruction preventing use of CPAP, need for invasive mechanical ventilation, and indication for bariatric surgery.
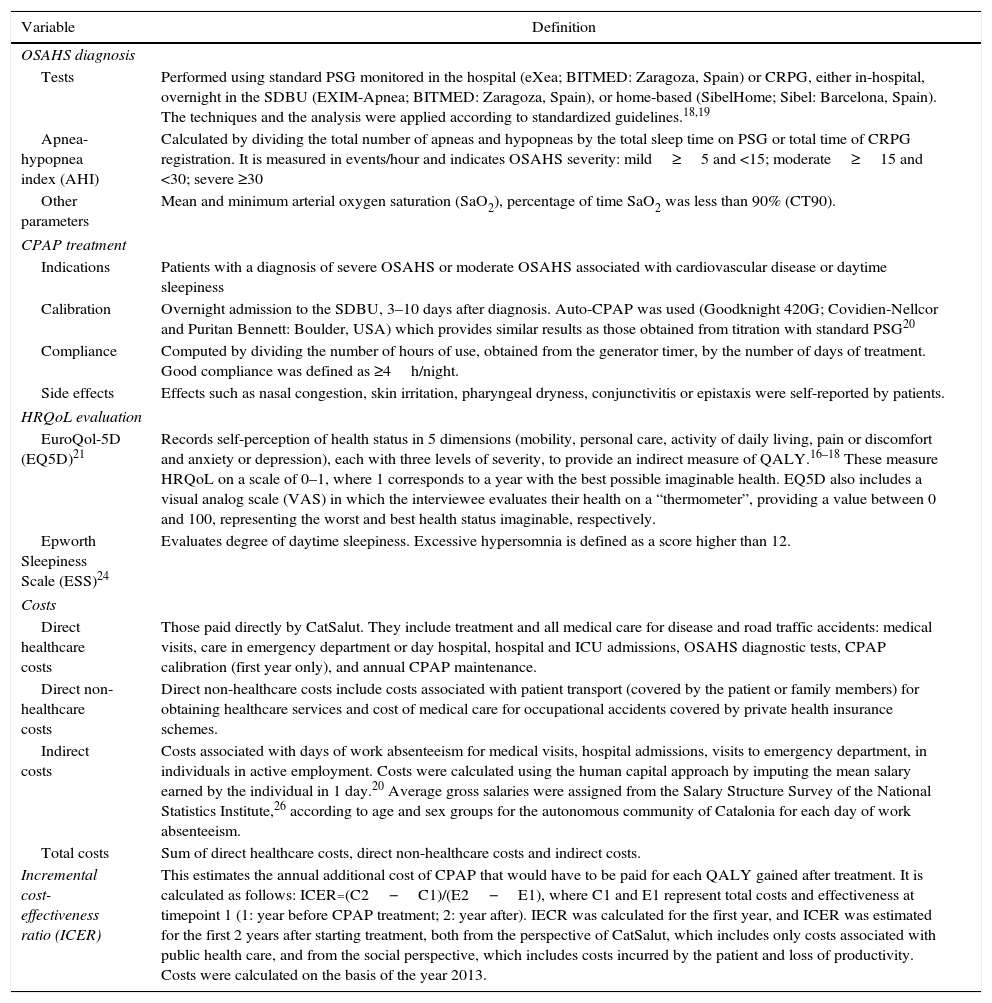
Diagnosis of OSAHS was determined by means of standard polysomnography (PSG) monitored in the hospital, or cardiorespiratory polygraphy (CRPG) either overnight in the SDBU or on an outpatient basis (Table 1). The techniques and the analysis were applied according to standardized guidelines.18,19 CPAP treatment was indicated in patients with a diagnosis of severe OSAHS and in patients with moderate OSAHS associated with cardiovascular disease or daytime sleepiness. Between 3 and 10 days after diagnosis, patients spent 1 night in the SDBU for titration of the effective pressure by automatic CPAP (auto-CPAP)20 (Table 1). All autotitration recordings for determining the optimal pressure were performed in the hospital to avoid unevaluable studies and to emphasize compliance, defined as at least 4h a night. This period was measured using the generator timer.
Significant Items and Definitions.
| Variable | Definition |
|---|---|
| OSAHS diagnosis | |
| Tests | Performed using standard PSG monitored in the hospital (eXea; BITMED: Zaragoza, Spain) or CRPG, either in-hospital, overnight in the SDBU (EXIM-Apnea; BITMED: Zaragoza, Spain), or home-based (SibelHome; Sibel: Barcelona, Spain). The techniques and the analysis were applied according to standardized guidelines.18,19 |
| Apnea-hypopnea index (AHI) | Calculated by dividing the total number of apneas and hypopneas by the total sleep time on PSG or total time of CRPG registration. It is measured in events/hour and indicates OSAHS severity: mild≥5 and <15; moderate≥15 and <30; severe ≥30 |
| Other parameters | Mean and minimum arterial oxygen saturation (SaO2), percentage of time SaO2 was less than 90% (CT90). |
| CPAP treatment | |
| Indications | Patients with a diagnosis of severe OSAHS or moderate OSAHS associated with cardiovascular disease or daytime sleepiness |
| Calibration | Overnight admission to the SDBU, 3–10 days after diagnosis. Auto-CPAP was used (Goodknight 420G; Covidien-Nellcor and Puritan Bennett: Boulder, USA) which provides similar results as those obtained from titration with standard PSG20 |
| Compliance | Computed by dividing the number of hours of use, obtained from the generator timer, by the number of days of treatment. Good compliance was defined as ≥4h/night. |
| Side effects | Effects such as nasal congestion, skin irritation, pharyngeal dryness, conjunctivitis or epistaxis were self-reported by patients. |
| HRQoL evaluation | |
| EuroQol-5D (EQ5D)21 | Records self-perception of health status in 5 dimensions (mobility, personal care, activity of daily living, pain or discomfort and anxiety or depression), each with three levels of severity, to provide an indirect measure of QALY.16–18 These measure HRQoL on a scale of 0–1, where 1 corresponds to a year with the best possible imaginable health. EQ5D also includes a visual analog scale (VAS) in which the interviewee evaluates their health on a “thermometer”, providing a value between 0 and 100, representing the worst and best health status imaginable, respectively. |
| Epworth Sleepiness Scale (ESS)24 | Evaluates degree of daytime sleepiness. Excessive hypersomnia is defined as a score higher than 12. |
| Costs | |
| Direct healthcare costs | Those paid directly by CatSalut. They include treatment and all medical care for disease and road traffic accidents: medical visits, care in emergency department or day hospital, hospital and ICU admissions, OSAHS diagnostic tests, CPAP calibration (first year only), and annual CPAP maintenance. |
| Direct non-healthcare costs | Direct non-healthcare costs include costs associated with patient transport (covered by the patient or family members) for obtaining healthcare services and cost of medical care for occupational accidents covered by private health insurance schemes. |
| Indirect costs | Costs associated with days of work absenteeism for medical visits, hospital admissions, visits to emergency department, in individuals in active employment. Costs were calculated using the human capital approach by imputing the mean salary earned by the individual in 1 day.20 Average gross salaries were assigned from the Salary Structure Survey of the National Statistics Institute,26 according to age and sex groups for the autonomous community of Catalonia for each day of work absenteeism. |
| Total costs | Sum of direct healthcare costs, direct non-healthcare costs and indirect costs. |
| Incremental cost-effectiveness ratio (ICER) | This estimates the annual additional cost of CPAP that would have to be paid for each QALY gained after treatment. It is calculated as follows: ICER=(C2−C1)/(E2−E1), where C1 and E1 represent total costs and effectiveness at timepoint 1 (1: year before CPAP treatment; 2: year after). IECR was calculated for the first year, and ICER was estimated for the first 2 years after starting treatment, both from the perspective of CatSalut, which includes only costs associated with public health care, and from the social perspective, which includes costs incurred by the patient and loss of productivity. Costs were calculated on the basis of the year 2013. |
CatSalut: Catalan Health Service; CPAP: continuous positive airway pressure; CRPG: cardiorespiratory polysomnography; CT90: percentage of time in which SaO2 is lower than 90%; ICER: incremental cost-effectiveness ratio; PSG: polysomnography; QALY: quality-adjusted life year; OSAHS: sleep apnea-hypopnea syndrome; SaO2; arterial oxygen saturation; SDBU: sleep-disordered breathing unit; VAS: visual analog scale.
Each patient's clinical history, cardiovascular risk factors (diabetes mellitus, AHT, dyslipemia), cardiovascular events (CVE) (stroke, ischemic heart disease, heart failure, arrhythmias, other), cancer, use of healthcare resources (diagnostic tests, medical visits, emergency room visits, and hospitalizations), loss of work productivity, and OSAHS-related symptoms during the year before and the year after diagnosis were recorded on a CRF. All data were obtained from electronic clinical records.
Diagnoses given to the patient during their lifetime were recorded during the control period, with the exception of CVE and diagnoses of cancer, which were collected from the previous year only, and any new diagnoses were recorded during the case period.
To evaluate HRQoL, patients completed the Spanish version of the EuroQol-5D (EQ5D) questionnaire21 before and after receiving CPAP, consisting of a visual analog scale (VAS) from 0 to 100, where 100 is the best quality of life imaginable, and a utility index from 0 to 1 (where 1 represents perfect utility or quality of life, the annual equivalent of which is 1 quality-adjusted life year [QALY], and 0 represents the poorest quality of life imaginable, equivalent to death and to 0 annual QALYs).22,23 Patients also completed the Spanish version of the Epworth sleepiness scale (ESS) to evaluate their degree of daytime sleepiness.24
Assignation of costsTotal costs generated during the year before and the year after diagnosis were calculated. Total costs refer to the sum of direct healthcare costs, direct non-healthcare costs, and indirect costs.25,26 Healthcare costs correspond to those of the Catalan Health Service (CatSalut) for the year 2013. In the first year of treatment, the following were included: OSAHS diagnosis (€358.52); hospital admission for CPAP calibration (€2223.05) and annual CPAP maintenance by the supplier awarded the contract to provide these services through a public tender (€335.8), representing a total of €2917.37 per patient. The cost of the OSAHS diagnostic test is comprehensive our area, irrespective of whether PSG or CRPG are performed on an inpatient (in the SDBU) or outpatient basis; moreover, admission for nasal CPAP calibration in this area costs the same as a standard hospital stay. These items and the incremental cost-effectiveness ratio (ICER) are listed in Table 1. According to economic assessment manuals, we considered a clinical practice as cost-effective when its ICER was lower than a certain threshold of efficiency. In the Spanish healthcare system, the threshold of efficiency is defined as €30,000/QALY27 or £20,000–£30,000/QALY according to the Institute for Health and Clinical Excellence (NICE).28
Statistical analysisThe clinical situation, quality of life, degree of sleepiness, and costs generated by the patient during the control and case periods were compared and contrasted between compliers and non-compliers. The paired t test was used to analyze the same sample of individuals in the control and case periods. Statistically significant differences between both periods were examined. Non-parametric techniques (e.g., Wilcoxon test) were used for variables that did not have a normal distribution. The limit for statistical significance was set at a P value of <.05.
The ICER was calculated by comparing costs and QALYs between the previous year and the first year post-treatment, and between the previous year and the second year post-treatment. The costs of diagnosis and CPAP calibration were excluded from the costs of the second year of treatment. Since data were not collected after the second year, several hypothetical scenarios were proposed (sensitivity analyses), assigning a resource use of 10% higher or lower than that registered for the first year, while maintaining the QALY level constant.
Data were analyzed using SPSS version 19.0 (SPSS Inc., Chicago, IL, USA).
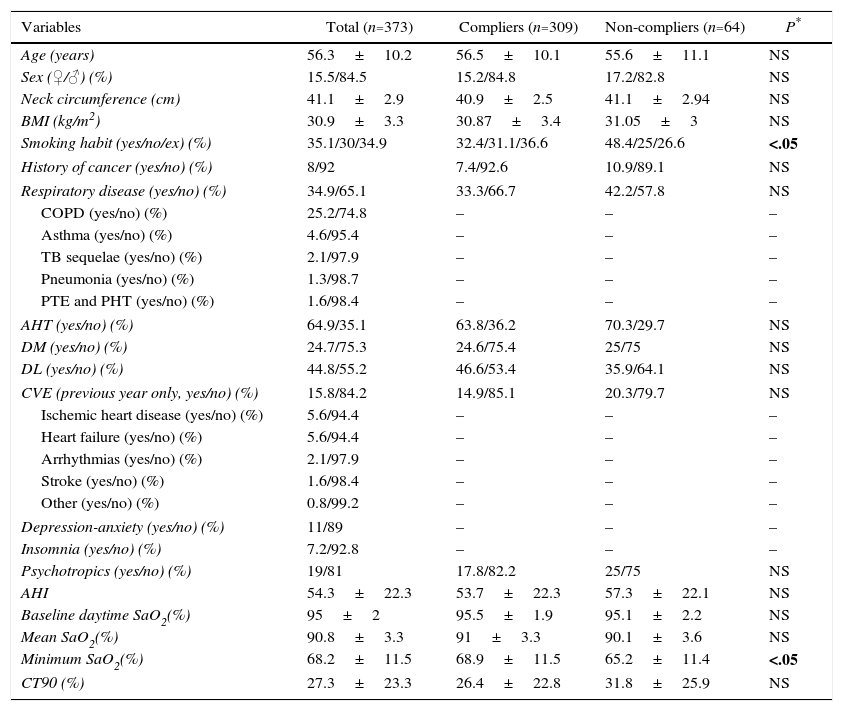
ResultsDemographic description and clinical and functional features of the populationA total of 373 patients were included (15.5% women, mean age 56.3±10.2 years). Clinical and anthropometric characteristics are shown in Table 2. A total of 65% had a diagnosis of AHT and 35% had a history of respiratory disease. The diagnosis of OSAHS was performed by in-hospital CRPG in 34.3% of cases, on an outpatient basis in 33.2%, and by standard PSG monitored in the hospital in 32.4%. The mean apnea-hypopnea index (AHI) was 54.3±22.3 and the percentage of time during which SaO2 was less than 90% (CT90) was 27.3%±23.3%.
Clinical Status of Patients Before Starting CPAP.
| Variables | Total (n=373) | Compliers (n=309) | Non-compliers (n=64) | P* |
|---|---|---|---|---|
| Age (years) | 56.3±10.2 | 56.5±10.1 | 55.6±11.1 | NS |
| Sex (♀/♂) (%) | 15.5/84.5 | 15.2/84.8 | 17.2/82.8 | NS |
| Neck circumference (cm) | 41.1±2.9 | 40.9±2.5 | 41.1±2.94 | NS |
| BMI (kg/m2) | 30.9±3.3 | 30.87±3.4 | 31.05±3 | NS |
| Smoking habit (yes/no/ex) (%) | 35.1/30/34.9 | 32.4/31.1/36.6 | 48.4/25/26.6 | <.05 |
| History of cancer (yes/no) (%) | 8/92 | 7.4/92.6 | 10.9/89.1 | NS |
| Respiratory disease (yes/no) (%) | 34.9/65.1 | 33.3/66.7 | 42.2/57.8 | NS |
| COPD (yes/no) (%) | 25.2/74.8 | – | – | – |
| Asthma (yes/no) (%) | 4.6/95.4 | – | – | – |
| TB sequelae (yes/no) (%) | 2.1/97.9 | – | – | – |
| Pneumonia (yes/no) (%) | 1.3/98.7 | – | – | – |
| PTE and PHT (yes/no) (%) | 1.6/98.4 | – | – | – |
| AHT (yes/no) (%) | 64.9/35.1 | 63.8/36.2 | 70.3/29.7 | NS |
| DM (yes/no) (%) | 24.7/75.3 | 24.6/75.4 | 25/75 | NS |
| DL (yes/no) (%) | 44.8/55.2 | 46.6/53.4 | 35.9/64.1 | NS |
| CVE (previous year only, yes/no) (%) | 15.8/84.2 | 14.9/85.1 | 20.3/79.7 | NS |
| Ischemic heart disease (yes/no) (%) | 5.6/94.4 | – | – | – |
| Heart failure (yes/no) (%) | 5.6/94.4 | – | – | – |
| Arrhythmias (yes/no) (%) | 2.1/97.9 | – | – | – |
| Stroke (yes/no) (%) | 1.6/98.4 | – | – | – |
| Other (yes/no) (%) | 0.8/99.2 | – | – | – |
| Depression-anxiety (yes/no) (%) | 11/89 | – | – | – |
| Insomnia (yes/no) (%) | 7.2/92.8 | – | – | – |
| Psychotropics (yes/no) (%) | 19/81 | 17.8/82.2 | 25/75 | NS |
| AHI | 54.3±22.3 | 53.7±22.3 | 57.3±22.1 | NS |
| Baseline daytime SaO2(%) | 95±2 | 95.5±1.9 | 95.1±2.2 | NS |
| Mean SaO2(%) | 90.8±3.3 | 91±3.3 | 90.1±3.6 | NS |
| Minimum SaO2(%) | 68.2±11.5 | 68.9±11.5 | 65.2±11.4 | <.05 |
| CT90 (%) | 27.3±23.3 | 26.4±22.8 | 31.8±25.9 | NS |
Results presented as mean±SD or percentages.
AHI: apnea-hypopnea index; AHT: arterial hypertension; BMI: body mass index; COPD: chronic obstructive pulmonary disease; CPAP: continuous positive airway pressure; CT90: percentage of time SaO2 was lower than 90%; CVE: cardiovascular events (in the 12 months prior to CPAP treatment); DL: dyslipemia; DM: diabetes mellitus; NS: not significant; PHT: pulmonary hypertension; PTE: pulmonary thromboembolism; SaO2: arterial oxygen saturation; TB: tuberculosis.
Mean CPAP pressure was 8.9±1.9cm H2O. After 1 year of treatment, median daily use was 5.3±1.7h. After 1 year of follow-up, 309 patients (82.8%) were categorized as compliers and 64 (17.2%) as non-compliers (Table 2), with no statistically significant baseline clinical differences between the groups, except for a greater prevalence of smoking and lower SaO2 among the non-compliers, compared to the compliers (P<.05).
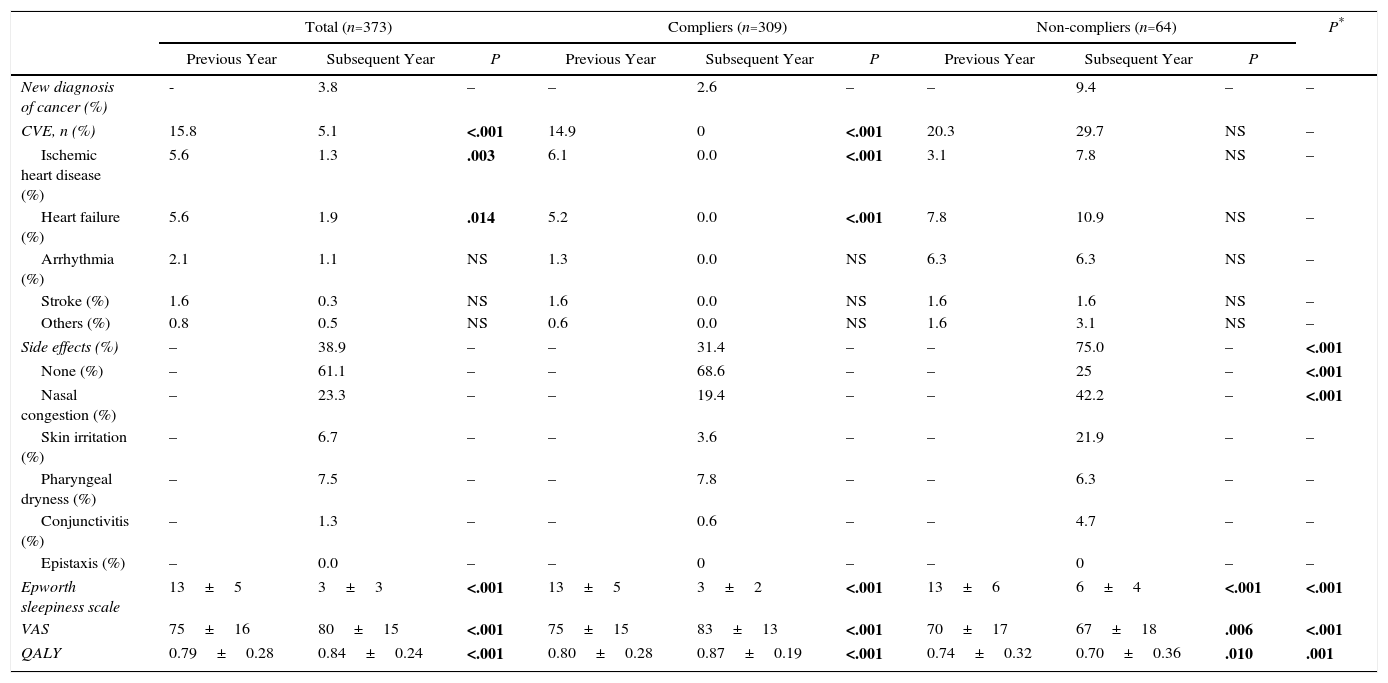
Treatment with continuous positive airway pressure: clinical effects and quality of lifeClinical course and quality of life of patients in the case period compared to the control period are shown in Table 3. The percentage of patients with CVE fell from 15.8% to 5.1% in the overall sample (P<.001) and from 14.9% to 0% among the compliers (P<.001), while it increased, insignificantly, among non-compliers.
Clinical and Quality of Life Parameters in the Year Before and the Year After Starting CPAP, Comparing Compliers and Non-compliers.
| Total (n=373) | Compliers (n=309) | Non-compliers (n=64) | P* | |||||||
|---|---|---|---|---|---|---|---|---|---|---|
| Previous Year | Subsequent Year | P | Previous Year | Subsequent Year | P | Previous Year | Subsequent Year | P | ||
| New diagnosis of cancer (%) | - | 3.8 | – | – | 2.6 | – | – | 9.4 | – | – |
| CVE, n (%) | 15.8 | 5.1 | <.001 | 14.9 | 0 | <.001 | 20.3 | 29.7 | NS | – |
| Ischemic heart disease (%) | 5.6 | 1.3 | .003 | 6.1 | 0.0 | <.001 | 3.1 | 7.8 | NS | – |
| Heart failure (%) | 5.6 | 1.9 | .014 | 5.2 | 0.0 | <.001 | 7.8 | 10.9 | NS | – |
| Arrhythmia (%) | 2.1 | 1.1 | NS | 1.3 | 0.0 | NS | 6.3 | 6.3 | NS | – |
| Stroke (%) | 1.6 | 0.3 | NS | 1.6 | 0.0 | NS | 1.6 | 1.6 | NS | – |
| Others (%) | 0.8 | 0.5 | NS | 0.6 | 0.0 | NS | 1.6 | 3.1 | NS | – |
| Side effects (%) | – | 38.9 | – | – | 31.4 | – | – | 75.0 | – | <.001 |
| None (%) | – | 61.1 | – | – | 68.6 | – | – | 25 | – | <.001 |
| Nasal congestion (%) | – | 23.3 | – | – | 19.4 | – | – | 42.2 | – | <.001 |
| Skin irritation (%) | – | 6.7 | – | – | 3.6 | – | – | 21.9 | – | – |
| Pharyngeal dryness (%) | – | 7.5 | – | – | 7.8 | – | – | 6.3 | – | – |
| Conjunctivitis (%) | – | 1.3 | – | – | 0.6 | – | – | 4.7 | – | – |
| Epistaxis (%) | – | 0.0 | – | – | 0 | – | – | 0 | – | – |
| Epworth sleepiness scale | 13±5 | 3±3 | <.001 | 13±5 | 3±2 | <.001 | 13±6 | 6±4 | <.001 | <.001 |
| VAS | 75±16 | 80±15 | <.001 | 75±15 | 83±13 | <.001 | 70±17 | 67±18 | .006 | <.001 |
| QALY | 0.79±0.28 | 0.84±0.24 | <.001 | 0.80±0.28 | 0.87±0.19 | <.001 | 0.74±0.32 | 0.70±0.36 | .010 | .001 |
Results presented as mean±SD or percentages.
AHT: new diagnosis of arterial hypertension; CPAP: continuous positive airway pressure; CVE: cardiovascular event; DL: new diagnosis of dyslipemia; DM: new diagnosis of diabetes mellitus; Dx: diagnosis; NS: difference not significant; QALY: quality-adjusted life years; VAS: visual analog scale.
In total, 38.9% of patients reported some form of side effect (31.4% of compliers and 75% of non-compliers, P<.001), the most common being nasal congestion (23.3%), pharyngeal dryness (7.5%), and skin irritation (6.7%).
Self-perceived health according to the EQ5D VAS increased by a mean of 5 points (P<.001), and patients gained a mean of 0.05 QALY (P<.001). Moreover, the score on the Epworth scale fell by a mean of 10 points (P<.001). In all cases, compliers had significantly better results than non-compliers (P<.001), who showed a loss of 0.04 QALY (Table 3).
Among the non-compliers (n=64), a subgroup analysis was performed according to hours of compliance (0 to <1h; 1 to <2h; 2 to <3h, and 3 to <4h). The analysis found no statistically significant differences between the subgroups, either in presence, absence or type of side effects, or in the mean QALY result.
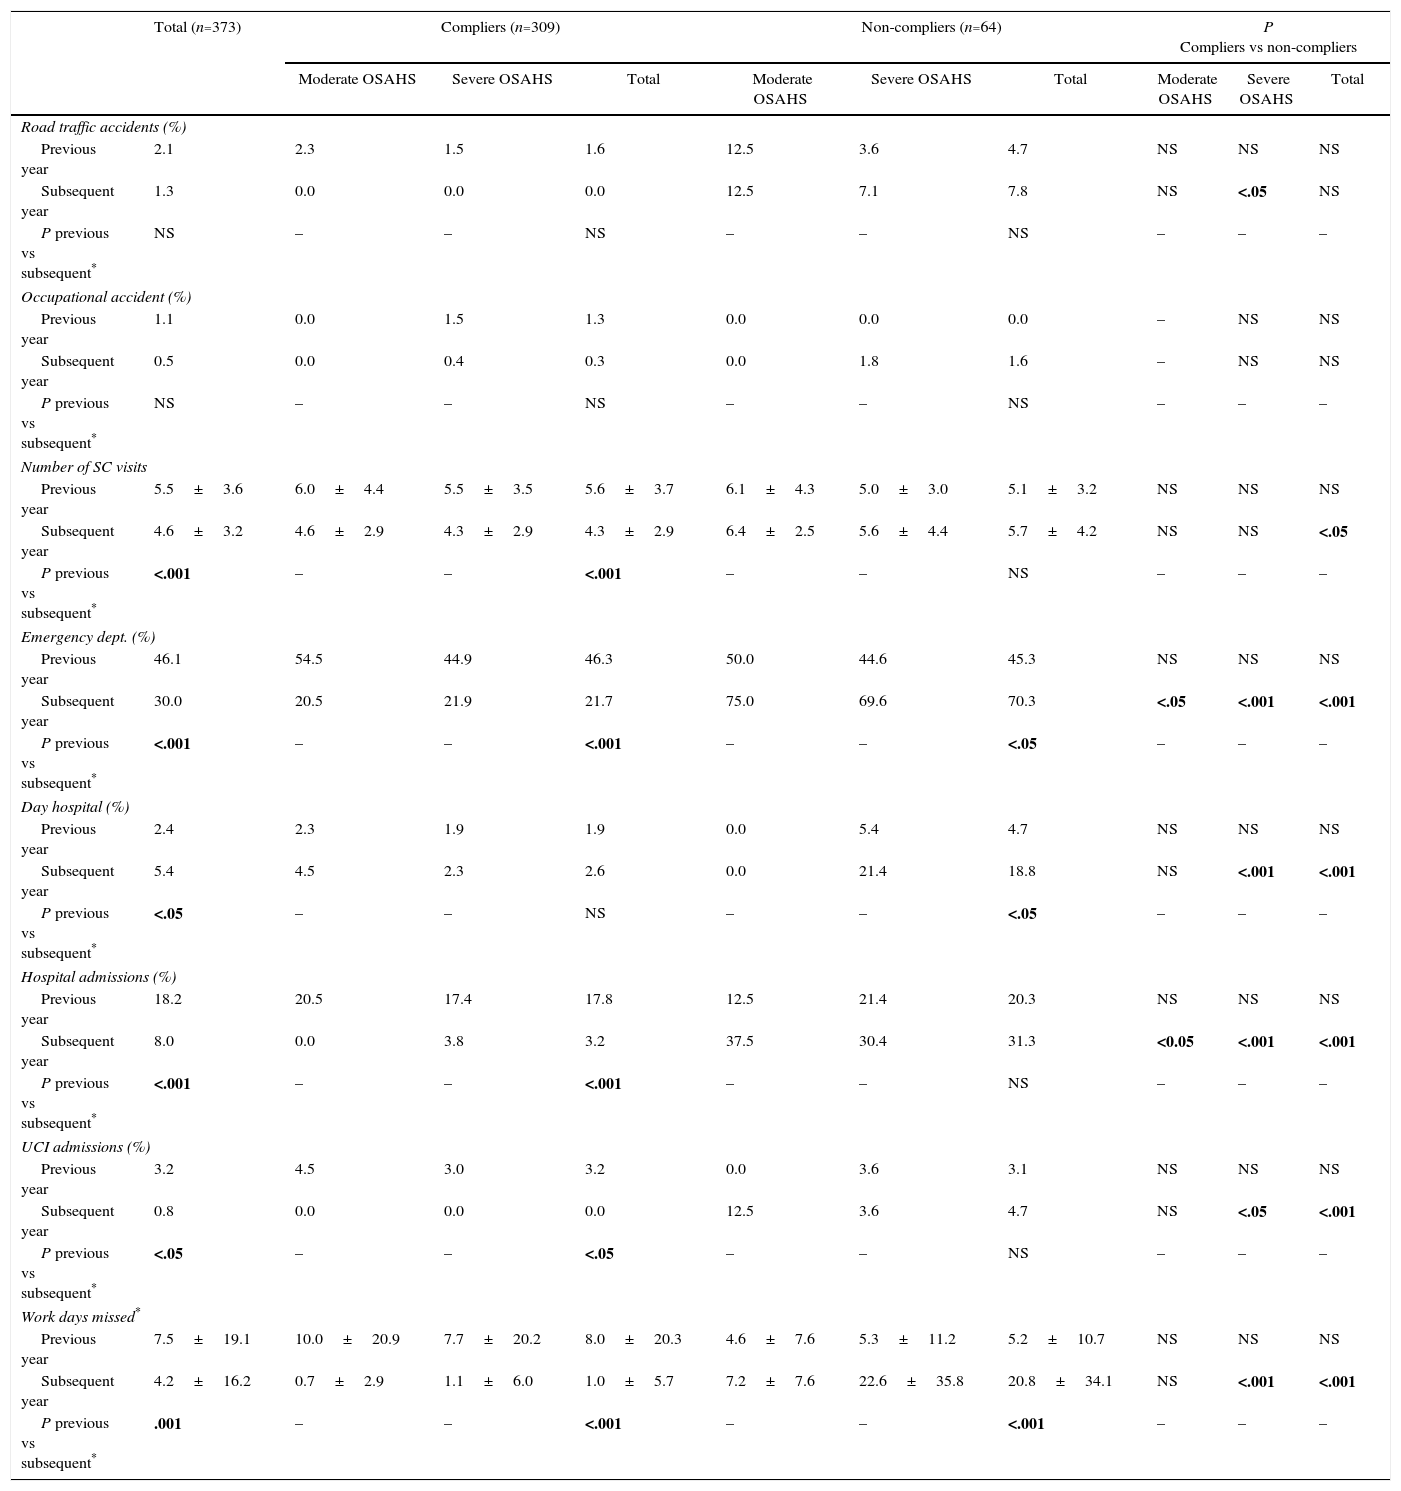
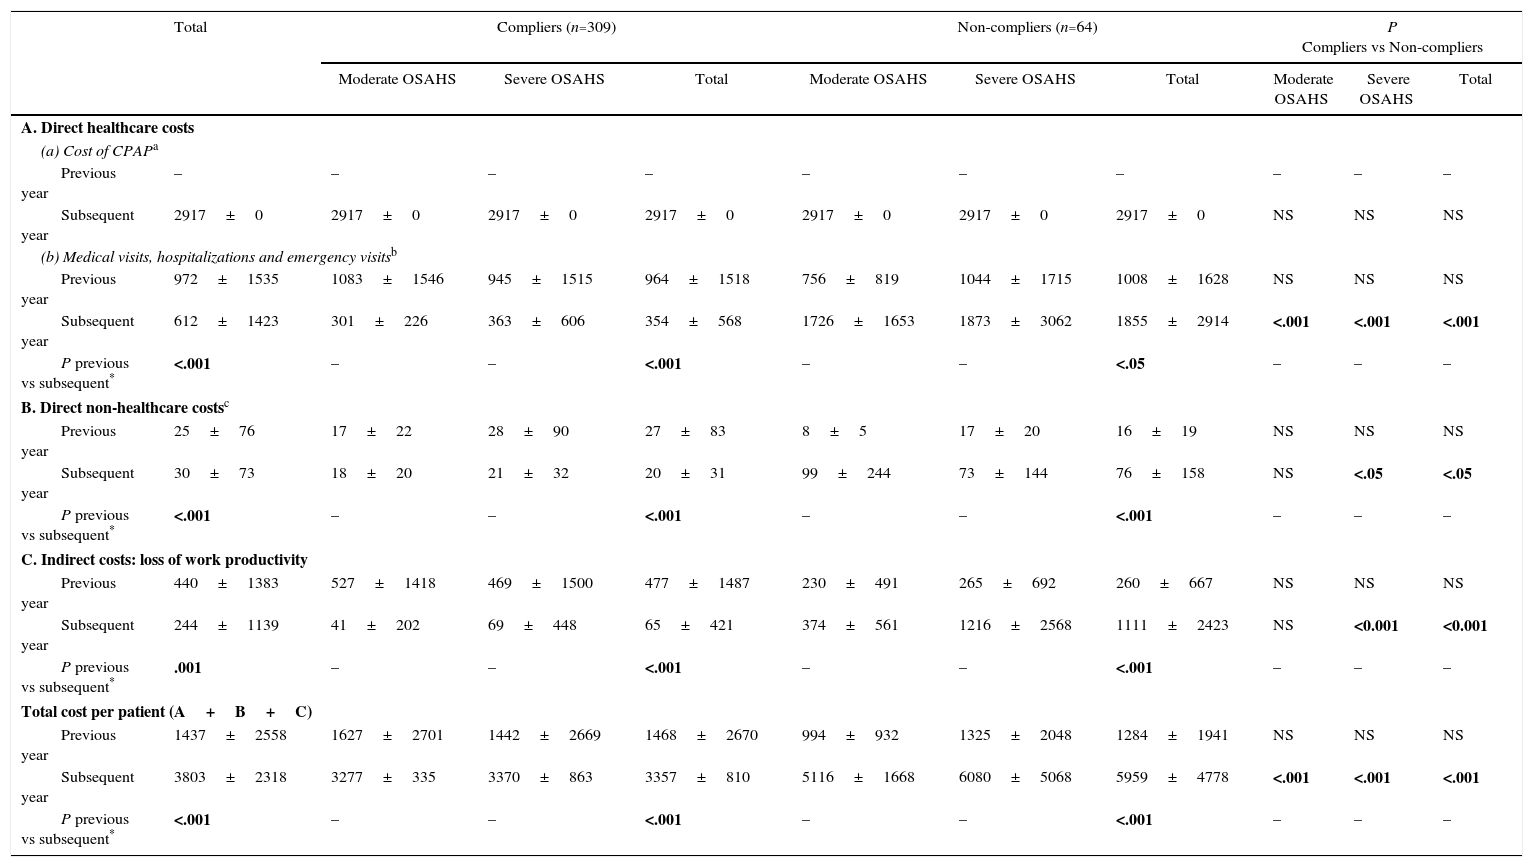
Changes in the use of resources and costs before and after treatment with continuous positive airway pressureCPAP treatment led to a significant reduction (P<.001) in the number of medical visits, emergency visits, hospitalizations and sick days off work by patients in active employment (Table 4). The use of resources by severe and moderate patients was compared (Table 4). After 1 year of treatment, the mean costs of compliers were significantly lower than those of non-compliers: €3357 vs €5959 (Table 5). Mean costs of severe and moderate patients were also compared (Table 5).
Healthcare and Non-healthcare Resource use After 1 Year of CPAP Treatment, by OSAHS Severity.a
| Total (n=373) | Compliers (n=309) | Non-compliers (n=64) | P Compliers vs non-compliers | |||||||
|---|---|---|---|---|---|---|---|---|---|---|
| Moderate OSAHS | Severe OSAHS | Total | Moderate OSAHS | Severe OSAHS | Total | Moderate OSAHS | Severe OSAHS | Total | ||
| Road traffic accidents (%) | ||||||||||
| Previous year | 2.1 | 2.3 | 1.5 | 1.6 | 12.5 | 3.6 | 4.7 | NS | NS | NS |
| Subsequent year | 1.3 | 0.0 | 0.0 | 0.0 | 12.5 | 7.1 | 7.8 | NS | <.05 | NS |
| P previous vs subsequent* | NS | – | – | NS | – | – | NS | – | – | – |
| Occupational accident (%) | ||||||||||
| Previous year | 1.1 | 0.0 | 1.5 | 1.3 | 0.0 | 0.0 | 0.0 | – | NS | NS |
| Subsequent year | 0.5 | 0.0 | 0.4 | 0.3 | 0.0 | 1.8 | 1.6 | – | NS | NS |
| P previous vs subsequent* | NS | – | – | NS | – | – | NS | – | – | – |
| Number of SC visits | ||||||||||
| Previous year | 5.5±3.6 | 6.0±4.4 | 5.5±3.5 | 5.6±3.7 | 6.1±4.3 | 5.0±3.0 | 5.1±3.2 | NS | NS | NS |
| Subsequent year | 4.6±3.2 | 4.6±2.9 | 4.3±2.9 | 4.3±2.9 | 6.4±2.5 | 5.6±4.4 | 5.7±4.2 | NS | NS | <.05 |
| P previous vs subsequent* | <.001 | – | – | <.001 | – | – | NS | – | – | – |
| Emergency dept. (%) | ||||||||||
| Previous year | 46.1 | 54.5 | 44.9 | 46.3 | 50.0 | 44.6 | 45.3 | NS | NS | NS |
| Subsequent year | 30.0 | 20.5 | 21.9 | 21.7 | 75.0 | 69.6 | 70.3 | <.05 | <.001 | <.001 |
| P previous vs subsequent* | <.001 | – | – | <.001 | – | – | <.05 | – | – | – |
| Day hospital (%) | ||||||||||
| Previous year | 2.4 | 2.3 | 1.9 | 1.9 | 0.0 | 5.4 | 4.7 | NS | NS | NS |
| Subsequent year | 5.4 | 4.5 | 2.3 | 2.6 | 0.0 | 21.4 | 18.8 | NS | <.001 | <.001 |
| P previous vs subsequent* | <.05 | – | – | NS | – | – | <.05 | – | – | – |
| Hospital admissions (%) | ||||||||||
| Previous year | 18.2 | 20.5 | 17.4 | 17.8 | 12.5 | 21.4 | 20.3 | NS | NS | NS |
| Subsequent year | 8.0 | 0.0 | 3.8 | 3.2 | 37.5 | 30.4 | 31.3 | <0.05 | <.001 | <.001 |
| P previous vs subsequent* | <.001 | – | – | <.001 | – | – | NS | – | – | – |
| UCI admissions (%) | ||||||||||
| Previous year | 3.2 | 4.5 | 3.0 | 3.2 | 0.0 | 3.6 | 3.1 | NS | NS | NS |
| Subsequent year | 0.8 | 0.0 | 0.0 | 0.0 | 12.5 | 3.6 | 4.7 | NS | <.05 | <.001 |
| P previous vs subsequent* | <.05 | – | – | <.05 | – | – | NS | – | – | – |
| Work days missed* | ||||||||||
| Previous year | 7.5±19.1 | 10.0±20.9 | 7.7±20.2 | 8.0±20.3 | 4.6±7.6 | 5.3±11.2 | 5.2±10.7 | NS | NS | NS |
| Subsequent year | 4.2±16.2 | 0.7±2.9 | 1.1±6.0 | 1.0±5.7 | 7.2±7.6 | 22.6±35.8 | 20.8±34.1 | NS | <.001 | <.001 |
| P previous vs subsequent* | .001 | – | – | <.001 | – | – | <.001 | – | – | – |
CPAP: continuous positive airway pressure; ICU: intensive care unit; NS: not significant; OSAHS: sleep apnea-hypopnea syndrome; SC: specialized care.
Annual Costs per Patient in Euros (€) by OSAHS Severity.
| Total | Compliers (n=309) | Non-compliers (n=64) | P Compliers vs Non-compliers | |||||||
|---|---|---|---|---|---|---|---|---|---|---|
| Moderate OSAHS | Severe OSAHS | Total | Moderate OSAHS | Severe OSAHS | Total | Moderate OSAHS | Severe OSAHS | Total | ||
| A. Direct healthcare costs | ||||||||||
| (a) Cost of CPAPa | ||||||||||
| Previous year | – | – | – | – | – | – | – | – | – | – |
| Subsequent year | 2917±0 | 2917±0 | 2917±0 | 2917±0 | 2917±0 | 2917±0 | 2917±0 | NS | NS | NS |
| (b) Medical visits, hospitalizations and emergency visitsb | ||||||||||
| Previous year | 972±1535 | 1083±1546 | 945±1515 | 964±1518 | 756±819 | 1044±1715 | 1008±1628 | NS | NS | NS |
| Subsequent year | 612±1423 | 301±226 | 363±606 | 354±568 | 1726±1653 | 1873±3062 | 1855±2914 | <.001 | <.001 | <.001 |
| P previous vs subsequent* | <.001 | – | – | <.001 | – | – | <.05 | – | – | – |
| B. Direct non-healthcare costsc | ||||||||||
| Previous year | 25±76 | 17±22 | 28±90 | 27±83 | 8±5 | 17±20 | 16±19 | NS | NS | NS |
| Subsequent year | 30±73 | 18±20 | 21±32 | 20±31 | 99±244 | 73±144 | 76±158 | NS | <.05 | <.05 |
| P previous vs subsequent* | <.001 | – | – | <.001 | – | – | <.001 | – | – | – |
| C. Indirect costs: loss of work productivity | ||||||||||
| Previous year | 440±1383 | 527±1418 | 469±1500 | 477±1487 | 230±491 | 265±692 | 260±667 | NS | NS | NS |
| Subsequent year | 244±1139 | 41±202 | 69±448 | 65±421 | 374±561 | 1216±2568 | 1111±2423 | NS | <0.001 | <0.001 |
| P previous vs subsequent* | .001 | – | – | <.001 | – | – | <.001 | – | – | – |
| Total cost per patient (A+B+C) | ||||||||||
| Previous year | 1437±2558 | 1627±2701 | 1442±2669 | 1468±2670 | 994±932 | 1325±2048 | 1284±1941 | NS | NS | NS |
| Subsequent year | 3803±2318 | 3277±335 | 3370±863 | 3357±810 | 5116±1668 | 6080±5068 | 5959±4778 | <.001 | <.001 | <.001 |
| P previous vs subsequent* | <.001 | – | – | <.001 | – | – | <.001 | – | – | – |
CPAP: continuous positive airway pressure; OSAHS: sleep apnea-hypopnea syndrome.
Includes OSAHS diagnosis (€358.52); hospital admission for CPAP calibration (€2223.05) and annual CPAP maintenance by the supplier which submitted the successful tender by public competition for the provision of these services (€335.8).
Includes visits to specialized care units, emergency department, admission to day hospital, hospitalization, admission to ICU and road traffic accidents (excludes costs of these services when associated with occupational accidents covered by private insurance schemes).
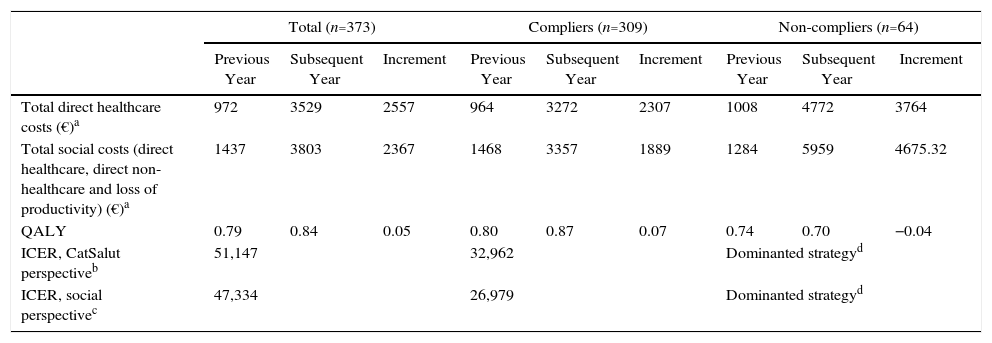
From the CatSalut perspective, which only includes the costs incurred by the health service itself, ICER after the first year of CPAP treatment was €51,147/QALY in all study patients, and €32,962 in compliers. From a social perspective, which also includes costs incurred by the patient and by society, the ICER fell to €47,334 for the whole population and to €26,976 for compliers (Table 6).
Cost-effectiveness, First Year of CPAP.
| Total (n=373) | Compliers (n=309) | Non-compliers (n=64) | |||||||
|---|---|---|---|---|---|---|---|---|---|
| Previous Year | Subsequent Year | Increment | Previous Year | Subsequent Year | Increment | Previous Year | Subsequent Year | Increment | |
| Total direct healthcare costs (€)a | 972 | 3529 | 2557 | 964 | 3272 | 2307 | 1008 | 4772 | 3764 |
| Total social costs (direct healthcare, direct non-healthcare and loss of productivity) (€)a | 1437 | 3803 | 2367 | 1468 | 3357 | 1889 | 1284 | 5959 | 4675.32 |
| QALY | 0.79 | 0.84 | 0.05 | 0.80 | 0.87 | 0.07 | 0.74 | 0.70 | −0.04 |
| ICER, CatSalut perspectiveb | 51,147 | 32,962 | Dominanted strategyd | ||||||
| ICER, social perspectivec | 47,334 | 26,979 | Dominanted strategyd | ||||||
CatSalut: Catalan Health Service; CPAP: continuous positive airway pressure; ICER: incremental cost-effectiveness ratio (increment in costs divided by increment in QALY); QALY: quality-adjusted life year.
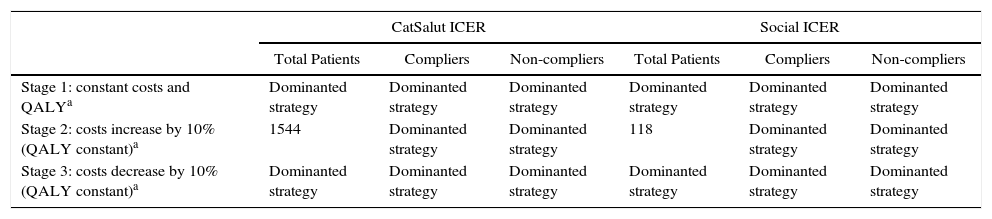
In the second year, the costs of OSAHS diagnosis and CPAP calibration were zero. The sensitivity analysis shows that with a 10% increase in costs, the ICER for CatSalut and for society would be €1544/QALY and €118/QALY, respectively, for the overall study population. If costs are reduced by 10%, the cost per QALY in both cases becomes negative. In any stage, the use of CPAP is a dominant strategy compared to non-use (Table 7).
ICER Projection After the Second Year of CPAP use − Sensitivity Analysis.
| CatSalut ICER | Social ICER | |||||
|---|---|---|---|---|---|---|
| Total Patients | Compliers | Non-compliers | Total Patients | Compliers | Non-compliers | |
| Stage 1: constant costs and QALYa | Dominanted strategy | Dominanted strategy | Dominanted strategy | Dominanted strategy | Dominanted strategy | Dominanted strategy |
| Stage 2: costs increase by 10% (QALY constant)a | 1544 | Dominanted strategy | Dominanted strategy | 118 | Dominanted strategy | Dominanted strategy |
| Stage 3: costs decrease by 10% (QALY constant)a | Dominanted strategy | Dominanted strategy | Dominanted strategy | Dominanted strategy | Dominanted strategy | Dominanted strategy |
CatSalut: Catalan Health Service; CPAP: continuous positive airway pressure; ICER: incremental cost-effectiveness ratio; QALY: quality-adjusted life year.
This study shows that CPAP treatment is cost-effective after the second year and only in compliant patients. The lack of cost-effectiveness in the first year can be attributed to the costs of disease diagnosis and CPAP titration required during that period. Home-based titration would reduce costs to €163.87 per night, although some patients may need 2–3 attempts to achieve correct titration.
CPAP is not cost-effective in non-compliers in any year, since these patients lose QALYs, converting CPAP into a treatment dominated in economic terms by the option of not treating with CPAP. This finding underscores the need for proper patient education and follow-up of CPAP adherence, as reported in the Spanish study by Fenin et al.29 These authors, after applying a Markov model with a Poisson distribution to calculate transition rates between health statuses, concluded that CPAP is a dominant strategy which provides a mean annual saving of €155 per patient (€777 over a 5-year period).
In the first year of CPAP, OSAHS diagnosis and treatment implies an incremental cost for CatSalut of €51,147 per QALY gained in the overall study population; based on the cost-effectiveness thresholds selected, therefore, this is not a cost-effective strategy. However, after the second year of use, these costs disappear and the strategy becomes cost-effective (€47,334 for the overall sample and €26,976 for compliant patients), with a lower ICER than that of other interventions accepted within the health system, such as treatment of hypercholesterolemia in primary prevention ($54,000–$1400,000/QALY).30 This result is obtained by a mean increase in HRQoL of 0.07 QALY after 1 year of CPAP in compliant patients, comparable to the 0.073 observed at 3 months in the Spanish study of Mar et al.,15 and by a reduction in the use of healthcare resources by these patients, also observed in previous studies.31
Previous studies have estimated the cost-effectiveness of CPAP using alternative methodologies. Guest et al.,17 in a study performed in the British National Health Service, extended the time horizon to 14 years, and, like us, concluded that CPAP is cost-effective compared to no treatment after the second year. In Spain, Ayas et al.16 found an ICER of $3354 per QALY gained with CPAP compared to no CPAP over 5 years, assuming a compliance rate of 70% after the first year. Another study from the Basque Country15 obtained an ICER of €7861 per QALY for a 5-year time horizon (although they did not include the costs of road traffic accidents), and €4938 per QALY for the patient's entire life.
The rate of CVEs fell from 15.8% to 5.1% in the overall population, and completely disappeared in compliant patients. For non-compliers, the percentage of CVEs increased, but not significantly. Since our patients had moderate-severe OSAHS, they may develop cardiovascular complications as the protective effect of the CPAP treatment is lost, as has been shown in other studies.4,6
This is the first observational study that has analyzed the impact of CPAP on quality of life and the appearance of CVEs during 1 year of follow-up, since most previous studies were based on probabilistic estimations16,17 with a duration of scarcely 3 months.15 However, our study does present some limitations. The first is that it was performed in the setting of the healthcare services of Catalonia, and in a single hospital. Its applicability to other autonomous communities in Spain may differ, particularly due to variations in the costs of diagnostic tests. Secondly, the quality of life results were based on patients’ self-perception, so they lack a standard reference and objective criterion, and can only be interpreted subjectively. Moreover, our results are not applicable to patients with mild forms of OSAHS, since this population was not included in our study. Finally, the results of the sensitivity analysis for the second year of treatment are still estimates based on suppositions and not on real hard data, so they are subject to some uncertainty and must be interpreted with caution.
In conclusion, CPAP treatment in patients with moderate-severe OSAHS improves quality of life, reduces healthcare costs and is cost-effective after the second year. Good CPAP compliance reduces cardiovascular risk and is a less expensive and more effective strategy that not using CPAP. For these reasons, we must improve therapeutic compliance by placing an emphasis on patient education and the control of side effects, and reconsider funding in patients whose compliance is less than 4h a night.
FundingThis study was supported by a grant from the companies VitalAire and Gasmedi from the Air Liquide group.
AuthorshipAll authors participated in the review of the intellectual content of this manuscript, and approved the final version. RC, RV and LPLL participated equally in writing the manuscript. RC, RV and MM had access to the data and are responsible for the accuracy of the statistical analysis. Study conception and design: RC, RV and LPLL. Data collection: RC, SS, LC and SHF. Data analysis and interpretation: RC, RV, MM and LPLL.
Conflict of interestsThe authors state that they have no conflict of interests.
We thank Mrs Yolanda Tornay for her help with the economic data and Dr. Misericòrdia Carles for her invaluable contribution.
Please cite this article as: Català R, Villoro R, Merino M, Sangenís S, Colomés L, Hernández Flix S, et al. Análisis coste-efectividad del tratamiento con presión positiva continua de la vía aérea en el síndrome de apnea-hipopnea durante el sueño (SAHS) moderado-grave. Arch Bronconeumol. 2016;52:461–469.


