
In Europe, tuberculosis (TB) continues to be a serious public health problem with a high incidence in large urban areas.1,2 Portugal, an EU country with one of the largest TB incidence rate (16.5 cases/100,000 inhabitants in 2016), clearly demonstrates an inequality pattern of TB incidence distribution in the country, with major TB high-risk municipalities found in the principal urban centres.3,4 The present study aimed to describe the risk factors associated with the risk to develop tuberculosis in the two largest metropolitan areas of Portugal. We also analyze differences between two of the largest metropolitan areas of Portugal in these risk factors.
A retrospective study based on official data on the number of TB cases and information on TB risk factors [National TB Surveillance System; National Institute of Health Dr. Ricardo Jorge; National Statistics Institute], from January 2010 to December 2014 concerning the two largest Metropolitan Areas [Lisbon – LMA and Porto – PMA] was conducted using municipalities as units of analysis [18 for LMA and 17 for PAM].
The between-individual (municipalities) variability and the longitudinal data profile were assembled by a linear regression model with a random effect (RE) at the intercept for the single municipality grouping level.5 For the identification of the best model, regressions with different fixed linear predictors, random effects structures, residual correlation matrixes and residual variances were considered. Comparison between models was based on the likelihood ratio test for nested models and on the Bayesian Information Criteria (BIC) otherwise. Statistical analysis was performed with the R language and software environment for statistical computation, version 3.3.2 Statistical significance was set at 0.05.
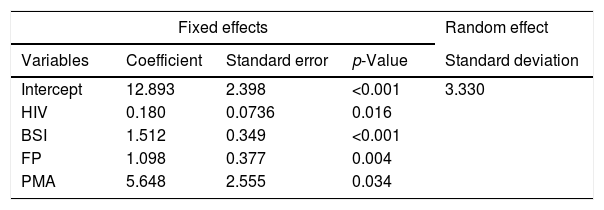
The results from the regression analysis are presented in Table 1. For any of the two metropolitan areas, the model shows that TB incidence grows significantly in a linear trend with infection by the human immunodeficiency virus (HIV), beneficiaries of social income (BSI) and foreign population (FP). The model with the standardized variables shows BSI as the most influential explanatory variable. For any fixed values of the covariates, PMA is expected to have a mean TB-incidence rate higher than LMA in 5.65 units [5.65 TB cases/100,000 inhabitants]. The between-municipality variability, estimated by the random effect, was of 17.2%. Moreover, would all municipalities be under the same conditions as far as HIV-infection, BSI and FR are concerned, then Póvoa de Varzim (resp. Vila Nova de Gaia) would be the municipality with the largest (resp. lowest) TB-incidence rate in PMA. Likewise, Alcochete (resp. Mafra) would present the largest (resp. lowest) TB-incidence rate in LMA. These results follow from the predicted values for the random effect at each municipality.
Estimates from the final mixed-effects regression model. The best structure for the residual correlation matrix was an intra-municipality time autocorrelation structure of order 1, with a coefficient estimated at 0.350 (95%CI=[0.105, 0.556]). The residual standard deviation was 7.300.
| Fixed effects | Random effect | |||
|---|---|---|---|---|
| Variables | Coefficient | Standard error | p-Value | Standard deviation |
| Intercept | 12.893 | 2.398 | <0.001 | 3.330 |
| HIV | 0.180 | 0.0736 | 0.016 | |
| BSI | 1.512 | 0.349 | <0.001 | |
| FP | 1.098 | 0.377 | 0.004 | |
| PMA | 5.648 | 2.555 | 0.034 | |
HIV – human immunodeficiency virus; BSI – beneficiaries of social income; FP – foreign population; PMA – porto metropolitan area.
The association between TB and low socio-economic level is well established.6 Poverty is a complex variable as it is frequently associated with other social determinants (housing conditions, crowding, unemployment, education, occupation), that act in a synergic way despite constituting RF per se.2,4,7 The immigration variable from countries with a high TB incidence has also been described as a RF, and in 2015 Portugal was one of the European countries that presented a high portion of cases of HIV/TB co-infection [10–14.9%].8 The selected statistical model shows that the way the risk factors BSI, HIV and FP influence TB incidence rate is not significantly different between LMA and PMA. However, if LMA and PMA score the same values on those variables then the model expects PMA to have a larger TB incidence rate.
It is historically documented that PMA has a population with a lower education level, a higher unemployment rate and overcrowding when compared with LMA. PMA has a higher share of fishing and rural population, and lately has suffered due to the deindustrialisation related to the European economic crisis. The late increasing rate of unemployment in PMA has resulted in seasonal emigration waves which provide contact with population of countries where TB incidence is higher. In fact, there seems to be a historical–social dimension – characterized by a vast number of factors which vary geographically and should not be neglected – that influence the TB rate incidence on a regional level. This fact becomes more evident when it is observed that the random effect municipality is reflected in a higher or lower TB incidence.
In PMA, the municipality that showed the highest tendency for TB (Póvoa do Varzim, RE=4.46) is a municipality characterized by fishing and rural areas, and the one with least tendency (Vila Nova de Gaia, RE=−3.56) is the largest municipality of PMA (21% of the PMA area), with the largest population (300,000 inhabitants) and also with a significant rural area (18.8% of its area). However, since 2004 it has been implemented in Vila Nova de Gaia municipality a contact screening programme that has allowed to identify potential at-risk contacts, raise the adherence to TB screening from 67.6% to 87.3% of the identified contacts, and raise latent TB infection treatment completion rates from 83% to 96%.9 This fact suggests that not only different RF for TB may have a different weight in the development of the disease in different municipalities of the same metropolitan area, but also that the TB prevention must be planned from a local point of view.
In conclusion, poverty, foreign population and HIV infection were identified as the RFs mostly associated with the TB incidence rate in the two largest metropolitan areas of the country. TB risk factors widely covered in the literature do not totally explain the reason why TB incidence rate has in some instances very significant variation between different regions of the same country. In the particular case of metropolitan areas, these should not be considered as homogenous entities, but should be treated as complex structures where variations of risk factors occur at a municipality level. There are historical–social dimensions of the development of the communities and previous sanitary interventions that probably are the fundament of these differences and which must be taken into account in the planning and implementation of prevention strategies on a local scale.
Rita Gaio and Óscar Felgueiras were partially supported by CMUP (UID/MAT/00144/2013), which is funded by FCT (Portugal) with national (MEC) and European structural funds (FEDER), under the partnership agreement PT2020.


