Journal Information
Share
Share
Download PDF
More article options
Visits
801
Original Article
Full text access
Available online 21 November 2024
Clinical and Social Characterization of Patients Hospitalized for COPD Exacerbation Using Machine Learning Tools
Visits
801
Manuel Casal-Guisandea,b,d,
Corresponding author
manuel.casal.guisande@uvigo.es

Corresponding author.
, Cristina Represas-Represasb,c,d, Rafael Golpee, Alberto Fernández-Garcíab,f, Almudena González-Montaosb,c, Alberto Comesaña-Camposg,h, Alberto Ruano-Raviñai,j,k, Alberto Fernández-Villarb,c,d
a Fundación Pública Galega de Investigación Biomédica Galicia Sur, Hospital Álvaro Cunqueiro (Vigo), Spain
b NeumoVigo I+i, Galicia Sur Health Research Institute (IIS Galicia Sur), SERGAS-UVIGO , Spain
c Pulmonary Department, Hospital Álvaro Cunqueiro (Vigo), Spain
d Centro de Investigación Biomédica en Red Enfermedades Respiratorias (CIBERES), Instituto de Salud Carlos III (ISCIII), Spain
e Pulmonary Department, Hospital Lucus Augusti (Lugo), Spain
f Department of Radiodiagnosis, Hospital Ribera POVISA (Vigo), Spain
g Department of Design in Engineering, Universidade de Vigo (Vigo), Spain
h DESAINS, Galicia Sur Health Research Institute (IIS Galicia Sur), SERGAS-UVIGO, Spain
i Department of Preventive Medicine and Public Health, Universidade de Santiago de Compostela (Santiago de Compostela), Spain
j Health Research Institute of Santiago de Compostela (IDIS), Spain
k Centro de Investigación Biomédica en Red de Epidemiología y Salud Pública (CIBERESP), Instituto de Salud Carlos III (ISCIII), Spain
Ver más
This item has received
Article information
Abstract
Full Text
Bibliography
Download PDF
Statistics
Figures (4)
Show moreShow less
Tables (2)
Table 1. Cohort and Cluster Characteristics.
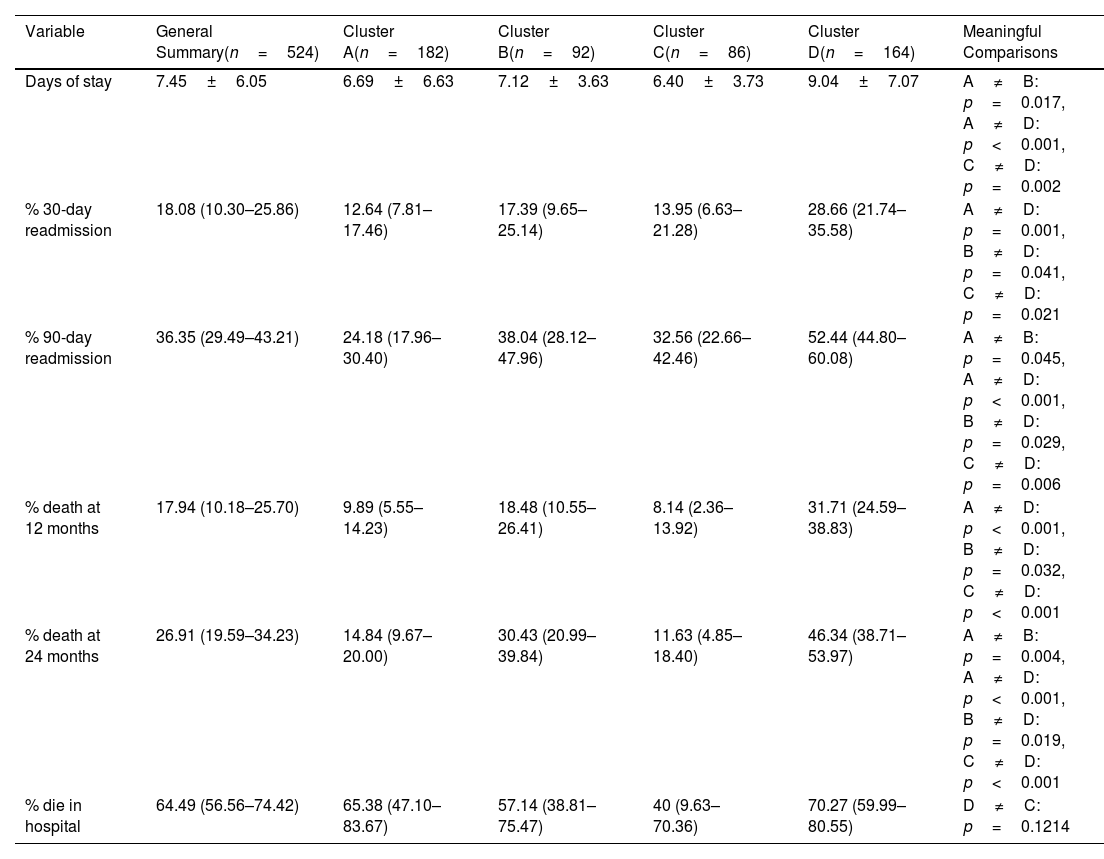
Table 2. Comparison of Indicators of Medical Resource Consumption and Prognostic Indicators Between Clusters.
Show moreShow less
Additional material (1)
Abstract
Objective

This study aims to employ machine learning (ML) tools to cluster patients hospitalized for acute exacerbations of chronic obstructive pulmonary disease (COPD) based on their diverse social and clinical characteristics. This clustering is intended to facilitate the subsequent analysis of differences in clinical outcomes.

Methods

We analysed a cohort of patients with severe COPD from two Pulmonary Departments in north-western Spain using the k-prototypes algorithm, incorporating demographic, clinical, and social data. The resulting clusters were correlated with metrics such as readmissions, mortality, and place of death. Additionally, we developed an intelligent clinical decision support system (ICDSS) using a supervised ML model (Random Forest) to assign new patients to these clusters based on a reduced set of variables.

Results

The cohort consisted of 524 patients, with an average age of 70.30±9.35 years, 77.67% male, and an average FEV1 of 44.43±15.4. Four distinct clusters (A–D) were identified with varying clinical–demographic and social profiles. Cluster D showed the highest levels of dependency, social isolation, and increased rates of readmissions and mortality. Cluster B was characterized by prevalent cardiovascular comorbidities. Cluster C included a younger demographic, with a higher proportion of women and significant psychosocial challenges. The ICDSS, using five key variables, achieved areas under the ROC curve of at least 0.91.

Conclusions

ML tools effectively facilitate the social and clinical clustering of patients with severe COPD, closely related to resource utilization and prognostic profiles. The ICDSS enhances the ability to characterize new patients in clinical settings.

Keywords:
Chronic obstructive pulmonary disease
Exacerbation
Mortality
Social determinants of health
Machine learning
Clustering
Intelligent clinical decision support system
Full Text
Introduction

Chronic obstructive pulmonary disease (COPD) is a highly prevalent disease with a high rate of associated mortality and disability.1 Based on the available evidence, the incidence of COPD is expected to increase in the coming decades. This would result in a significant increase in the disease's burden on both the health and social spheres.1,2

From a clinical perspective, the management of COPD patients is complex, particularly in the context of acute exacerbations (AECOPD), which often require hospital care. Consequently, a significant proportion of these patients are frequently readmitted within the subsequent weeks and months, which has a profound impact on both the patient and the healthcare system.1,3

The complexity of COPD is largely attributed to the inherent variability among patients, which tends to intensify with the advancement of the disease. This complicates the estimation of aspects related to resource consumption (hospitalisations, readmissions), as well as patient prognosis, understood in terms of mortality.4,5 In this context, numerous studies have been published employing conventional statistical approaches with the objective of characterising patients and identifying risk factors related to these events. These studies have primarily focused on the clinical and demographic spheres, with a much lesser emphasis on the social sphere.6,7 The results of these studies have been inconsistent, possibly reflecting the wide heterogeneity of the disease, which is influenced not only by clinical factors, but also by the patient's immediate environment. It is recommended that these models incorporate more detailed and diverse information from levels other than demographic and clinical, such as those related to the social level.8–10

In this context, the utilisation of techniques derived from the field of artificial intelligence (AI) has also been investigated, primarily from the domain of machine learning (ML), employing supervised learning approaches.10,11 Nevertheless, the outcomes yielded are modest, exhibiting metrics comparable to those documented in more conventional studies.5,12 Nevertheless, no proposals have been identified that apply unsupervised learning,10,11 particularly those oriented towards the identification of potentially useful clusters in a dataset,13 which could be of interest in the field of COPD. Moreover, the identification of these clusters would facilitate the examination of relationships with key indicators of health and social resource consumption or disease prognosis. This would enable the identification of those most vulnerable to these events, allowing for the provision of more comprehensive care.

We set out to identify clusters of COPD patients admitted for AECOPD using unsupervised learning approaches, drawing on a comprehensively characterized dataset that includes clinical, demographic, and social information. We also aimed to assess the impact of these patient groups on resource utilization and evaluate their prognostic outcomes. Upon consolidating these clusters, we proceeded to develop an intelligent clinical decision support system (ICDSS) to enhance clinical decision-making processes. This system would be based on a small number of predictor variables and would be capable of determining to which cluster a new patient with COPD belonged. This would facilitate and streamline the associated decision-making processes.

MethodsStudy Cohort

The data used in this study were collected from a prospective cohort between 2018 and 2022. The study included 545 patients who were closely followed for two years after admission for AECOPD in the Pulmonary Department of two third-level hospitals in northwest Spain. The reference population was 655,000 people.

The study was approved by the Ethics and Research Committee of Galicia (code 2016/524) and all patients were prospectively and consecutively recruited. Cases initially included in which a diagnosis of COPD was ruled out during follow-up or an alternative diagnosis to AECOPD was determined were excluded. For the diagnosis of AEPOC and its exclusion, the recommendations of the GesEPOC guideline were followed.14 In no case was admission motivated solely by social problems.

Following an interval of three to four days after admission, the patient and their caregiver were informed by the healthcare staff and a social worker, and informed consent was obtained. A systematic collection of clinical, demographic and social information was carried out through a review of their electronic medical records, as well as an interview with the patient and their caregiver. This methodology has been previously described in other studies.15,16 A summary of the variables recorded is presented in the first column of Tables 1 and 2.

Table 1.

Cohort and Cluster Characteristics.

Variable  General Summary(n=524)  Cluster A(n=182)  Cluster B(n=92)  Cluster C(n=86)  Cluster D(n=164)  Meaningful Comparisons 
% male sex  77.67 (73.63–81.72)  79.12 (73.22–85.03)  86.96 (80.07–93.84)  61.63 (51.35–71.91)  79.27 (73.06–85.47)  AC: p=0.004, BC: p<0.001, CD: p=0.004 
Age  70.30±9.35  70.31±7.80  73.62±8.28  59.48±7.76  74.11±7.80  AB: p=0.002, AC: p<0.001, AD: p<0.001, BC: p<0.001, CD: p<0.001 
BMI (kg/m227.81±6.18  29.01±6.37  27.39±5.76  25.30±6.51  28.03±5.63  AC: p<0.001, BC: p=0.008, CD: p<0.001 
% active smoker  35.31 (28.42–42.19)  30.22 (23.55–36.89)  21.74 (13.31–30.17)  79.07 (70.47–87.67)  25.61 (18.93–32.29)  AC: p<0.001, BC: p<0.001, CD: p<0.001 
% high alcohol consumption  15.46 (7.59–23.33)  12.09 (7.36–16.82)  13.04 (6.16–19.93)  27.91 (18.43–37.39)  14.02 (8.71–19.34)  AC: p=0.002, BC: p=0.023, CD: p=0.012 
% drug abuse  5.53 (0.00–13.86)  1.65 (0.00–3.50)  1.09 (0.00–3.21)  24.42 (15.34–33.50)  2.44 (0.08–4.80)  AC: p<0.001, BC: p<0.001, CD: p<0.001 
Num. of admissions within the previous year  0.83±1.30  0.10±0.33  1.67±1.14  0.87±1.23  1.16±1.65  AB: p<0.001, AC: p<0.001, AD: p<0.001, BC: p<0.001, BD: p<0.001 
% previous sputum culture within the previous year  24.24 (16.78–31.69)  14.29 (9.20–19.37)  38.04 (28.12–47.96)  17.44 (9.42–25.46)  31.10 (24.02–38.18)  AB: p<0.001, AD: p<0.001, BD: p=0.004, CD: p=0.030 
% pneumococcal vaccination  62.02 (56.75–67.30)  73.08 (66.63–79.52)  81.52 (73.59–89.45)  19.77 (11.35–28.18)  60.98 (53.51–68.44)  AC: p<0.001, AD: p=0.022, BC: p<0.001, BD: p=0.001, CD: p<0.001 
% influenza vaccination previous year  78.82 (74.88–82.76)  88.46 (83.82–93.10)  93.48 (88.43–98.52)  36.05 (25.90–46.20)  82.32 (76.48–88.16)  AC: p<0.001, BC: p<0.001, CD: p=0.021 
Total eosinophils (total/μL)  130.10±170.24  127.97±179.48  118.68±151.96  159.78±201.41  123.29±150.28  Not significant 
FEV1 percentage  44.43±15.45  47.64±16.02  42.48±14.24  43.35±14.98  42.53±15.26  AB: p=0.007, AC: p=0.040, AD: p=0.003 
Dyspnoea mMRC  2.27±0.89  1.79±0.71  2.27±0.81  2.07±0.76  2.90±0.80  AB: p<0.001, AC: p=0.005, AD: p<0.001, BD: p<0.001, CD: p<0.001 
CAT score  20.87±7.29  18.96±7.20  20.46±6.62  20.08±7.72  23.65±6.73  AD: p<0.001, BD: p<0.001, CD: p<0.001 
% anaemia  11.83 (3.79–19.87)  8.24 (4.25–12.24)  16.30 (8.76–23.85)  0.00 (0.00–0.00)  19.51 (13.45–25.58)  AC: p=0.014, AD: p=0.004, BC: p<0.001, BD: p<0.001, CD: p<0.001 
% cardiovascular disease  29.58 (22.40–36.77)  19.78 (13.99–25.57)  55.43 (45.22–65.59)  4.65 (0.20–9.10)  39.02 (31.56–46.49)  AB: p<0.001, AD: p=0.002, BC: p<0.001, BD: p<0.001, CD: p<0.001 
% obstructive sleep apnoea  17.56 (9.78–25.33)  17.58 (12.05–23.10)  17.39 (9.65–25.14)  12.79 (5.73–19.84)  20.12 (14.95–25.29)  Not significant 
% depression and/or anxiety  22.14 (14.58–29.69)  14.84 (9.67–20.00)  14.13 (7.00–21.25)  27.91 (18.43–37.39)  31.71 (24.59–38.83)  AC: p=0.017, AD: p<0.001, BC: p<0.001, BD: p=0.038, CD: p<0.001 
% hypertension  47.14 (40.91–53.36)  42.31 (35.13–49.49)  71.74 (62.55–80.94)  18.60 (10.38–26.83)  53.66 (46.03–61.29)  AB: p<0.001, AD: p<0.001, BC: p<0.001, BD: p<0.001, CD: p=0.007 
% arteriopathy  19.27 (11.58–26.97)  14.29 (9.20–19.37)  22.83 (14.26–31.40)  10.47 (4.01–16.93)  27.44 (20.61–34.27)  AD: p=0.045, BD: p=0.004, CD: p=0.003 
% diabetes mellitus  21.95 (14.38–29.51)  20.88 (14.97–26.78)  26.09 (17.11–35.06)  8.14 (2.36–13.92)  28.05 (21.17–34.92)  AC: p=0.015, AD: p=0.003, CD: p<0.001 
% cancer  5.72 (2.59–8.85)  5.49 (2.18–8.81)  7.61 (2.19–13.02)  2.33 (0.04–4.66)  6.71 (3.14–10.27)  Not significant 
% continuous home oxygen therapy  46.95 (40.71–53.18)  32.42 (25.62–39.22)  63.04 (53.17–72.91)  23.26 (14.33–32.18)  66.46 (59.24–73.69)  AB: p<0.001, AD: p<0.001, BC: p<0.001, BD: p<0.001, CD: p<0.001 
% home non-invasive ventilation  14.89 (6.99–22.78)  11.54 (6.18–16.90)  19.57 (11.46–27.67)  8.14 (2.36–13.92)  19.51 (13.45–25.58)  Not significant 
% triple inhaled therapy  56.49 (50.84–62.14)  56.04 (48.83–63.25)  58.70 (48.63–68.76)  55.81 (45.32–66.31)  56.10 (48.50–63.69)  Not significant 
% double bronchodilation  33.01 (26.01–40.02)  37.36 (30.33–44.39)  33.70 (24.04–43.35)  33.73 (23.73–43.71)  27.44 (20.61–34.27)  Not significant 
% combination LABA/ICS  6.49 (0–14.77)  4.95 (1.80–8.09)  5.43 (0.08–10.07)  5.81 (0.87–10.76)  9.15 (4.73–13.56)  Not significant 
% other inhaled therapies  4.01 (0–12.40)  1.65 (0–3.50)  2.17 (0–5.15)  4.65 (0.20–9.10)  7.31 (3.33–11.30)  AD: p=0.020 
% primary level of education  83.59 (80.12–87.06)  83.52 (78.13–88.91)  82.61 (74.86–90.35)  76.74 (67.82–85.66)  87.80 (82.80–92.79)  CD: p=0.037 
% rural area residence  51.53 (45.57–57.49)  67.03 (60.20–73.86)  42.39 (32.29–52.49)  36.05 (25.90–46.20)  47.56 (39.92–55.20)  AB: p<0.001, AC: p<0.001, BD: p=0.019, CD: p<0.001 
% monthly income <800€  57.44 (51.86–63.03)  57.14 (49.95–64.33)  44.57 (34.41–54.73)  69.77 (60.06–79.48)  58.54 (50.99–66.09)  BC: p=0.015, BD: p=0.004, CD: p=0.041 
% active employment status  4.58 (0.00–12.93)  2.75 (0.37–5.12)  2.17 (0.00–5.15)  19.77 (11.35–28.18)  0.00 (0.00–0.00)  AC: p<0.001, BC: p<0.001, CD: p<0.001 
% home ownership  70.42 (65.76–75.09)  84.62 (79.37–89.86)  71.74 (62.55–80.94)  32.56 (22.66–42.46)  73.78 (66.95–80.60)  AC: p<0.001, AD: p=0.018, BC: p<0.001, BD: p=0.003, CD: p<0.001 
% living alone  17.56 (9.78–25.33)  22.53 (16.46–28.60)  15.22 (8.80–21.64)  30.23 (20.53–39.94)  6.71 (3.14–10.27)  AD: p<0.001, BC: p<0.001, BD: p=0.048, CD: p<0.001 
% social relations restricted to the family  19.66 (11.98–27.33)  11.54 (6.90–16.19)  8.70 (3.29–14.12)  36.05 (25.90–46.20)  36.59 (28.99–44.19)  AC: p<0.001, AD: p<0.001, BC: p<0.001, BD: p<0.001 
% previous use of social services resources  24.24 (16.78–31.69)  17.03 (12.05–23.10)  17.39 (9.65–25.14)  29.07 (19.37–38.77)  35.37 (28.12–42.62)  AD: p<0.001, BD: p=0.004, CD: p=0.030 
Number of basic activities with dependency  0.74±1.28  0.01±0.10  0.01±0.10  0.05±0.21  2.33±1.24  AD: p<0.001, BD: p<0.001, CD: p<0.001 
Number of instrumental activities with dependency  3.06±2.53  2.01±1.99  2.78±2.10  1.10±1.57  5.42±1.88  AB: p=0.005, AC: p<0.001, AD: p<0.001, BC: p<0.001, BD: p<0.001, CD: p<0.001 
Table 2.

Comparison of Indicators of Medical Resource Consumption and Prognostic Indicators Between Clusters.

Variable  General Summary(n=524)  Cluster A(n=182)  Cluster B(n=92)  Cluster C(n=86)  Cluster D(n=164)  Meaningful Comparisons 
Days of stay  7.45±6.05  6.69±6.63  7.12±3.63  6.40±3.73  9.04±7.07  AB: p=0.017, AD: p<0.001, CD: p=0.002 
% 30-day readmission  18.08 (10.30–25.86)  12.64 (7.81–17.46)  17.39 (9.65–25.14)  13.95 (6.63–21.28)  28.66 (21.74–35.58)  AD: p=0.001, BD: p=0.041, CD: p=0.021 
% 90-day readmission  36.35 (29.49–43.21)  24.18 (17.96–30.40)  38.04 (28.12–47.96)  32.56 (22.66–42.46)  52.44 (44.80–60.08)  AB: p=0.045, AD: p<0.001, BD: p=0.029, CD: p=0.006 
% death at 12 months  17.94 (10.18–25.70)  9.89 (5.55–14.23)  18.48 (10.55–26.41)  8.14 (2.36–13.92)  31.71 (24.59–38.83)  AD: p<0.001, BD: p=0.032, CD: p<0.001 
% death at 24 months  26.91 (19.59–34.23)  14.84 (9.67–20.00)  30.43 (20.99–39.84)  11.63 (4.85–18.40)  46.34 (38.71–53.97)  AB: p=0.004, AD: p<0.001, BD: p=0.019, CD: p<0.001 
% die in hospital  64.49 (56.56–74.42)  65.38 (47.10–83.67)  57.14 (38.81–75.47)  40 (9.63–70.36)  70.27 (59.99–80.55)  DC: p=0.1214 

Clinical (such as drug use, comorbidities, questionnaires or test results), demographic (sex, age, BMI, etc.), inhaled treatment [triple therapy, double bronchodilation, long-acting beta-adrenergic (LABA) and inhaled corticosteroids (ICS) combinations, and other therapies, mainly nebulized short-acting bronchodilators administered as scheduled], and discharge support, as well as social variables, were included. Social variables included level of education (primary and secondary or university), area of residence (rural or urban), monthly income (more or less than 800€), employment status (active or pensioner), housing situation (ownership or not), cohabitation characteristics (living alone or accompanied), previous use of social services resources, type of social relationships (only with family or also with friends and neighbours), as well as the number of basic activities with dependency (feeding, dressing, bathing, toilet use, going up/down stairs and chair transferring) and the number of instrumental activities with dependency (house cleaning, food preparation, laundry, telephone use, shopping activity, managing finances, taking medication and using public transport). In addition to these variables, further data was collected on events related to resource consumption (such as the average length of stay and readmissions at 30 and 90 days) and prognoses (such as mortality at 1 and 2 years). Furthermore, the place of death (home, socio-health residence or hospital) was also considered. This was achieved through follow-up through electronic medical records and mortality registers.

Conceptual Design of the Study

Fig. 1 presents the flow chart detailing the methodology of the study, which consists of two main blocks.

Figure 1.

Methodology of the study. It comprised two distinct blocks. Block 1 concerns the clustering of the initial population, which yielded four clusters. Subsequently, the clusters are subjected to a comparative analysis, with a view to determining their impact on resource consumption. Block 2 concerns the development of an intelligent clinical decision support system. This system is based on a reduced set of predictors and allows the assignment of a cluster label to a new patient, thereby facilitating the associated decision-making processes.

(0.72MB).
Block #1

The objective of Block 1 was to cluster the patients in the cohort based on all the variables collected. Prior to this, data pre-processing was carried out, including the rescaling of continuous variables and the analysis of the presence of asymmetric distributions. Due to the heterogeneous nature of the variables, which include both continuous data and nominal or categorical data,17,18 the k-prototypes algorithm19 was employed. This algorithm is particularly suitable for these situations, and it was used in conjunction with the elbow method,13 a graphical method that employs a heuristic approach to select the optimal number of clusters. After the analysis, four clusters were identified.

Once the groups had been determined, a statistical analysis was conducted to examine the differences between them. In the case of continuous variables, the Mann–Whitney U test was employed.20 In the case of nominal variables, the Chi-squared test20 was employed. A significance level of 5% was deemed appropriate.

Block #2

Once the clusters had been validated, in the Block 2 the ICDSS was developed. In essence, the ICDSS aims to assist in classifying a new patient into one of the four clusters determined in Block 1 using a reduced set of variables. For the definition of the ICDSS inference engine, the previous cohort and the identified clusters, which served as labels, were employed. Furthermore, the cohort was divided into two sets: the training set, comprising 80% of the cohort, and the test set, comprising the remaining 20%.

Given that the cohort presents a large number of variables, which could complicate its use in clinical practice, a feature selection approach is applied with the aim of determining a subset of predictive variables. In this instance, recursive feature elimination (RFE)21 was deemed the most appropriate. RFE enables the optimal subset of features to be selected iteratively, whereby the least important features are eliminated, and the model is retrained until the desired set is reached. In this instance, an ensemble model, specifically a Random Forest, was selected due to its high predictive capacity21 and its robustness to overfitting. It is important to note that RFE requires specifying the number of variables to be selected. Three scenarios with 5, 10 and 15 variables were considered, without exceeding this number, as the predictive capacity of the model hardly improved.

Quantitative variables were expressed as their mean and standard deviation and qualitative variables as their percentage and 95% confidence intervals.

Further explanation of the use of AI techniques can be found in the appendix.

The study was conducted on a laptop (AMD Ryzen 9 7940HS processor with an NVIDIA GeForce RTX 4070 GPU graphics card and 32 GB of RAM) with Python (version 3.10.13). Python was used instead of other environments commonly used in clinical practice, such as SPSS©, due to its versatility in data processing and the wide range of available libraries. The libraries kmodes (version 0.12.2), scipy (version 1.11.4) and scikit-learn (version 1.3.0) were used.

ResultsStudy Population

Of the 545 patients initially enrolled in the study, 524 were ultimately included in the analysis, as 21 of them exhibited a loss of a specific variable. Of these, 77.67% were male, with an age of 70.30±9.35 years. The variables presented in Table 1 were subjected to cluster analysis, which yielded four clusters: cluster A (n=182), cluster B (n=92), cluster C (n=86) and cluster D (n=164). A graphical representation of the patient profiles is presented in Fig. 2, which was created using Chat GPT-4 from OpenAI. Below is a general description of each cluster based on the information from Table 1.

Figure 2.

Recreation of patient profiles in each cluster. Generated with Chat GPT-4 (OpenAI).

(0.32MB).
Cluster A – Slightly Younger Males With Milder COPD, Low Dependency, and Predominantly From Rural Areas

This is the most frequent group (33.33%), comprising predominantly male individuals with an intermediate age, frequency of active smoking, comorbidities and need for home oxygen therapy between clusters B/D and C. They exhibit the mildest disease, with fewer previous exacerbations and a higher level of dyspnoea and FEV1. Most of these individuals reside in rural areas and in their own homes. These individuals demonstrate a high level of social integration and a low dependency on basic and instrumental activities, which is reflected in their lower propensity to seek assistance from social services.

Cluster B – Older Males With Heart Disease, in Good Socioeconomic Condition, and Predominantly From Urban Areas

This cluster represents 16.88% of patients. It exhibits the highest proportion of males, a greater number of previous hospitalisations, and a higher frequency of immunisations for influenza and pneumococcus. It is noteworthy for a high prevalence of cardiovascular comorbidities and a high frequency of requiring home oxygen therapy. The cluster exhibits a high level of social relations, a superior economic situation in comparison to the other clusters, and a tendency to reside predominantly in urban areas. The individuals in this cluster have minimal limitations in their ability to perform basic activities and an intermediate level of need for assistance with instrumental activities.

Cluster C – Younger Individuals With a Balanced Gender Distribution and Significant Psychosocial Impact

This group accounts for 15.77% of the study subjects. It is the youngest age group with a higher percentage of women. The subjects in this group exhibit lower BMI, lower rates of immunisation, and levels of dyspnoea, clinical impact, and FEV1 that are similar to those observed in clusters B and D. However, they are much older and exhibit a lower incidence of home oxygen therapy. It is notable that this group exhibits a high prevalence of active smoking, alcohol and other drug intake, and a diagnosis of anxiety and/or depression. The lowest income and home ownership rates are observed among this group, with almost 20% not being pensioners and a high level of previous assessments by social workers. The greatest proportion of this group live alone and have the fewest social relations, despite being the least dependent of all.

Cluster D – Older Males With a High Degree of Dependency and Multiple Comorbidities

This group represents the second most frequent cluster (30.09%), and despite exhibiting the same pulmonary function as other clusters, they report a higher level of dyspnoea and a greater clinical impact. The group exhibits a high prevalence of comorbidities, with no single condition predominating. Two-thirds of the group require home oxygen therapy and are those who most frequently receive nebulized bronchodilators as maintenance treatment. All the individuals in this cluster are pensioners, and they are the least likely to live alone. This is because they have the highest degree of dependence for both basic and instrumental activities, and they have made the most frequent use of social services. They are the most isolated, with their social contacts restricted to family and carers.

Association of Clusters With COPD Variables and Events

Table 2 presents a comparison of the main indicators of medical resource consumption or disease prognosis and place of mortality between the clusters. A total of four patients died in socio-health residences, with two in cluster B and two in cluster D.

In general, patients included in cluster D have the longest hospital stay at index admission and the highest frequency of readmissions at 30 and 90 days, as well as the highest mortality during follow-up. Furthermore, cluster D is the group with the highest frequency of in-hospital mortality. Those included in cluster B have intermediate values, while both the mean length of stay and readmissions are lower in clusters A and C, despite their younger age and fewer systemic comorbidities.

Intelligent Clinical Decision Support System

As previously mentioned, the ICDSS aims to classify a new patient into one of the four determined clusters using a reduced number of variables (three scenarios have been considered, with 5, 10, and 15 predictive variables). Fig. 3 presents the ROC curves, together with a graph showing the importance of the variables in the three scenarios. The importance of each variable was determined by analysing how the impurity is reduced in each of the nodes of the trees that make up the Random Forest, averaging them.

Figure 3.

The ICDSS aims to classify a new patient into one of the four determined clusters using a reduced number of variables. The inference engine of the ICDSS was a Random Forest model. The upper graphs show the ROC curves with the Random Forest model, predicting the cluster label of a new patient using 5, 10 and 15 predictor variables obtained through RFE. ROC curves have been calculated on the test set. The graph below shows the importance of each of the variables in the Random Forest model after the application of RFE.

(0.19MB).

As can be observed, when five variables (number of basic and instrumental activities with dependency, together with age, BMI and number of hospitalisations in the previous year) are considered, the area under the curve (AUC) values exceed 0.9 for the allocation of patients to clusters in the test set. With 10 variables (FEV1 value, dyspnoea level, total eosinophils, CAT score, pneumococcal vaccination are added), the AUC values exceed 0.95 for the assignment of patients to clusters in the test set, and with 15 variables (home ownership, previous influenza vaccination, active smoking, hypertension, heart disease are added) the AUC values are almost unitary.

Discussion

This study proposes an original and unique clustering and classification method using proven and well-known AI tools for a complete characterization of patients hospitalized in Pulmonary Departments for COPD exacerbation. Thus, the application of unsupervised learning algorithms enables the identification of four distinct clusters, characterized by clear variations in demographic, clinical and social aspects. Following this, the ICDSS is developed, which is supported by the use of supervised learning approaches, to assist in classifying which cluster a new patient belongs to based on a reduced set of easily accessible variables. Moreover, the clustering correlates well with different health and social resource consumption profiles and prognoses.

This architecture, based on machine learning models and centred on cluster identification, is crucial for the subsequent clinical analysis. The conclusions drawn from each group are made possible by the specific configuration and application of the learning algorithms, which differ from traditional statistical models not only in their ability to handle complex and dense data sets, but also in their ability to establish an operational framework that ensures the reliability of the results. This stability in clustering, achieved through an optimal configuration of parameters, makes the results more robust and coherent. This allows the identified clusters to be analysed from a clinical perspective, facilitating medical judgement.

The confidence gained from the clustering process helps in the interpretation of chronic obstructive pulmonary disease. COPD provides an illustrative case of a disease where the social determinants of health exert a significant influence, manifesting as structural violence.22 A multitude of conditioning factors in this domain not only impact the development of the disease but also contribute to its under-diagnosis, inadequate control, and unfavourable prognosis.

It is essential that comprehensive care and the design of effective disease interventions consider patients’ social issues holistically, in addition to demographic and clinical variables.8,9,22 In fact, this clustering approach, including clinical and social variables, would allow for different strategies, emphasizing the recommendations of clinical guidelines1,14 and addressing other aspects of the social sphere. Patients in cluster A, due to their milder COPD and good autonomy with adequate social support, do not require specific sociodemographic evaluations, except for the fact that, given their higher prevalence of residence in rural areas, their inclusion in telemedicine programs could be considered to facilitate their follow-up. For patients in cluster B, specific attention to their social situation does not appear necessary, and from a clinical perspective, particular care should be taken in managing cardiovascular comorbidities and chronic respiratory failure.1,14 For those in cluster C, a comprehensive intervention that includes psychological support is needed, with a focus on addiction treatment. Additionally, due to their social isolation and low income, it is important they receive financial assistance and be included in social reintegration and assisted housing programs.23 Finally, patients in cluster D, with high dependency and multiple comorbidities, require comprehensive palliative care focused on the advanced stage of the disease. In these cases, it is crucial to ensure proper coordination between health and social services, with interventions that guarantee adequate support at home or in specialized units for these patients, as well as caregiver support programs.22 Nevertheless, in developed countries, approaches with this vision have only been partial and heterogeneous.8,9,22,24 The interrelationship between clinical and social aspects and their reciprocal influence is complex and difficult to define. Several studies have recently demonstrated that social isolation and loneliness resulting from physical limitations caused by the disease, which impede participation in social and family activities, lead to a perception of poorer quality of life and an increased impact on health.8,9,22,24 However, to date, no global characterization of patients has been carried out, including the most important variables of the demographic, clinical and social spheres, as is done in this study. This is necessary to define differentiated patterns that would require different comprehensive, more rehabilitative and social support actions, such as those that would be necessary in the clusters described.

Of particular note is cluster D, which presents the most severe clinical and social impact and consumption of resources of all kinds. Cluster C in this study exhibits a distinct gender profile from the other clusters, and although this may be attributed to their younger age, they nevertheless exert a comparatively minimal impact on the health system. However, they do necessitate social interventions and are patients with a suboptimal quality of life and a high prevalence of anxiety and substance abuse. Both groups are the most socially isolated, although for different reasons. In group D, this is due to their dependence, while in group C it is due to social exclusion. This particular aspect has not been subjected to analysis in two recent studies examining the influence of social relationships on quality of life and resource utilisation in patients with COPD.8,9

Although patients in cluster D are the most likely to have the worst outcome, they are also the most likely to die in hospital. This may reflect deficiencies in our end-of-life home care setting in this disease.25

In Spain, in contrast to other European and North American countries, the percentage of women among those hospitalized for COPD exacerbation is still between 20% and 30%.26 As previously observed,15 there are significant gender differences at all levels, which are confirmed in this study, where most women are found in cluster C. This fact should be considered in strategies for the care of the disease, since in Spain there is a clear trend towards an increase in hospitalisations for COPD in women.27

As in other studies using large institutional databases,26,28 our work confirms the importance of cardiovascular comorbidity, which is the main characteristic of cluster B, which also has a poor prognosis and high resource consumption, although its social situation is much more favourable than that of the other groups.

In addition to other variables already described in studies on readmission and mortality,5,12 such as age, number of previous hospitalisations, BMI, FEV1, degree of dyspnoea or clinical impact determined by CAT, among others, which are already included in several prognostic indices, the important value of the number of basic and instrumental activities for which the patient needs help, which are key to characterize patients and possibly determinants for predicting events, as shown in other studies not specifically focused on COPD, stands out in this study.29

The methodology of this study is robust and based on the use of proven techniques that are widely used in the state of the art, such as k-prototypes,19 chosen for their versatility in handling continuous and nominal data. These techniques, essentially unsupervised learning approaches, can find clusters within a dataset without the need to provide prior information on how these partitions should be performed based on expert knowledge.30,31 In the health domain, several studies can be highlighted that attempt to cluster patients in a cohort,30–33 which is also very useful in the context of COPD, as described above. The usefulness and significance of the clusters were also analysed using statistical tests. The ICDSS inference engine was then developed to allow the classification of new patients based on a reduced set of predictor variables, thereby optimising the translation of the results obtained into clinical practice. This highlights the key advantage of artificial intelligence over traditional statistical techniques: its ability to handle complex, high-dimensional datasets where conventional methods may lose predictive power. AI models learn and adapt continuously, allowing them to generalise better than traditional approaches.34,35 Furthermore, they facilitate the implementation of predictive models in clinical practice, improving decision-making.

This study has several limitations, such as the fact that it was carried out in the Pulmonary Departments of only two hospitals, which may limit the external validation of the results described. The large number of variables collected by professionals with expertise in these fields made it difficult to include many centres, although the small number of easily obtainable variables that allow their characterization in this study will make it much easier to verify these results in other cohorts in subsequent studies. It is important to acknowledge that, although variables related to dependency are commonly recorded by nursing staff for the development of care plans and patient needs, they are not typically integrated systematically into electronic health records, which may hinder their accessibility and use in routine clinical practice. On the other hand, the study was carried out in two centres in two different provinces that serve 95% of the reference population of their health areas, and the demographic and clinical characteristics described for patients admitted for exacerbations of COPD are similar to those described in other recent large Spanish studies.26 Depending on the characteristics of the reference population of each centre, the prevalence of each cluster is likely to be different.

However, the study presents remarkable strengths in addition to those already mentioned, such as the systematic and individualised collection by expert researchers in the clinical and social fields, the confirmation of the diagnosis of previous COPD by spirometry in all cases, and the close follow-up with virtually no loss of patients.

We believe that both the results of this study and the methodology used provide a different view of hospitalized COPD patients, taking into account the important and complex relationship between all aspects of the patient's life and the socio-health impact and prognosis, using the opportunities offered by new AI tools that will surely help us in the coming years to better understand the enormous heterogeneity of the disease and to provide more comprehensive and personalised care to this type of patient.

Funding

This research did not receive any specific grant from funding agencies in the public, commercial, or not-for-profit sectors.

Declaration of Generative AI and AI-assisted Technologies in the Writing Process

Fig. 2 was produced with the help of Chat GPT-4 (OpenAI).

Conflicts of Interest

Fernandez-Villar A. declares research support, lecture fees and participation in advisory board in AstraZeneca, Chiesi, Grifols and GlaxoSmithKline. Represas-Represas C. has received honoraria in the past 3 years for lecturing, scientific consulting, clinical trial participation, or publication writing for: AstraZeneca, Boehringer Ingelheim, Chiesi, Faes farma, and GlaxoSmithKline.

Appendix B
Supplementary Data

The following are the supplementary data to this article:

References
[1]
A. Agustí, B.R. Celli, G.J. Criner, D. Halpin, A. Anzueto, P. Barnes, et al.
Global Initiative for Chronic Obstructive Lung Disease 2023 Report: GOLD Executive Summary.
Arch Bronconeumol, 59 (2023), pp. 232-248
[2]
J.B. Soriano, A.A. Abajobir, K.H. Abate, S.F. Abera, A. Agrawal, M.B. Ahmed, et al.
Global, regional, and national deaths, prevalence, disability-adjusted life years, and years lived with disability for chronic obstructive pulmonary disease and asthma, 1990–2015: a systematic analysis for the Global Burden of Disease Study 2015.
Lancet Respir Med, 5 (2017), pp. 691-706
[3]
M. Miravitlles, C. García-Polo, A. Domenech, G. Villegas, F. Conget, C. De La Roza.
Clinical outcomes and cost analysis of exacerbations in chronic obstructive pulmonary disease.
Lung, 191 (2013), pp. 523-530
[4]
R. Chow, O.W. So, J.H.B. Im, K.R. Chapman, A. Orchanian-Cheff, A.S. Gershon, et al.
Predictors of readmission, for patients with chronic obstructive pulmonary disease (COPD) – a systematic review.
Int J COPD, 18 (2023), pp. 2581-2617
[5]
V. Bellou, L. Belbasis, A.K. Konstantinidis, I. Tzoulaki, E. Evangelou.
Prognostic models for outcome prediction in patients with chronic obstructive pulmonary disease: systematic review and critical appraisal.
BMJ, 367 (2019), pp. l5358
[6]
L.J.E. Smith, E. Moore, I. Ali, L. Smeeth, P. Stone, J.K. Quint.
Prognostic variables and scores identifying the end of life in COPD: a systematic review.
Int J COPD, 12 (2017), pp. 2239-2256
[7]
C. Esteban, A. Castro-Acosta, C.J. Alvarez-Martínez, A. Capelastegui, J.L. López-Campos, F. Pozo-Rodriguez.
Predictors of one-year mortality after hospitalization for an exacerbation of COPD.
BMC Pulm Med, 18 (2018), pp. 1-10
[8]
A.L. Stoustrup, D.J.A. Janssen, N. Nakken, E.F.M. Wouters, A. Marques, U.M. Weinreich, et al.
Association of inadequate social support and clinical outcomes in patients with chronic obstructive pulmonary disease – a cross-sectional study.
Respir Med, 226 (2024),
[9]
M. Vukmirovic, K.H. Benam, J.J. Rose, S. Turner, C.M. Magin, D. Lagares, et al.
National prevalence of social isolation and loneliness in adults with chronic obstructive pulmonary disease.
Ann Am Thorac Soc, 20 (2023), pp. 1-11
[10]
S.J. Russell, P. Norvig.
Artificial intelligence. A modern approach.
4th edition, Pearson Education, (2022),
[11]
J. Antão, J. de Mast, A. Marques, F.M.E. Franssen, M.A. Spruit, Q. Deng.
Demystification of artificial intelligence for respiratory clinicians managing patients with obstructive lung diseases.
Expert Rev Respir Med, 17 (2023), pp. 1207-1219
[12]
L.A. Smith, L. Oakden-Rayner, A. Bird, M. Zeng, M.S. To, S. Mukherjee, et al.
Machine learning and deep learning predictive models for long-term prognosis in patients with chronic obstructive pulmonary disease: a systematic review and meta-analysis.
Lancet Digit Health, 5 (2023), pp. e872-e881
[13]
J. Han, M. Kamber, J. Pei.
Data mining: concepts and techniques.
3rd edition, Morgan Kaufmann, (2012),
[14]
Working Group of the GesEPOC.
Clinical practice guideline for the diagnosis and treatment of patients with chronic obstructive pulmonary disease (COPD) – the Spanish COPD Guideline (GesEPOC).
Arch Bronconeumol, 53 (2017), pp. 1-64
[15]
S. Fernández-García, C. Represas-Represas, A. Ruano-Raviña, M. Mosteiro-Añón, C. Mouronte-Roibas, A. Fernández-Villar.
Perfil social de los pacientes que ingresan por una agudización de EPOC. Un análisis desde una perspectiva de género.
Arch Bronconeumol, 56 (2020), pp. 84-89
[16]
A. Fernández Villar, R. Golpe Gómez, A. González Montaos, S. Fernández García, L. Pazos Area, A. Priegue Carrera, et al.
The impact of the SARS-CoV-2 pandemic on the demographic, clinical and social profiles of patients admitted to the Pneumology Department for a COPD exacerbation.
PLoS One, 18 (2023),
[17]
A. Agresti.
Categorical data analysis.
John Wiley & Sons, Inc., (2002),
[18]
D. Powers, Y. Xie.
Statistical methods for categorical data analysis.
Emerald Group Publishing, (2008),
[19]
Z.X. Huang.
Clustering large datasets with mixed numeric and categorical values.
First Pacific-Asia knowledge discovery and data mining conference, pp. 21-34
[20]
M.L. Samuels, J.A. Witmer, A.A. Schaffner.
Statistics for the life sciences.
5th edition, Pearson Education, (2016),
[21]
H. Jeon, S. Oh.
Hybrid-recursive feature elimination for efficient feature selection.
Appl Sci, 10 (2020), pp. 3211
[22]
P.J. Williams, S.C. Buttery, A.A. Laverty, N.S. Hopkinson.
Lung disease and social justice: chronic obstructive pulmonary disease as a manifestation of structural violence.
Am J Respir Crit Care Med, 209 (2024), pp. 938-946
[23]
R.E. Mete.
Chronic disease: examining the impact of social support on psychological well-being among Canadian individuals with COPD: implications for government policies.
Yale J Biol Med, 97 (2024), pp. 125
[24]
I. Bouloukaki, A. Christodoulakis, K. Margetaki, A. Aravantinou Karlatou, I. Tsiligianni.
Exploring the link between social support and patient-reported outcomes in chronic obstructive pulmonary disease patients: a cross-sectional study in primary care.
Healthcare (Basel), 12 (2024), pp. 544
[25]
A. Fernández-García, M. Pérez-Ríos, C. Candal-Pedreira, C. Represas-Represas, A. Fernández-Villar, M.I. Santiago-Pérez, et al.
Where do chronic obstructive pulmonary disease patients die? 8-Year trend, with special focus on sex-related differences.
Int J Chron Obstruct Pulmon Dis, 17 (2022), pp. 1081-1087
[26]
J.L. Izquierdo, J.M. Rodríguez, C. Almonacid, M. Benavent, R. Arroyo-Espliguero, A. Agustí.
Real-life burden of hospitalisations due to COPD exacerbations in Spain.
ERJ Open Res, 8 (2022), pp. 00141-2022
[27]
A. Fernández-García, M. Pérez-Ríos, A. Fernández-Villar, C. Candal-Pedreira, G. Naveira-Barbeito, M.I. Santiago-Pérez, et al.
Hospitalizations due to and with chronic obstructive pulmonary disease in Galicia: 20 years of evolution.
Rev Clin Esp, 222 (2022), pp. 569-577
[28]
A. Fernández-García, M. Pérez-Ríos, A. Fernández-Villar, G. Naveira, C. Candal-Pedreira, M.I. Santiago-Pérez, et al.
Four decades of COPD mortality trends: analysis of trends and multiple causes of death.
J Clin Med, 10 (2021), pp. 1-11
[29]
N.K. Schiltz, M.A. Dolansky, D.F. Warner, K.C. Stange, S. Gravenstein, S.M. Koroukian.
Impact of instrumental activities of daily living limitations on hospital readmission: an observational study using machine learning.
J Gen Intern Med, 35 (2020), pp. 2865-2872
[30]
A.M. Flores, A. Schuler, A.V. Eberhard, J.W. Olin, J.P. Cooke, N.J. Leeper, et al.
Unsupervised learning for automated detection of coronary artery disease subgroups.
J Am Heart Assoc, 10 (2021),
[31]
Y. Jiang, Z.G. Yang, J. Wang, R. Shi, P.L. Han, W.L. Qian, et al.
Unsupervised machine learning based on clinical factors for the detection of coronary artery atherosclerosis in type 2 diabetes mellitus.
Cardiovasc Diabetol, 21 (2022), pp. 1-10
[32]
O. Pasin, S. Gonenc.
An investigation into epidemiological situations of COVID-19 with fuzzy K-means and K-prototype clustering methods.
[33]
K. Kusunose, T. Tsuji, Y. Hirata, T. Takahashi, M. Sata, K. Sato, et al.
Unsupervised cluster analysis reveals different phenotypes in patients after transcatheter aortic valve replacement.
Eur Heart J Open, 4 (2023), pp. 1-12
[34]
D.J. Hunter, C. Holmes.
Where medical statistics meets artificial intelligence.
N Engl J Med, 389 (2023), pp. 1211-1219
[35]
D. Bzdok, N. Altman, M. Krzywinski.
Statistics versus machine learning.
Nat Methods, 15 (2018), pp. 4
Copyright © 2024. SEPAR
Archivos de Bronconeumología
Article options
Tools

Are you a health professional able to prescribe or dispense drugs?