


High blood eosinophil count (BEC) is a useful biomarker for guiding inhaled corticosteroid therapy in patients with chronic obstructive pulmonary disease (COPD), yet its implications in a community setting remain underexplored. This study aimed to elucidate the clinical characteristics and outcomes of COPD patients with high BEC within the Chinese community.
MethodsWe obtained baseline and 2-year follow-up data from COPD patients (post-bronchodilator forced expiratory volume in 1 second/forced vital capacity <0.70) in the early COPD study. Patients with a BEC ≥300cells/μL were classified as the high BEC group. We assessed differences in the clinical characteristics and outcomes between high and low BEC patients. Subgroup analyses were conducted on COPD patients without a history of corticosteroid use or asthma.
ResultsOf the 897 COPD patients, 205 (22.9%) had high BEC. At baseline, high BEC patients exhibited a higher proportion of chronic respiratory symptoms, lower lung function, and more severe small airway dysfunction than low BEC patients. Over the 2-year period, high BEC patients experienced a significantly higher risk of acute exacerbations (relative risk: 1.28, 95% confidence interval: 1.09–1.49; P=0.002), even after adjusting for confounders. No significant difference was observed in lung function decline rates. The subgroup analysis yielded consistent results.
ConclusionsCOPD patients with high BEC in a Chinese community exhibited poorer health status, more severe small airway dysfunction, and a higher risk of exacerbations. Future research should explore the pathological mechanisms underlying the poorer prognosis in patients with high BEC.

Chronic obstructive pulmonary disease (COPD) is a heterogeneous lung condition characterized by persistent respiratory symptoms and airflow limitations,1 leading to increased morbidity and mortality.2 The use of biomarkers in COPD can help stratify patients, enhancing management and improving prognoses.3 The Global Initiative for Chronic Obstructive Lung Disease (GOLD) report recommends using high blood eosinophil count (BEC) as a criterion to identify individuals who are most likely to benefit from inhaled corticosteroid treatment,4 making this a useful biomarker for guiding therapeutic decisions.5–7
In recent years, there has been an increase in research on the clinical characteristics and outcomes of patients with high BEC, yet the findings have been inconsistent. The Evaluation Of COPD Longitudinally to Identify Predictive Surrogate Endpoints (ECLIPSE) cohort demonstrated that patients with high BEC had better baseline health status, including higher forced expiratory volume in 1 second (FEV1), and lower St. George's Respiratory Questionnaire and modified Medical Research Council (mMRC) scores.8 Analysis of data from a Copenhagen general population study indicated an elevated risk of exacerbations in patients with high BEC, aligning with results from other population-based studies.9–11 Furthermore, a Canadian study found a correlation between high BEC and an increased risk of lung function decline and undetected structural airway abnormalities.12 The variability in these results may be attributed to differences in the characteristics of the study population. However, to our knowledge, there have been no studies examining the clinical characteristics and outcomes of patients with high BEC within Chinese communities. Factors such as obesity, smoking status, use of biomass fuels, and exposure to particulate matter differ significantly in the Chinese population compared with other countries.13–16 These differences suggest that the clinical characteristics and outcomes of COPD patients with high BEC in China may differ from those in other regions. Therefore, investigating these characteristics and outcomes in Chinese communities is crucial to develop a sound theoretical foundation for the precise and effective management of COPD.
In light of this, we conducted an analysis using data from a prospective, observational cohort study in a Chinese community population. Our aim was to explore the clinical characteristics and 2-year outcomes of patients with high BEC, in comparison with those with low BEC.
MethodsStudy Design and ParticipantsThis study used data from the Early Chronic Obstructive Pulmonary Disease (ECOPD) study, registered with the Chinese Clinical Trial Registry (ChiCTR1900024643).17 The ECOPD study is a prospective, observational, population-based cohort study conducted in China. The rationale, design, and inclusion and exclusion criteria of the ECOPD study have been described elsewhere.17 Briefly, the study involved the continuous recruitment of subjects from communities in Guangdong Province from July 2019 to August 2021. Participants underwent various assessments, including questionnaire interviews, lung function tests, bronchodilation tests, chest computed tomography (CT) scans, and, in some cases, impulse oscillometry (IOS). We used the baseline data and 2-year follow-up data of patients with COPD from the ECOPD study.
QuestionnaireTrained staff conducted the questionnaire interviews, gathering demographic information, chronic respiratory symptoms, smoking status, smoking index, comorbidities, other potential risk factors for COPD, mMRC score, COPD assessment test score, and medical history.18 Chronic respiratory symptoms, self-reported by the patients, included chronic cough, phlegm, wheeze, and dyspnea. Patients were categorized as never-smokers if they had smoked fewer than 100 cigarettes in their lifetime; all others were classified as ever-smokers, which included current smokers (smoking at baseline) and former smokers (quit smoking at least 6 months prior to baseline).19 The questionnaire also assessed acute exacerbations during the preceding year. An acute exacerbation of COPD (AECOPD) was defined as the presence or worsening of at least two symptoms: cough, sputum production, purulent sputum, wheezing, and dyspnea lasting at least 48h, excluding other conditions such as left–right cardiac dysfunction, pulmonary embolism, pneumothorax, pleural effusion, arrhythmia, and other diseases.20 Acute exacerbations were categorized as mild (managed at home with additional medication), moderate (requiring outpatient or emergency medical treatment), or severe (requiring hospitalization). These exacerbations were assessed at baseline and annually thereafter.
Lung Function and IOSTo evaluate lung function, trained staff used a portable spirometer (CareFusion, Yorba Linda, CA, USA), following the American Thoracic Society and European Respiratory Society's operational methods and quality control standards.21 Each patient had at least three acceptable and two repeatable spirometry readings, including maximum and sub-maximum forced vital capacity (FVC) and FEV1 values, differing by no more than 150mL or 5%, respectively. A bronchodilator test was administered using salbutamol (Ventolin, GlaxoSmithKline) at a dose of 400μg, inhaled through a 500mL spacer. Spirometry was then repeated 20min post-inhalation. A post-bronchodilator FEV1/FVC ratio of less than 0.70 was indicative of COPD. We calculated predicted spirometry values using the 1993 European Community for Steel and Coal reference values, adjusted for the Chinese population with conversion factors (men, 0.95; women, 0.93).22,23 Lung function assessments were conducted at baseline and repeated annually for ongoing evaluation. IOS measurements were conducted using MasterScreen IOS (Hochberg, Germany), adhering to the European Respiratory Society guidelines.24 IOS evaluates respiratory resistance and reactance. The recorded IOS parameters included resistance at 5Hz (R5), resistance at 20Hz (R20), the differential between R5 and R20 (R5−R20), reactance at 5Hz (X5), reactance area (AX), and resonant frequency (Fres).
High-resolution CTHigh-resolution CT was performed using multidetector-row CT scanners (Siemens Definition AS Plus 128-slicers and United-imaging uCT 760 128-slicers).17 Each patient was instructed in breath-holding techniques at the end of deep inhalation and expiration prior to scanning to optimize imaging conditions. The quantitative assessment of gas trapping was performed using the low-attenuation area with attenuation values below −856 Hounsfield units (HU) on full-expiration CT (expiratory LAA−856). Emphysema was quantified by calculating the percentage of low-attenuation areas below −950HU on full-inspiration CT (inspiratory LAA−950).25
Blood Eosinophil Count MeasurementWhole blood samples were collected from patients in ethylenediamine tetraacetic anticoagulant tubes, followed by gentle inversion 3–5 times. Complete blood cell counts and differential counts were performed within 2h using automated hematology analyzers (Mindray BC-6800, DH71CR, and URIT5500). These analyzers were subject to daily internal quality control checks and biannual external quality control programs to maintain precision and accuracy. Patients with a BEC ≥300cells/μL were classified into the high BEC group at baseline.4
Statistical AnalysisContinuous variables are presented as mean±standard deviation or median (interquartile range [IQR]), while categorical variables are expressed as frequencies and percentages. Participants lacking baseline BEC data available were excluded from the analysis. Two independent sample t-tests, chi-square test, or Fisher's exact tests were used to compare clinical characteristics between groups. To evaluate the association of clinical measurements with baseline BEC and the annual decline in lung function during the study follow-up period, we developed multivariable linear regression models. We used Poisson regression models to investigate the relationship between BEC and the risk of exacerbations. All models were adjusted for variables, including age, sex, body mass index, smoking status, smoking index, passive smoking, biomass exposure, occupational history of dusts/gases/fumes, family history of respiratory diseases, history of asthma, and history of corticosteroid use. Given the potential influence of corticosteroid use history and asthma history on the assessment of clinical characteristics and patient outcomes in high BEC, we conducted subgroup analysis in patients without these histories. For all statistical analyses, SPSS 24.0 statistical software (IBM, Armonk, NY, USA) was used. A two-sided P value of <0.05 was considered statistically significant.
ResultsFig. 1 presents a flowchart of the study. Initially, 2055 subjects completed a respiratory epidemiology questionnaire and underwent spirometry. Of these, 33 had unavailable BEC, leaving 2022 subjects with BEC results. Subsequently, 1125 subjects with normal spirometry were excluded, resulting in 897 patients with spirometry-defined COPD included in the final analysis. Among these patients, 692 (77.1%) had a BEC of less than 300cells/μL, while 205 (22.9%) exhibited a BEC of 300cells/μL or more.
Baseline Characteristics of the Patients
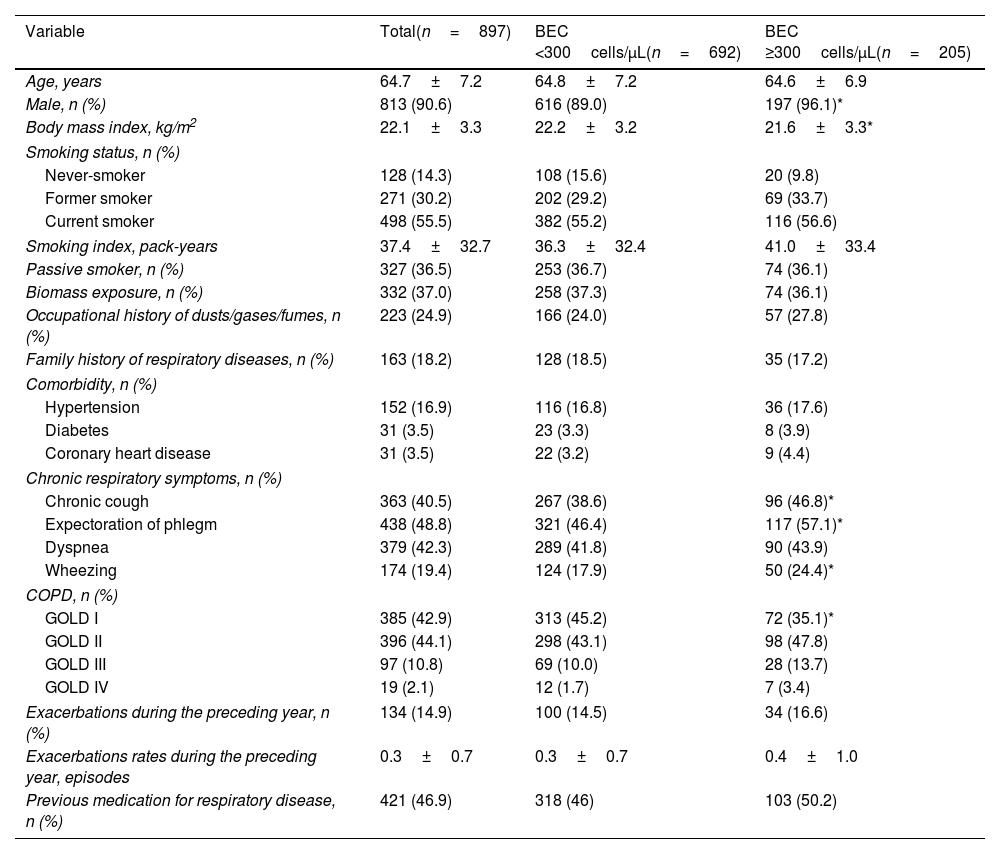
The baseline characteristics are detailed in Table 1. Compared with patients with low BEC, the high BEC cohort showed a significantly higher proportion of males (96.1% vs. 89.0%, P=0.002), lower BMI (21.6±3.3kg/m2 vs. 22.2±3.2kg/m2, P=0.010), and more chronic respiratory symptoms such as chronic cough (46.8% vs. 38.6%, P=0.035), chronic expectoration (57.1% vs. 46.4%, P=0.007), and wheezing (24.4% vs. 17.9%, P=0.040).
Baseline Clinical Characteristics of Patients With Chronic Obstructive Pulmonary Disease.
| Variable | Total(n=897) | BEC <300cells/μL(n=692) | BEC ≥300cells/μL(n=205) |
|---|---|---|---|
| Age, years | 64.7±7.2 | 64.8±7.2 | 64.6±6.9 |
| Male, n (%) | 813 (90.6) | 616 (89.0) | 197 (96.1)* |
| Body mass index, kg/m2 | 22.1±3.3 | 22.2±3.2 | 21.6±3.3* |
| Smoking status, n (%) | |||
| Never-smoker | 128 (14.3) | 108 (15.6) | 20 (9.8) |
| Former smoker | 271 (30.2) | 202 (29.2) | 69 (33.7) |
| Current smoker | 498 (55.5) | 382 (55.2) | 116 (56.6) |
| Smoking index, pack-years | 37.4±32.7 | 36.3±32.4 | 41.0±33.4 |
| Passive smoker, n (%) | 327 (36.5) | 253 (36.7) | 74 (36.1) |
| Biomass exposure, n (%) | 332 (37.0) | 258 (37.3) | 74 (36.1) |
| Occupational history of dusts/gases/fumes, n (%) | 223 (24.9) | 166 (24.0) | 57 (27.8) |
| Family history of respiratory diseases, n (%) | 163 (18.2) | 128 (18.5) | 35 (17.2) |
| Comorbidity, n (%) | |||
| Hypertension | 152 (16.9) | 116 (16.8) | 36 (17.6) |
| Diabetes | 31 (3.5) | 23 (3.3) | 8 (3.9) |
| Coronary heart disease | 31 (3.5) | 22 (3.2) | 9 (4.4) |
| Chronic respiratory symptoms, n (%) | |||
| Chronic cough | 363 (40.5) | 267 (38.6) | 96 (46.8)* |
| Expectoration of phlegm | 438 (48.8) | 321 (46.4) | 117 (57.1)* |
| Dyspnea | 379 (42.3) | 289 (41.8) | 90 (43.9) |
| Wheezing | 174 (19.4) | 124 (17.9) | 50 (24.4)* |
| COPD, n (%) | |||
| GOLD I | 385 (42.9) | 313 (45.2) | 72 (35.1)* |
| GOLD II | 396 (44.1) | 298 (43.1) | 98 (47.8) |
| GOLD III | 97 (10.8) | 69 (10.0) | 28 (13.7) |
| GOLD IV | 19 (2.1) | 12 (1.7) | 7 (3.4) |
| Exacerbations during the preceding year, n (%) | 134 (14.9) | 100 (14.5) | 34 (16.6) |
| Exacerbations rates during the preceding year, episodes | 0.3±0.7 | 0.3±0.7 | 0.4±1.0 |
| Previous medication for respiratory disease, n (%) | 421 (46.9) | 318 (46) | 103 (50.2) |
Data are presented as mean±standard deviation or n (%).
Abbreviations: BEC, blood eosinophil count; COPD, chronic obstructive pulmonary disease; GOLD, Global Initiative for Chronic Obstructive Lung Disease.
Patients with high BEC demonstrated significantly lower FEV1 % predicted (pred) (65.3±20.3% vs. 70.9±20.5%, unadjusted P=0.001, adjusted P=0.010), lower FVC % pred (93.6±18.5% vs. 97.2±20.1%, unadjusted P=0.020, adjusted P=0.115), lower FEV1 /FVC (54.4±11.4% vs. 57.1±10.0%, unadjusted P=0.001, adjusted P=0.023) before bronchodilator use. After bronchodilator use, patients with high BEC still had lower FEV1% pred (70.0±19.6% vs. 75.7±20.1%, unadjusted P<0.001, adjusted P=0.008), FVC % pred (97.3±17.6% vs. 101.2±18.9%, unadjusted P=0.008; adjusted P=0.080), lower FEV1/FVC (56.3±11.1% vs. 58.6±9.6%, unadjusted P=0.003, adjusted P=0.043) compared with patients with low BEC. Adjusted confounding factors included age, sex, BMI, smoking status, smoking index, passive smoking, biomass exposure, occupational history of dusts/gases/fumes, family history of respiratory disease, history of asthma, and history of corticosteroid use (Table 2). Subgroup analyses focusing on patients without a history of corticosteroid use and asthma yielded similar findings (Table S1).
Association Between Blood Eosinophil Counts and Clinical Measurements in Patients With Chronic Obstructive Pulmonary Disease.
| Parameter | BEC <300cells/μL | BEC ≥300cells/μL | Unadjusted | Adjusted† | ||
|---|---|---|---|---|---|---|
| Difference (95% CI) | P Value | Difference (95% CI) | P Value | |||
| mMRC dyspnea scale score | 0.52±0.69 | 0.57±0.76 | 0.06 (−0.06 to 0.17) | 0.327 | 0.04 (−0.07 to 0.15) | 0.446 |
| CAT score | 4.9±5.2 | 5.6±5.4 | 0.72 (−0.10 to 1.54) | 0.083 | 0.67 (−0.14 to 1.47) | 0.106 |
| Parameter | BEC <300cells/μL | BEC ≥300cells/μL | Unadjusted | Adjusted† | ||
|---|---|---|---|---|---|---|
| n=692 | n=205 | Difference (95% CI) | P Value | Difference (95% CI) | P Value | |
| Pre-bronchodilator spirometry | ||||||
| FEV1, L | 1.84±0.61 | 1.77±0.64 | −0.07 (−0.16 to 0.03) | 0.182 | −0.07 (−0.16 to 0.01) | 0.090 |
| FEV1% predicted, % | 70.9±20.5 | 65.3±20.3 | −5.60 (−8.79 to −2.42) | 0.001 | −4.00 (−6.99 to −0.93) | 0.010 |
| FVC, L | 3.19±0.81 | 3.20±0.78 | 0.01 (−0.11 to 0.14) | 0.833 | −0.04 (−0.15 to 0.07) | 0.497 |
| FVC % predicted, % | 97.2±20.1 | 93.6±18.5 | −3.66 (−6.74 to 0.58) | 0.020 | −2.42 (−5.44 to 0.59) | 0.115 |
| FEV1/FVC, % | 57.1±10.0 | 54.4±11.4 | −2.66 (−4.28 to −1.05) | 0.001 | −1.72 (−3.20 to −0.23) | 0.023 |
| MMEF % predicted, % | 25.6±12.1 | 23.2±11.6 | −2.41 (−4.28 to −0.53) | 0.012 | −2.01 (−3.88 to 0.23) | 0.027 |
| FEF50% predicted, % | 28.2±14.6 | 25.2±14.3 | −3.05 (−5.32 to −0.78) | 0.009 | −2.40 (−4.57 to −0.23) | 0.030 |
| FEF75% predicted, % | 21.4±10.5 | 19.5±9.3 | −1.92 (−3.52 to −0.33) | 0.018 | −2.08 (−3.68 to −0.47) | 0.011 |
| Parameter | BEC <300cells/μL | BEC ≥300cells/μL | Unadjusted | Adjusted† | ||
|---|---|---|---|---|---|---|
| n=692 | n=205 | Difference (95% CI) | P Value | Difference (95% CI) | P Value | |
| Post-bronchodilator spirometry | ||||||
| FEV1, L | 1.96±0.61 | 1.90±0.64 | −0.06 (−0.16 to 0.04) | 0.216 | −0.07 (−0.15 to 0.01) | 0.096 |
| FEV1% predicted, % | 75.7±20.1 | 70.0±19.6 | −5.68 (−8.80 to −2.56) | <0.001 | −3.94 (−6.86 to −1.02) | 0.008 |
| FVC, L | 3.32±0.78 | 3.33±0.78 | 0.01 (−0.11 to 0.14) | 0.815 | −0.04 (−0.14 to 0.07) | 0.503 |
| FVC % predicted, % | 101.2±18.9 | 97.3±17.6 | −3.92 (−6.82 to −1.01) | 0.008 | −2.51 (−5.33 to 0.30) | 0.080 |
| FEV1/FVC, % | 58.6±9.6 | 56.3±11.1 | −2.32 (−3.87 to −0.76) | 0.003 | −1.47 (−2.89 to −0.05) | 0.043 |
| MMEF % predicted, % | 28.1±12.3 | 25.9±11.4 | −2.29 (−4.17 to −0.40) | 0.017 | −2.06 (−3.87 to −0.24) | 0.026 |
| FEF50% predicted, % | 31.5±15.0 | 28.4±14.3 | −3.08 (−5.39 to −0.77) | 0.009 | −2.54 (−4.71 to −0.36) | 0.022 |
| FEF75% predicted, % | 23.0±10.0 | 22.1±10.0 | −0.93 (−2.49 to 0.64) | 0.247 | −1.17 (−2.75 to 0.41) | 0.146 |
| Parameter | BEC <300cells/μL | BEC ≥300cells/μL | Unadjusted | Adjusted† | ||
|---|---|---|---|---|---|---|
| n=637 | n=187 | Difference (95% CI) | P Value | Difference (95% CI) | P Value | |
| Impulse oscillometry | ||||||
| R5, kPa/L/s | 0.36±0.12 | 0.38±0.14 | 0.02 (0.00 to 0.04) | 0.114 | 0.02 (0.00 to 0.04) | 0.020 |
| R20, kPa/L/s | 0.27±0.07 | 0.27±0.07 | 0.00 (−0.01 to 0.01) | 0.633 | 0.00 (−0.01 to 0.01) | 0.437 |
| R5−R20, kPa/L/s | 0.09±0.08 | 0.11±0.10 | 0.02 (0.01 to 0.03) | 0.008 | 0.02 (0.01 to 0.03) | 0.007 |
| X5, kPa/L/s | −0.14±0.09 | −0.16±0.12 | −0.02 (−0.04 to 0.00) | 0.018 | −0.02 (−0.03 to 0.00) | 0.025 |
| AX, kPa/L | 0.98±1.08 | 1.24±1.38 | 0.26 (0.07 to 0.44) | 0.008 | 0.24 (0.06 to 0.43) | 0.010 |
| Fres, Hz | 17.3±6.4 | 18.7±6.7 | 1.35 (0.29 to 2.40) | 0.012 | 1.32 (0.29 to 2.36) | 0.012 |
| Parameter | BEC <300cells/μL | BEC ≥300cells/μL | Unadjusted | Adjusted† | ||
|---|---|---|---|---|---|---|
| n=692 | n=205 | Difference (95% CI) | P Value | Difference (95% CI) | P Value | |
| CT imaging | ||||||
| Inspiratory LAA−950, % | 1.9 (0.7–5.4) | 2.6 (0.9–7.5) | 1.34 (0.20 to 2.49) | 0.022 | 0.52 (−0.51 to 1.55) | 0.318 |
| Expiratory LAA−856, % | 23.0 (11.5–42.9) | 32.3 (13.8–52.1) | 5.65 (2.33 to 8.96) | 0.001 | 3.50 (0.59 to 6.40) | 0.018 |
Abbreviations: AX, the area of reactance; BEC, blood eosinophil count; CAT, COPD assessment test; CI, confidence interval; CT, computed tomography; FEF50, forced expiratory flow at 50% of forced vital capacity; FEF75, forced expiratory flow at 75% of forced vital capacity; FEV1, forced expiratory volume in one second; Fres, resonant frequency; FVC, forced vital capacity; LAA−856, low-attenuation area of the lung with attenuation values below −856 Hounsfield units on expiratory; LAA−950, low-attenuation area of the lung with attenuation values below −950 Hounsfield units on inspiratory; MMEF, maximal mid-expiratory flow; mMRC, modified British Medical Research Council Dyspnea score; R20, resistance at 20Hz; R5, resistance at 5Hz; R5−R20, difference from R5 to R20; X5, reactance at 5Hz.
Multivariable linear regression models adjusted for age, sex, body mass index, smoking status, smoking index, passive smoking, biomass exposure, occupational history of dusts/gases/fumes, family history of respiratory diseases, history of asthma, and history of corticosteroid use.
The bold values indicate that their corresponding p-values are less than 0.05.
Table 2 shows the association between BEC with clinical measures in COPD patients. Compared with patients with low BEC, those with high BEC had lower pre-bronchodilator small airway dysfunction (SAD)-related lung function parameters, including maximal mid-expiratory flow (MMEF) % pred (23.2±11.6% vs. 25.6±12.1%, unadjusted P=0.012, adjusted P=0.027), forced expiratory flow (FEF) 50% pred (25.2±14.3% vs. 28.2±14.6%, unadjusted P=0.009, adjusted P=0.030), and FEF75% pred (19.5±9.3% vs. 21.4±10.5%, unadjusted P=0.018, adjusted P=0.011). Post-bronchodilator, only MMEF % pred (25.9±11.4% vs. 28.1±12.3%, unadjusted P=0.017, adjusted P=0.026) and FEF50% pred (28.4±14.3% vs. 31.5±15.0%, unadjusted P=0.009, adjusted P=0.022) remained significantly lower in the high BEC group. SAD-related IOS parameters, including R5 (0.38±0.14kPa/L/s vs. 0.36±0.12kPa/L/s, unadjusted P=0.114, adjusted P=0.020), R5−R20 (0.11±0.10kPa/L/s vs. 0.09±0.08kPa/L/s, unadjusted P=0.008, adjusted P=0.007), AX (1.24±1.38kPa/L vs. 0.98±1.08kPa/L, unadjusted P=0.008, adjusted P=0.010), X5 (−0.16±0.12kPa/L/s vs. −0.14±0.09kPa/L/s, unadjusted P=0.018, adjusted P=0.025), and Fres (18.7±6.7Hz vs. 17.3±6.4Hz, unadjusted P=0.012, adjusted P=0.012), were significantly higher in the high BEC group. Additionally, high BEC patients exhibited significantly more air trapping (LAA−856: 32.3% [IQR 13.8–52.1] vs. 23.0% [IQR 11.5–42.9], unadjusted P=0.001, adjusted P=0.018). This relationship between high BEC and SAD persisted even after excluding patients with a history of corticosteroid use and asthma (Table S1).
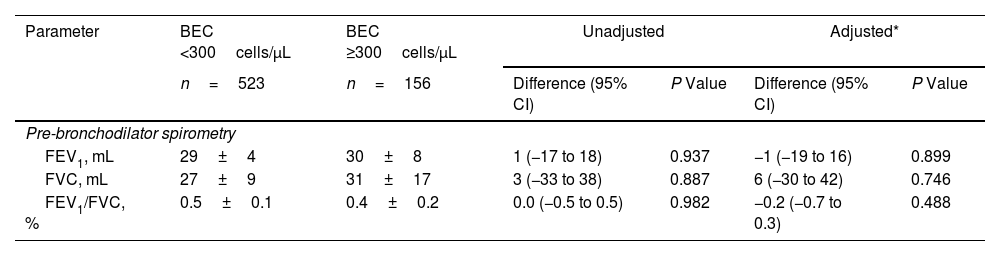
Decline in Lung Function and Risk of Acute ExacerbationIn this cross-sectional analysis of 897 patients, 771 (86.0%) – 591 with high BEC and 180 with low BEC – completed a follow-up questionnaire interview. A subset of 679 patients (75.7%), comprising 523 with high BEC and 156 with low BEC, underwent lung function testing (Fig. 1). Table 3 shows the association between BEC and annual decline in lung function. The comparison between patients with high and low BEC revealed no significant differences in the annual decline of pre-bronchodilator FEV1 (30±8mL vs. 29±4mL, unadjusted P=0.937, adjusted P=0.899), pre-bronchodilator FVC (31±17mL vs. 27±9mL, unadjusted P=0.887, adjusted P=0.746), and pre-bronchodilator FEV1/FVC ratio (0.4±0.2% vs. 0.5±0.1%, P=0.982, adjusted P=0.488). Similar non-significant differences were noted in post-bronchodilator measurements: FEV1 (31±8mL vs. 35±4mL, P=0.633, adjusted P=0.527), FVC (48±15mL vs. 49±8mL, P=0.950, adjusted P=0.726), and FEV1/FVC ratio (0.2±0.2% vs. 0.2±0.1%, P=0.950, adjusted P=0.365). However, Fig. 2 shows a significant association between BEC and the risk of exacerbations. The high BEC group exhibited a higher risk of acute exacerbations (relative risk: 1.28, 95% confidence interval: 1.09–1.49; adjusted P=0.002) and moderate–severe acute exacerbations (relative risk: 1.29, 95% confidence interval: 1.07–1.56; adjusted P=0.009) compared with the low BEC group (Fig. 2). This was further corroborated by subgroup analysis that excluded the patients with a history of corticosteroid use and asthma (Table S2 and Fig. S1).
Association Between Blood Eosinophil Counts and Annual Lung Function Decline in Patients With Chronic Obstructive Pulmonary Disease During the Study Follow-up Period.
| Parameter | BEC <300cells/μL | BEC ≥300cells/μL | Unadjusted | Adjusted* | ||
|---|---|---|---|---|---|---|
| n=523 | n=156 | Difference (95% CI) | P Value | Difference (95% CI) | P Value | |
| Pre-bronchodilator spirometry | ||||||
| FEV1, mL | 29±4 | 30±8 | 1 (−17 to 18) | 0.937 | −1 (−19 to 16) | 0.899 |
| FVC, mL | 27±9 | 31±17 | 3 (−33 to 38) | 0.887 | 6 (−30 to 42) | 0.746 |
| FEV1/FVC, % | 0.5±0.1 | 0.4±0.2 | 0.0 (−0.5 to 0.5) | 0.982 | −0.2 (−0.7 to 0.3) | 0.488 |
| Parameter | BEC <300cells/μL | BEC ≥300cells/μL | Unadjusted | Adjusted* | ||
|---|---|---|---|---|---|---|
| n=522 | n=156 | Difference (95% CI) | P Value | Difference (95% CI) | P Value | |
| Post-bronchodilator spirometry | ||||||
| FEV1, mL | 35±4 | 31±8 | −4 (−22 to 13) | 0.633 | −6 (−23 to 12) | 0.527 |
| FVC, mL | 49±8 | 48±15 | −1 (−33 to 31) | 0.950 | 6 (−27 to 39) | 0.726 |
| FEV1/FVC, % | 0.2±0.1 | 0.2±0.2 | 0.0 (−0.5 to 0.5) | 0.950 | −0.2(−0.7 to 0.3) | 0.365 |
Abbreviations: BEC, blood eosinophil count; CI, confidence interval; FEV1, forced expiratory volume in one second; FVC, forced vital capacity.

Our study revealed that 22.9% of COPD patients exhibited high BEC. This group had poorer health status, evidenced by increased chronic respiratory symptoms and more severe SAD. Over a 2-year follow-up period, patients with high BEC showed a greater risk of exacerbations compared with those with low BEC, even after adjusting for potential confounding factors. However, no significant difference was found in the rate of annual lung function decline between the two groups. These findings persisted in patients with no history of corticosteroid use or asthma.
Our findings coincide with previous studies showing that patients with high blood eosinophils generally have more chronic respiratory symptoms,26,27 even after excluding those with a history of corticosteroid use or a history of asthma. A plausible explanation for these results is that airway eosinophils and their secreted cytokines may increase airway hyperresponsiveness,27,28 a phenomenon closely associated with respiratory symptoms. Moreover, BEC can serve as a reliable surrogate marker for airway eosinophilic inflammation.8,29,30 Consequently, the high BEC group exhibited more chronic respiratory symptoms. However, in the ECLIPSE cohort,8 patients with persistent eosinophilia had lower scores on the St. George's Respiratory Questionnaire and the mMRC, suggesting variations may be due to differences in study populations. As COPD is characterized by persistent respiratory symptoms that can reduce quality of life and increase mortality,31,32 BEC are a highly valuable adjunctive tool for identifying symptomatic patients.
A notable observation emerging from our study was that patients with high BEC experienced more severe small airway dysfunction, despite no significant increase in the rate of emphysema. This observation is in line with findings from the CanCOLD study, which indicated that patients with elevated eosinophil counts exhibit increased airway remodeling.12 Furthermore, a recent German study identified sputum eosinophil count as an independent predictor for small airway dysfunction.33 These findings collectively suggest a strong association between high eosinophil counts and underlying small airway abnormalities. Our study further demonstrated this relationship from three distinct perspectives and maintains its validity in a subgroup analysis, providing a solid foundation for future experimental studies.
The relationship between BEC and the rate of lung function decline has been the focus of research, but results remain inconsistent. Although patients with high BEC initially had worse lung function, our study did not find any association between BEC and decline in lung function, in line with a previous study.8 In contrast, a large Korean cohort study found that high BEC was associated with the development of COPD.34 Coincidentally, the CanCOLD study identified a BEC of ≥300cells/μL as an independent risk factor for accelerated lung function decline.12 It is worth noting that our study included a higher proportion of males, ever-smokers and individuals with a lower body mass index, so the differences in study populations might account for these controversial results. Another potential explanation for the absence of a positive correlation in our study could be the heterogeneity of COPD. Eosinophilic inflammation is not a central feature in COPD, and other factors besides BEC may play a more significant part in lung function decline in our cohort35 that comprised mainly patients with low GOLD grade. The limited follow-up period and the one-time BEC measurement may also have contributed to the lack of correlation. Prior research has demonstrated significant fluctuations in BEC,8,36 with Schumann et al. noting considerable variability in COPD patients’ BEC over time.
In our study population, patients with elevated BEC were at a higher risk of both acute exacerbation and moderate-to-severe acute exacerbation, consistent with findings reported in previous studies.10,37 Although some groups used different BEC thresholds, their results generally supported our findings.9,11 Given that BEC is a reliable surrogate marker for airway eosinophilic inflammation and considering the evidence that eosinophilic airway inflammation contributes to COPD exacerbations not exclusively triggered by bacteria or viruses – approximately 30% of all COPD exacerbations are eosinophilic in nature30 – this observation further corroborates the link between high BEC and exacerbation risk. COPD exacerbations are known to adversely impact quality of life, lung function, and prognosis, often leading to a gradual decline.38,39 Therefore, high BEC warrants careful attention and monitoring. Some recent clinical trials focusing on COPD patients with high BEC revealed that treatment with monoclonal antibodies targeting interleukin 5 (IL-5) or its receptor-α (IL-5Rα) or IL-4Rα reduced the frequency of acute exacerbations compared with a placebo group.40–42 This finding opens new avenues for the development of more effective COPD treatment strategies.
The primary strength of this study is that it is the first population-based cohort study to investigate the clinical characteristics and long-term prognoses of patients with high BEC in China. Nevertheless, the study has several limitations. First, it analyzes lung function data over a subsequent two-year period, which is a relatively short follow-up period. This limited duration may potentially lead to a false-negative association between high BEC and the lung function decline rate. Second, BEC was measured only once. Previous studies have shown considerable variability in BEC,8,36 raising concerns about its reliability for predicting outcomes. However, other studies provide evidence that eosinophilic inflammation is a consistent phenotype in COPD.43,44 Third, there is a possibility that exacerbations remained unreported due to recall bias, potentially impacting the study results. Fourth, the small proportion of patients with severe to very severe COPD in our study might cause a bias. Fifth, despite its large number of patients, our cohort may not fully represent the entire Chinese population. Our findings should therefore be validated in other populations to improve the generalizability of our results. Lastly, the exclusion of data on parasitic infections, a known cause of high BEC, is a notable omission. However, the distribution of BEC in our study population was 170cells/μL (IQR: 100–280), in line with figures from regions with low parasitic infection rates.9
ConclusionsThis study demonstrated that patients with high BEC experience poorer health status, more severe small airway dysfunction, and a significantly higher risk of exacerbation. These findings emphasize the need for heightened attention to COPD patients with high BEC in clinical practice. Future research should focus on elucidating the pathological mechanisms behind poorer prognoses among patients with high BEC.
Ethical ApprovalThe study was approved by the Ethics Committee of The First Affiliated Hospital of Guangzhou Medical University (No. 2018-53).
Informed ConsentThe written informed consent was obtained from all participants.
FundingThis work was supported by the Foundation of Guangzhou National Laboratory (SRPG22-016 and SRPG22-018) and the Clinical and Epidemiological Research Project of State Key Laboratory of Respiratory Disease (SKLRD-L-202402). The Plan on Enhancing Scientific Research in Guangzhou Medical University (GMUCR2024-01012).
Authors’ ContributionsX.W., F.W., Y.Z., and P.R. had full access to all of the data in the study and X.W. take responsibility for the integrity of the data and the accuracy of the data analysis. Concept and design – P.R., Y.Z., X.W., Z.D., and F.W. Acquisition, analysis or interpretation of data – all authors. Statistical analysis – X.W. and F.W. Drafting of the manuscript – X.W., F.W., Z.D., Y.Z., and P.R. Study guarantor – X.W. Critical revision of the manuscript – all authors.
Competing InterestsNone declared.
We thank all participants who have consented to include their data for analysis. We thank the medical staff of the First Affiliated Hospital of Guangzhou Medical University (Qingsi Zeng, Xiaoyan Huang, Yu Deng, and Huai Chen), Lianping County People's Hospital (Litang Wu), and Wengyuan County People's Hospital (Xinghua Lan) for their assistance in conducting this study. We thank Zihui Wang, Shan Xiao, Xiang Wen, Bijia Lin, Shaodan Wei, Xiaopeng Ling, Wenjun Lai, and Qiaoyi He (State Key Laboratory of Respiratory Disease, National Clinical Research Center for Respiratory Disease, Guangzhou Institute of Respiratory Health, The First Affiliated Hospital of Guangzhou Medical University) for their efforts in collecting the information and verification.
The following are the supplementary data to this article:


