
The aim of this study was to compare the predictive value of two clinical prognostic models, the Spanish score and the simplified Pulmonary Embolism Severity Index (sPESI), in an independent cohort of patients diagnosed of acute symptomatic pulmonary embolism (PE).
MethodsWe performed a retrospective analysis of a cohort composed of 1447 patients with acute symptomatic PE. The Spanish score and the sPESI were calculated for each patient according to different clinical variables. We assessed the predictive accuracy of these scores for 30-day mortality, and a composite of non fatal recurrent venous thromboembolism and non fatal major bleeding, using C statistic, which was obtained by means of logistic regression and ROC curves.
ResultsOverall, 138 patients died (9.5%) during the first month of follow-up. Both scores showed an excellent predictive value for 30-day all-cause mortality (C statistic, 0.72 and 0.74), but the performance was poor for the secondary endpoint (C statistic, 0.60 and 0.59). The sPESI classified fewer patients as low risk (32% versus 62%; P<.001). Low-risk patients based on the sPESI had a lower 30-day mortality than those based on the Spanish score (1.1% versus 4.2%), while the 30-day rate of non fatal recurrent VTE or major bleeding was similar (2.2% versus 2.3%).
ConclusionsBoth scores provide excellent information to stratify the risk of mortality in patients treated of PE. The usefulness of these models for nonfatal adverse events is questionable. The sPESI identified low-risk patients with PE better than the Spanish score.
El objetivo de este estudio fue validar y comparar 2 escalas pronósticas, la escala española y la escala Pulmonary Embolism Severity Index simplificada (PESIs), en una cohorte de pacientes diagnosticados de tromboembolia de pulmón (TEP) aguda sintomática.
MétodosSe realizó un análisis retrospectivo de una cohorte de 1.447 pacientes diagnosticados consecutivamente de TEP aguda sintomática. Evaluamos el valor predictivo de las 2 escalas para muerte a 30días y para un episodio compuesto de recurrencia tromboembólica no mortal y hemorragia mayor no mortal mediante el estadístico C, empleando para su cálculo regresión logística y curvas ROC.
ResultadosDurante los primeros 30días de seguimiento fallecieron 138pacientes (9,5%). Las 2escalas mostraron un valor predictivo bueno para mortalidad a 30días (estadístico C, 0,72 y 0,74) y pobre para la predicción del episodio secundario (estadísticos C, 0,60 y 0,59). La escala PESIs clasificó una proporción significativamente menor de pacientes como de bajo riesgo, comparada con la escala española (32% versus 62%; p<0,001). La mortalidad del grupo de bajo riesgo según la escala PESIs fue menor que la de la escala española (1,1% versus 4,2%). La proporción de episodios no mortales fue similar en el grupo de bajo riesgo de ambos modelos (2,2% versus 2,3%).
ConclusionesLa escala española y la escala PESIs presentaron excelente capacidad discriminatoria para la mortalidad a 30días. La escala PESIs fue más segura para identificar a los pacientes con TEP y bajo riesgo de complicaciones precoces.
Pulmonary embolism (PE) is a disease which presents with a wide spectrum of clinical manifestations, with varying prognoses and treatment.1 Prognostic stratification of patients with PE is essential for: (a) selecting the best treatment: patients with greater risk of secondary complications from the PE itself may benefit from specific treatments for recanalization of the obstructed arteries and (b) the treatment location (domiciliary care for very low risk patients and intensive care units for higher risk patients).
In recent years, various prognostic tools for patients with acute symptomatic PE have been validated, including clinical scores, imaging studies and biological markers.2 Among these, prognostic models have been shown to be especially useful for identifying low risk patients who may be managed with a shortened hospital stay or even outpatient care.
Uresandi et al.3 derived a clinical prognostic score (Spanish score) in 681 consecutive outpatients diagnosed with PE enrolled in a prospective multicenter study. The score includes the following variables: recent severe bleeding, metastatic cancer, non-metastatic cancer, serum creatinine values >2mg/dl, immobilization due to a recent medical condition, absence of surgery in the past 2 months and age >60 years. The score classified 47.8% of patients as low risk. The area under the curve for the prognostic efficacy of the score was 0.75 (95% confidence interval [CI], 0.67–0.83). This score was not validated in an independent patient cohort.
Aujesky et al.4 derived a clinical prognostic model, the Pulmonary Embolism Severity Index (PESI) in 10354 patients admitted with a diagnosis of PE in 186 hospitals in Pennsylvania (US). The model includes 11 clinical parameters evaluated at the time of presentation of symptoms: age, sex, cancer, heart failure, chronic lung disease, heart rate≥110min–1, systolic blood pressure <100mmHg, respiratory rate≥30min–1, temperature <36°C, altered mental state and oxygen saturation <90%. In the original series, 2% of patients in classes I and II (very low and low risk) died, compared to 14% of patients in classes III–V (intermediate to very high risk) within 30 days after the diagnosis of PE. Jiménez et al.5 derived and validated a simplified PESI score (sPESI). In a cohort of 995 patients, the authors found 6 variables independently associated with 30-day mortality: age, cancer, chronic cardiopulmonary disease, tachycardia (heart rate≥110min–1), hypoxemia (oxygen saturation <90%) and hypotension (systolic blood pressure <100mmHg). Patients with any of these variables were included in the high risk group. This score was validated by the same authors in a cohort of 7106 patients with PE from the RIETE registry. The score classified 36.1% of patients as low risk and 30-day mortality was 1.1% (95% CI, 0.7%–1.5%).
The aim of this study was to validate the Spanish score and compare it with the sPESI in an independent cohort of patients diagnosed with acute symptomatic PE.
MethodDesignThis was an observational study in which two clinical models were validated and their prognostic efficacy was compared in a cohort of stable and unstable patients with acute symptomatic PE.
Patients and Selection CriteriaAll patients consecutively diagnosed with acute symptomatic PE in the Emergency Room of Hospital Ramón y Cajal (Madrid, Spain) between January 2003 and December 2011 were included. A diagnosis of PE was confirmed by the finding on computed tomography (CT) angiogram of a partial intraluminal defect surrounded by contrast medium or complete occlusion of a pulmonary artery in two consecutive CT slices.6 Diagnosis of PE by ventilation/perfusion scan was carried out in cases of high probability defined according to PIOPED criteria7 (at least one segmentary perfusion defect or two subsegmentary defects with normal ventilation), or in cases of clinically suspected PE, a non-conclusive lung scan and lower extremity ultrasonography showing non-compressibility of the vein lumen as a sign of deep vein thrombosis (DVT).8
InterventionsPatients were treated with low molecular weight heparin (LMWH) at weight-adjusted doses, every 12h for a minimum of 5 days. The administration of vitamin K antagonists in combination with the LMWH was initiated between the first and third day of treatment and LMWH was suspended when the INR was stable and higher than 2.0. INR monitoring was carried out according to the local practice of the center.
Recanalization treatment (thrombolytics, fragmentation or embolectomy) was used in hemodynamically unstable patients, at the discretion of the treating physician. In general, mechanical fragmentation and embolectomy were reserved for unstable patients in whom thrombolysis was contraindicated. A vena cava filter was implanted in patients with contraindications for anticoagulation therapy (active bleeding or high risk of bleeding).
Prognostic ScoresThe Spanish risk score and the sPESI were calculated using the patient clinical characteristics collected at the time of diagnosis of PE in the emergency room. This calculation was retrospective for patients diagnosed before the publication of these scores, and prospective from then on. The score established in each of the models was assigned for each of the variables. The total score for each patient was calculated by adding the scores obtained for each of the prognostic variables included in the model (Table 1).
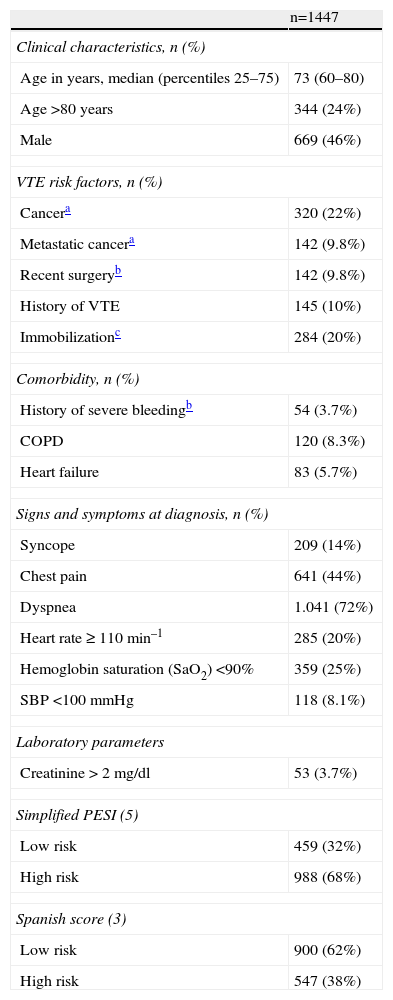
Baseline Characteristics of Study Patients.
| n=1447 | |
| Clinical characteristics, n (%) | |
| Age in years, median (percentiles 25–75) | 73 (60–80) |
| Age>80 years | 344 (24%) |
| Male | 669 (46%) |
| VTE risk factors, n (%) | |
| Cancera | 320 (22%) |
| Metastatic cancera | 142 (9.8%) |
| Recent surgeryb | 142 (9.8%) |
| History of VTE | 145 (10%) |
| Immobilizationc | 284 (20%) |
| Comorbidity, n (%) | |
| History of severe bleedingb | 54 (3.7%) |
| COPD | 120 (8.3%) |
| Heart failure | 83 (5.7%) |
| Signs and symptoms at diagnosis, n (%) | |
| Syncope | 209 (14%) |
| Chest pain | 641 (44%) |
| Dyspnea | 1.041 (72%) |
| Heart rate≥110min–1 | 285 (20%) |
| Hemoglobin saturation (SaO2) <90% | 359 (25%) |
| SBP <100mmHg | 118 (8.1%) |
| Laboratory parameters | |
| Creatinine>2mg/dl | 53 (3.7%) |
| Simplified PESI (5) | |
| Low risk | 459 (32%) |
| High risk | 988 (68%) |
| Spanish score (3) | |
| Low risk | 900 (62%) |
| High risk | 547 (38%) |
COPD, chronic obstructive pulmonary disease; VTE, venous thromboembolism; SBP, systolic blood pressure; PESI, Pulmonary Embolism Severity Index.
All-cause mortality in the month following diagnosis was defined as the primary endpoint. Secondary endpoints were objectively confirmed non-fatal recurrent venous thromboembolism and non-fatal major bleeding in the month following diagnosis.
The diagnostic criteria for non-fatal recurrent thromboembolism were the presence of a new intraluminal defect in the CT-angiogram6 or a new ventilation/perfusion defect in the lung scan, a new non-compressible venous segment or an increase in thrombus diameter of at least 4mm in lower limb ultrasonography.9
Non-fatal major bleeds were defined as those requiring transfusion of at least 2 units of packed red blood cells or surgery, or those involving cerebral, retroperitoneal and joint bleeding.10
Statistical AnalysisContinuous variables are expressed as mean±standard deviation and compared using Student's t-test for paired and unpaired data. Categorical variables are given in percentages and compared using the Chi-squared test or Fisher's exact test, if necessary.
The incidence of clinical episodes for each risk class was estimated using the cumulative incidence (defined as the ratio between the number of episodes and the total number of patients at risk) during the follow-up period. The exact limits of the 95% CI were estimated. The calibration of the risk models was evaluated using the Hosmer–Lemeshow goodness-of-fit test. This test determines how close the expected incidence of episodes comes to the observed incidence of episodes over a range of scores. A significant result in this test indicates lack of fit of the model.11
We evaluated the discriminatory capacity of the risk models for each of the clinical episodes using the C statistic. In general, a model with a C statistic>0.70 has an acceptable discriminatory capacity.12 For the calculation of the C statistic, we used log regression models, entering each of the clinical episodes as a dependent variable and each of the scores as a continuous quantitative independent variable,13 in order to estimate the expected probability of the episode in question. We then plotted this probability against the incidence of the episode on a receiver operating characteristic (ROC) curve, thus obtaining the area under the curve or C statistic with its corresponding 95% CI.14 The C statistics of both risk models were compared using a non-parametric test developed by DeLong et al.15 The sensitivity, specificity, predictive values and likelihood ratios were calculated for each score.
For the statistical analysis, we used the SPSS program (version 19.0, SPSS Inc., Chicago, Illinois, US). For comparison of the area under ROC curve of the clinical episode models, we used the MedCalc package (version 11.6.1, MedCalc Software, Mariakerke, Belgium). A two-tailed value of P<.05 was considered statistically significant.
ResultsDuring the study period, 7109 patients with suspected acute symptomatic PE were evaluated and the diagnosis was confirmed in 1564 (22%). Of these, 19 (1.2%) refused to sign the informed consent and 98 (6.3%) were lost to follow-up, so the final sample consisted of 1447 patients. Approximately 60% of the patients (856/1447) were diagnosed by chest CT-angiogram, 659 (45%) by high probability ventilation/perfusion scan and 73 (5%) had negative chest results and DVT confirmed by lower limb ultrasonography. Some patients had several positive diagnostic tests simultaneously.
The characteristics of the patients enrolled are shown in Table 1. The number of patients treated with inferior vena cava filters was small (1.8%; 28 of 1447 patients). Thrombolytics were administered to 4% of the patients (64 of 1447). Of the 1447 patients, 138 (9.5%; 95% CI, 8.0–11.1) died during the first 30 days of follow-up. Sixty-two patients (45%) died due to the PE itself, 7 (5.1%) due to bleeding and 69 (50%) due to other causes. A secondary episode occurred in 47 patients; 11 patients had an objectively confirmed recurrent thromboembolism, 38 patients had non-fatal major bleeding and 2 patients had both bleeding and recurrent thromboembolism.
The discrimination of the Spanish score and the sPESI for 30-day mortality was 0.74 (95% CI, 0.70–0.78) and 0.72 (95% CI, 0.68–0.76), respectively (Fig. 1). Fig. 1 shows the area under the curve obtained from the ROC curves for 30-day mortality with each of the risk models. In contrast, the discriminatory capacity of the two risk models for predicting the secondary episode was poorer, since the C statistics were lower than 0.60. Fig. 1 shows the results of the Hosmer–Lemeshow goodness-of-fit test, which evaluated the calibration of the Spanish score and the sPESI for predicting the risk of death.
 sPESI Model. Area Under the Curve (AUC) (C Statistic): 0.72; 95% CI, 0.68–0.76; P<.001; Hosmer–Lemeshow Test, 8.30; P=.09. (B) Spanish Score. AUC (C Statistic): 0.74; 95% CI, 0.70–0.78; P<.001; Hosmer–Lemeshow Test, 4.02; P=.40.")
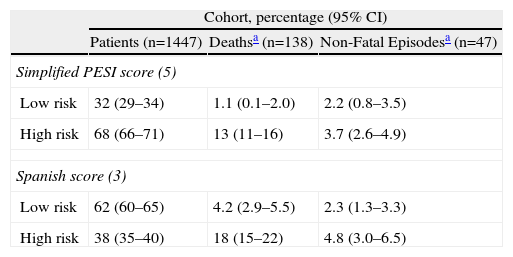
The sPESI classified a significantly lower proportion of patients as low risk (32% [459/1447], 95% CI, 29%–34%) compared to the Spanish score (62% [900/1.447], 95% CI, 60%–65%) (P<.001) (Table 2). Compared with the Spanish score low risk group, the mortality in the sPESI low risk group was lower (4.2% [38/900] vs 1.1% [5/459) (Table 2). The high risk group according to sPESI had a somewhat lower mortality than the Spanish score high risk group (13.5% [133/987] vs 18.3% [100/546]). The rate of non-fatal episodes was similar in the low risk group of both models (2.2% [10/459] vs 2.3% [21/900]).
Distribution of Mortality and Non-Fatal Adverse Episodes.
| Cohort, percentage (95% CI) | |||
| Patients (n=1447) | Deathsa (n=138) | Non-Fatal Episodesa (n=47) | |
| Simplified PESI score (5) | |||
| Low risk | 32 (29–34) | 1.1 (0.1–2.0) | 2.2 (0.8–3.5) |
| High risk | 68 (66–71) | 13 (11–16) | 3.7 (2.6–4.9) |
| Spanish score (3) | |||
| Low risk | 62 (60–65) | 4.2 (2.9–5.5) | 2.3 (1.3–3.3) |
| High risk | 38 (35–40) | 18 (15–22) | 4.8 (3.0–6.5) |
CI, confidence interval; PESI, Pulmonary Embolism Severity Index.
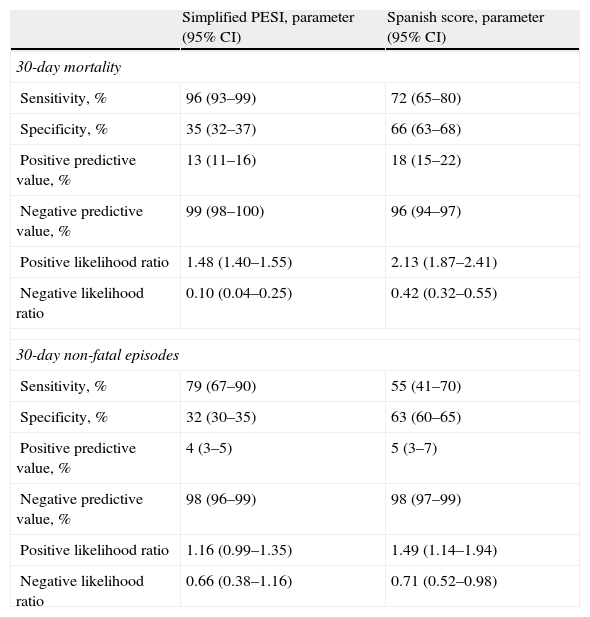
For the prediction of 30-day mortality, the sensitivity, negative predictive value and negative likelihood ratio were better for the sPESI model than for the Spanish score (Table 3). When the 30-day non-fatal episodes are considered, the negative predictive value for the sPESI was 97.8%, compared to 97.7% for the Spanish score (Table 3).
Quality Indices of the Simplified PESI Model and Spanish Score for the Prediction of 30-Day Mortality and Non-Fatal Episodes.
| Simplified PESI, parameter (95% CI) | Spanish score, parameter (95% CI) | |
| 30-day mortality | ||
| Sensitivity, % | 96 (93–99) | 72 (65–80) |
| Specificity, % | 35 (32–37) | 66 (63–68) |
| Positive predictive value, % | 13 (11–16) | 18 (15–22) |
| Negative predictive value, % | 99 (98–100) | 96 (94–97) |
| Positive likelihood ratio | 1.48 (1.40–1.55) | 2.13 (1.87–2.41) |
| Negative likelihood ratio | 0.10 (0.04–0.25) | 0.42 (0.32–0.55) |
| 30-day non-fatal episodes | ||
| Sensitivity, % | 79 (67–90) | 55 (41–70) |
| Specificity, % | 32 (30–35) | 63 (60–65) |
| Positive predictive value, % | 4 (3–5) | 5 (3–7) |
| Negative predictive value, % | 98 (96–99) | 98 (97–99) |
| Positive likelihood ratio | 1.16 (0.99–1.35) | 1.49 (1.14–1.94) |
| Negative likelihood ratio | 0.66 (0.38–1.16) | 0.71 (0.52–0.98) |
CI, confidence interval; PESI, Pulmonary Embolism Severity Index.
This study compares the ability of the Spanish score and the sPESI for predicting the risk of events after an episode of acute symptomatic PE. In our series, both scores showed a similar discriminatory capacity for predicting 30-day mortality. However the sPESI was more reliable in identifying PE patients with a low risk of early complications.
Risk stratification of clinical episodes is a fundamental aspect in the management of patients with acute symptomatic PE. Clinical prognostic models were developed to identify PE patients with a low risk of complications, who could benefit from shortened hospital stays or even outpatient treatment of their disease.16,17 Although the Spanish score was used in a clinical trial for the outpatient treatment of low-risk PE,16 it has never been validated or compared directly with the sPESI.
Our results indicate that, although the general functioning of the two models is similar, the sPESI is significantly better than the Spanish score in the high sensitivity area. Indeed, the negative predictive value and the negative likelihood ratio are significantly better for the sPESI. A sensitive model is of interest for predicting mortality, since a false negative has a very high cost; this gives the sPESI an advantage. This difference between the two risk models appears to be explained by the differences in the variables that compose them. Unlike the Spanish model, the sPESI includes blood pressure, O2-hemoglobin saturation and heart rate, variables which have always been associated with acute PE survival.18–20
In our series, the usefulness of both scores for predicting the risk of non-fatal adverse events was poorer. There may be various reasons for this low predictive power. The most important is that these predictive models were conceived for predicting mortality, so it is not surprising that their capacity for predicting other events is lower. In any case, the negative predictive value of both models for the prediction of non-fatal adverse events remains high, so they continue to be excellent tools for identifying patients suitable for early discharge or outpatient therapy.
When comparing predictive models, a balance must be established between their discriminatory capacity and their simplicity in terms of clinical applicability. The sPESI consists of 6 variables with a simple scoring system (the presence of any of the variables indicates a high risk patient). However, the Spanish score consists of 7 variables, one of which is a laboratory parameter (serum creatinine) and the system for allocating scores is more complex.
This study has some limitations. Firstly, it is an analysis of a historical cohort composed of patients from a single center and is susceptible to the type of bias inherent in this type of study. However, it represents a non-selected population of PE patients in our usual clinical practice setting, making it an ideal sample for testing the external validity of the risk models analyzed. Secondly, the main limitation of the risk models lies in the fact that they were designed for making group predictions, rather than individual predictions. Although their discriminatory capacity is high, it can never be perfect. For this reason, the use of these models in a specific patient can only be orientative, since they allow a certain risk to be estimated but cannot definitively predict the final clinical outcome.21
In conclusion, our results show that the sPESI is more reliable than the Spanish score for identifying PE patients with a low risk of early complications. Well-designed studies are needed for determining if clinical scores are useful tools for identifying low-risk patients with PE who may be treated in an outpatient setting.
Conflict of InterestsThe authors declare that they do not have any conflict of interests.
Please cite this article as: Ferrer M, et al. Validación de 2 escalas clínicas pronósticas en pacientes con tromboembolia pulmonar aguda sintomática. Arch Bronconeumol. 2013;49:427–31.


