The therapeutic approach for metastatic malignant pleural effusion depends on the patient's life expectancy. Can survival be accurately estimated in these patients using a risk-prediction model?
MethodsA prospective, single-center study was conducted to examine the prognostic value of pre-established variables (multivariate Cox model). Subsequently, a prognostic score was developed and validated. The inclusion period was 11 years long. Follow-up was conducted until death or for a minimum of 12 months.
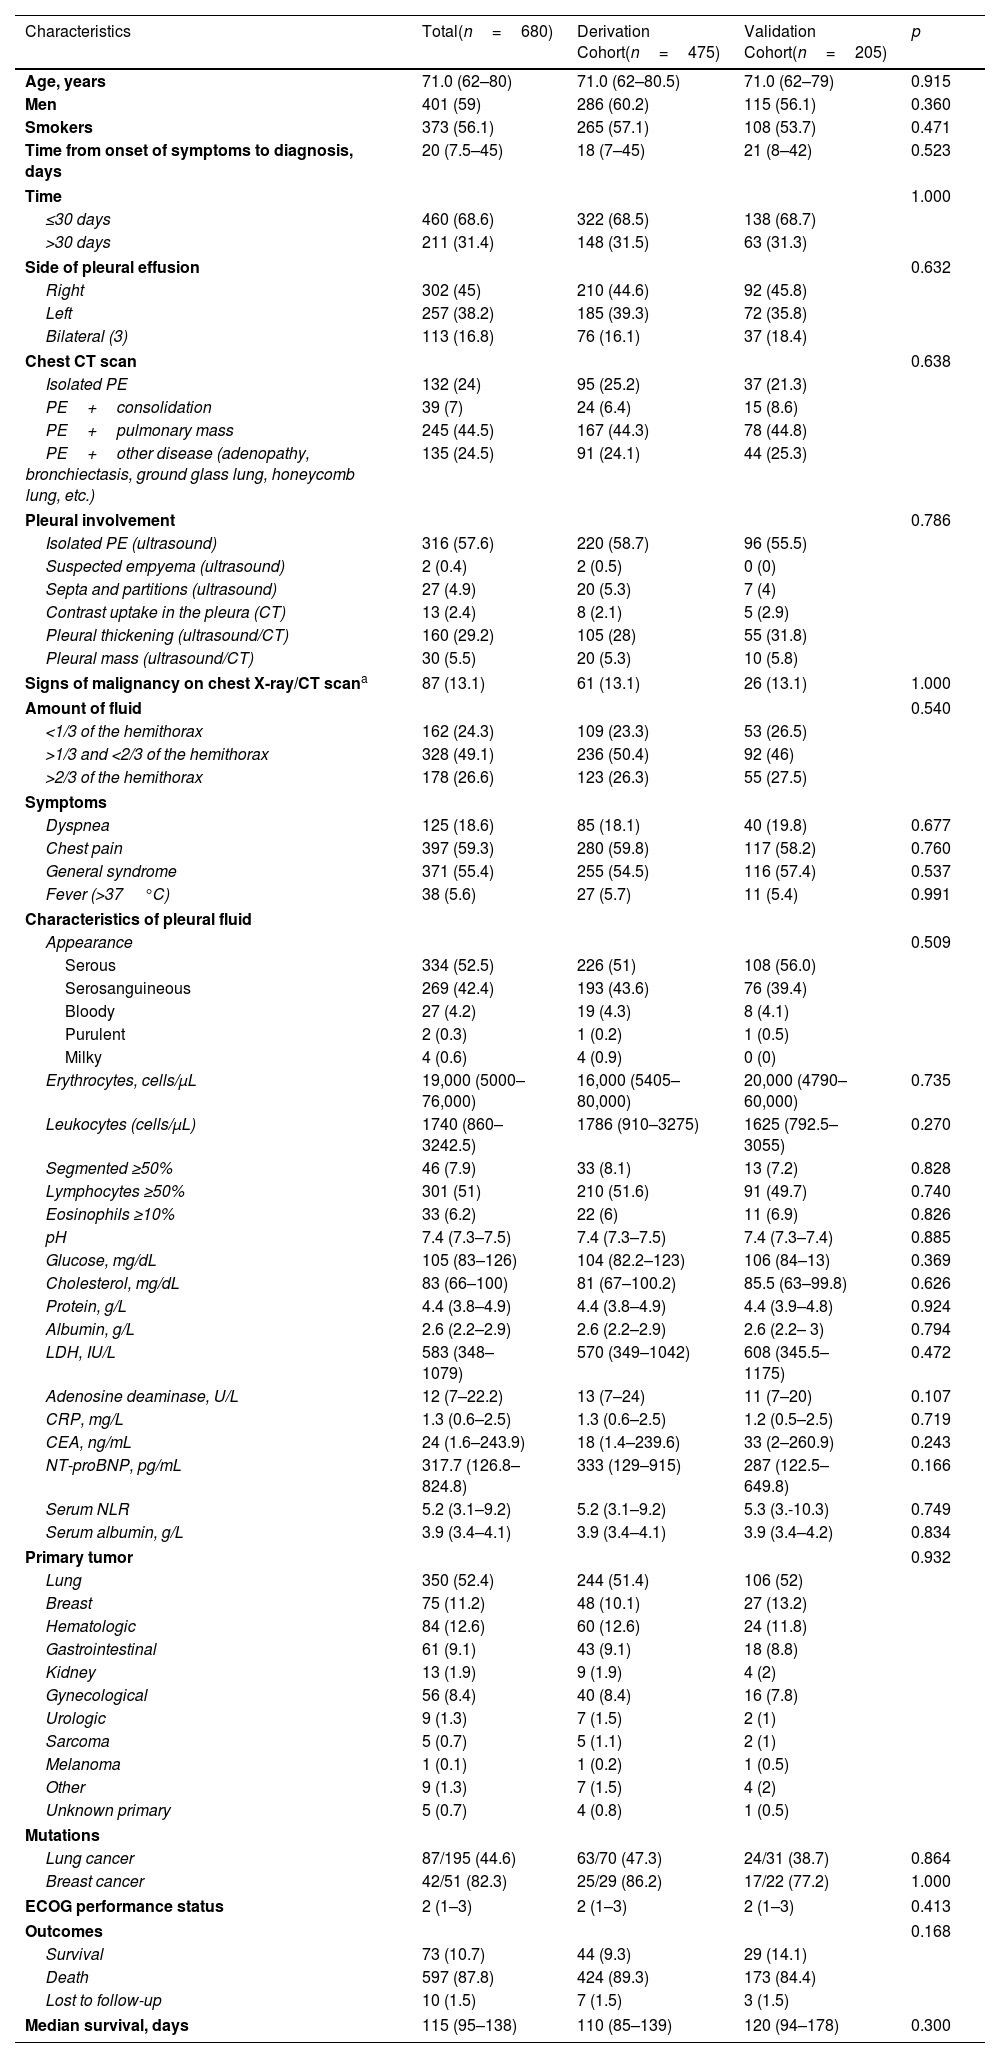
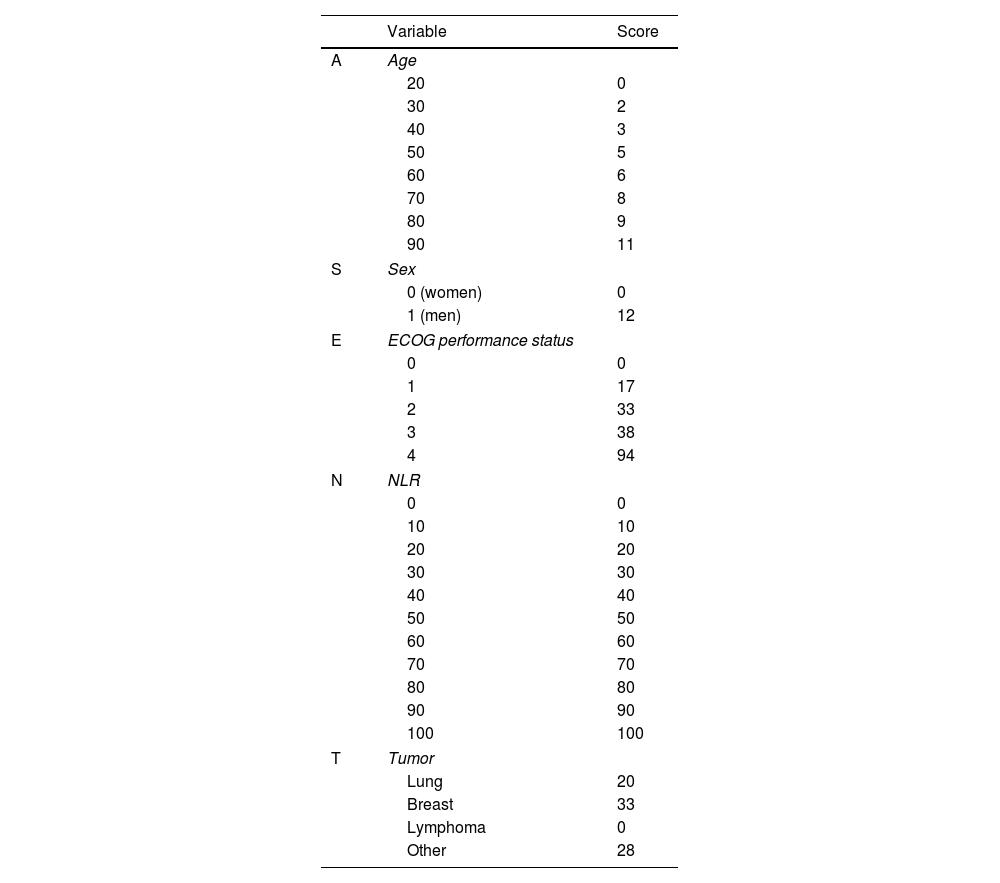
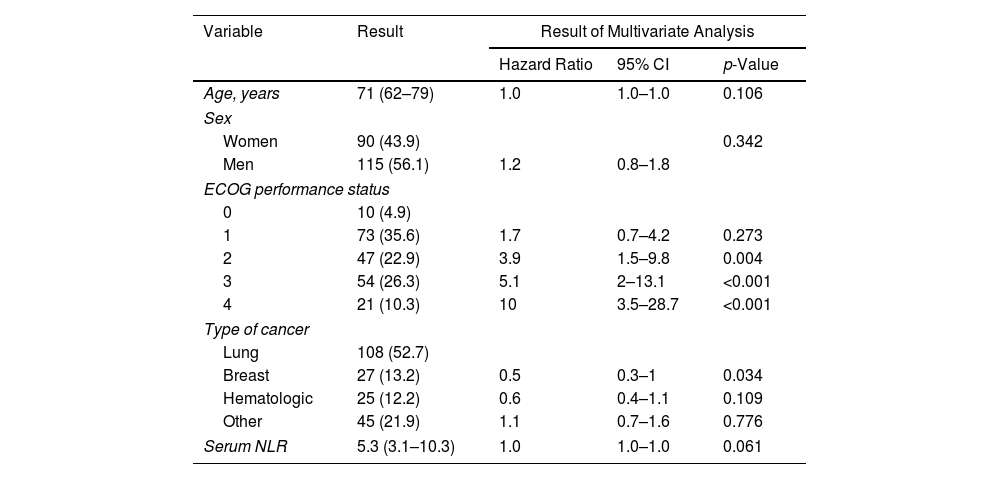
ResultsThe derivation and validation cohorts included 475 and 205 patients, respectively. The prognostic score GASENT (Galicia, Age, Sex, ECOG-PS, Neutrophil/lymphocyte ratio, and Tumor type) was derived from the multivariate analysis of survival.
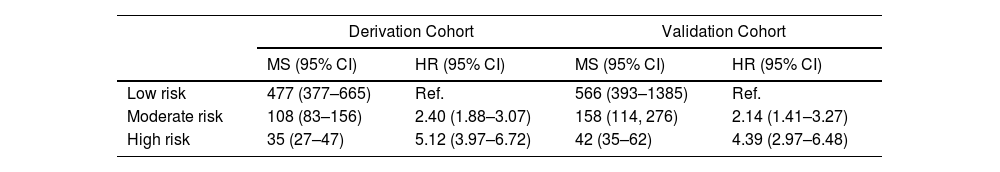
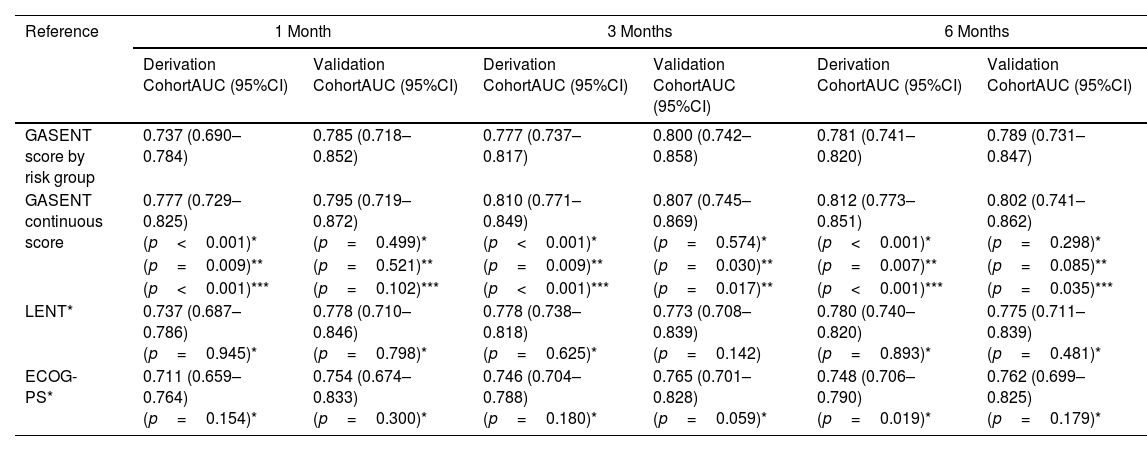
Categorization of patients in the derivation cohort into low-, moderate-, or high-risk yielded median survival times of 477 days (377–665; n=159), 108 days (83–156; n=158), and 35 days (27–47; n=158), respectively. Survival rates at 1, 3, and 6 months were 92%, 83%, and 72%, respectively, for the low-risk group; 80%, 55%, and 36%, respectively, for the moderate-risk group; and 55%, 23%, and 13%, respectively, for the high-risk group. The analysis of areas under the curve revealed that the GASENT model was superior to the LENT score as a survival predictive model at 1 (0.777 vs. 0.737; p=0.009), 3 (0.810 vs. 0.778; p=0.009), and 6 months (0.812 vs. 0.780; p=0.007).
ConclusionsThe GASENT predictive model estimates survival in patients with metastatic malignant effusions with significantly greater accuracy than the scores categorizing patients by risk groups.
Malignant pleural effusion (MPE) is the most common cause of unilateral pleural exudate.1 MPE accounts for over 150,000 admissions annually, representing a significant economic burden.2 The growing number of cancer cases expected in the coming years, in addition to the enhanced efficacy of systemic anti-cancer therapy, will lead to an increase in the prevalence of MPE.3 The presence of MPE suggests metastatic or advanced disease, with a mean survival ranging from 3 to 12 months.4
At the time of MPE diagnosis, an individual prognosis providing an accurate estimate of survival may help tailor the therapeutic approach. In cases of poor prognosis, patients should be spared unnecessary inconvenience at the end of their lives. In this context, palliative care emerges as the most appropriate approach. In patients with a better life expectancy, more aggressive strategies can be used. In recent years, new pleural procedures have become available for the management of MPE, leading to improved stratification of patients, progressive individualization of treatment, and diversification of outcomes.5
The MPE population is characterized by considerable heterogeneity, with substantial variations in life expectancy influenced by multiple factors. These factors include the type of underlying tumor, as malignant pleural mesothelioma generally presents a more favorable prognosis than metastatic MPE (MMPE), and the overall life expectancy in a specific cohort may be contingent upon the number of mesothelioma cases included.6 Additionally, the functional status of the patient, the prevalence of oncogenic mutations within a particular population or ethnicity, and the presence of various comorbidities also play significant roles.6,7
Currently, two prognostic scores for predicting survival in MPE have been validated (LENT and PROMISE).6,7 However, efforts are being made to develop more accurate predictive survival models that can overcome the limitations of existing scores and be tailored to the demographic characteristics of each region. This study aimed to develop a predictive model based on risk stratification or a continuous predictive scale that estimates life expectancy in unselected patients diagnosed with MMPE, with the potential to facilitate treatment personalization in the future.
Materials and MethodsStudy Population and Inclusion/Exclusion CriteriaA prospective study of patients with a confirmed diagnosis of MMPE (positive cytology or pleural biopsy for malignancy by any method) was performed in a third-level school hospital over a period of 11 years (from January 1, 2012, to December 31, 2022). Patients were followed-up for a minimum of 12 months or until death. The collected data included the first episode of MMPE secondary to a de novo diagnosis of cancer or relapse/progression of a known malignant neoplasm that had not previously caused pleural effusion. Survival (expressed in days) was defined as the period of time from MMPE diagnosis to death.
The inclusion criteria were a confirmed diagnosis of MMPE, age≥18 years, and agreement to participate in the study (by signing the informed consent form). The exclusion criteria were age<18 years and declination to participate in the study (declination to provide informed consent). This study was approved by the local Ethics Committee (code 2019/497).
VariablesPleural fluid (PF) was obtained via ultrasound-guided thoracentesis before treatment initiation. PF samples were centrifuged at 1500×g for 15min. The supernatant was processed within two hours of extraction and stored at −80°C. The variables analyzed are listed in eTable 1. PF and blood parameters included total and differential cell counts, pH (only in PF), C-reactive protein, interleukins 1β and 6, tumor necrosis factor alpha, total proteins, albumin, lactate dehydrogenase, glucose, cholesterol, triglycerides, adenosine deaminase, cytokeratin fragment 21-1, neuron-specific enolase and carcinoembryonic antigens, carbohydrate 15-3, 19-9 and cancer 125. The neutrophil-to-lymphocyte ratio (NLR) was estimated by dividing the neutrophil count by the lymphocyte count in the blood. Pleural biopsy was performed using either a percutaneous needle under ultrasound guidance, medical pleuroscopy, or VATS. The Eastern Cooperative Oncology Group performance status (ECOG-PS) was assessed at diagnosis in all patients.8 Mortality was assessed at 1, 3, and 6 months after the MMPE diagnosis.
Neoplasms were categorized into 11 types based on the LENT criteria5 (eTable 2). Each group was subdivided according to histological lineage (adenocarcinoma, epidermoid, etc.). Since 2016, screening for mutations in lung and breast tumors has been performed using pleural or primary tumor samples at our center.
Statistical AnalysisIn the descriptive analysis, continuous variables are presented as medians and interquartile ranges, and categorical variables are expressed as absolute and relative frequencies (percentages). Differences between patient groups (death vs. survival) were assessed using the Mann–Whitney U test for continuous variables and the Chi-squared test for categorical variables.
Missing data were imputed using multivariate normal imputation with chained equations, resulting in 1000 datasets. A Cox proportional hazards model was fitted to each dataset. Results were combined and expressed as Hazard Ratios (HR) with 95% confidence intervals (CIs). Statistical significance was determined using Rubin's rule.9 As a sensitivity analysis, we presented the results for the datasets with the best and worst mortality predictions.
Survival was calculated from diagnosis to death or the last follow-up date. The censored cases included those who survived or were lost to follow-up. Kaplan–Meier curves were used for survival analysis, and group differences were compared using the log-rank test. A multivariate Cox model was used to estimate survival and classify patients into prognostic groups based on clinical, radiological, and histological characteristics. Variable selection was performed using ridge regression (elastic net), excluding variables with p>0.05. Moreover, penalized splines were used to model the nonlinear effects. The results were expressed as HR with CIs.
A survival score was derived from 70% of the patients and validated in the remaining 30%. The fit of the score was measured using Harrell's concordance index, which ranges from 0.50 (non-informative) to 1 (perfect fit). We also assessed the discrimination capability of the model to obtain the area under the curve (AUC) at different time points. The score was presented as a nomogram to estimate the risk of death at different time points. To facilitate its use in the clinic, survival probability scores at 1, 3, and 6 months were derived from multivariate Cox regression, which was also implemented in an Excel spreadsheet. Thus, the probability of survival can be estimated on a continuous scale, obviating the need to categorize patients into discrete-risk groups. All analyses were conducted in R using the mice,10 survival,11 glmnet,12 rms,13 and pROC14 packages.
ResultsStudy Population and Analysis of SurvivalA total of 1015 MMPE cases were confirmed during the study period, of which 680 were included in the study. Of these, 475 were assigned to the derivation cohort (∼70% of the total sample) and 205 to the validation cohort (∼30% of the total sample) (Fig. 1). The median age was 71 years (62–80), 59% were male (401), 302 (45%) effusions occurred on the right side, and 113 (16.8%) were bilateral. No significant differences were observed between the two cohorts for any of the variables included (Table 1).
Baseline Characteristics of the Derivation and Validation Cohorts.
Characteristics | Total(n=680) | Derivation Cohort(n=475) | Validation Cohort(n=205) | p |
---|---|---|---|---|
Age, years | 71.0 (62–80) | 71.0 (62–80.5) | 71.0 (62–79) | 0.915 |
Men | 401 (59) | 286 (60.2) | 115 (56.1) | 0.360 |
Smokers | 373 (56.1) | 265 (57.1) | 108 (53.7) | 0.471 |
Time from onset of symptoms to diagnosis, days | 20 (7.5–45) | 18 (7–45) | 21 (8–42) | 0.523 |
Time | 1.000 | |||
≤30 days | 460 (68.6) | 322 (68.5) | 138 (68.7) | |
>30 days | 211 (31.4) | 148 (31.5) | 63 (31.3) | |
Side of pleural effusion | 0.632 | |||
Right | 302 (45) | 210 (44.6) | 92 (45.8) | |
Left | 257 (38.2) | 185 (39.3) | 72 (35.8) | |
Bilateral (3) | 113 (16.8) | 76 (16.1) | 37 (18.4) | |
Chest CT scan | 0.638 | |||
Isolated PE | 132 (24) | 95 (25.2) | 37 (21.3) | |
PE+consolidation | 39 (7) | 24 (6.4) | 15 (8.6) | |
PE+pulmonary mass | 245 (44.5) | 167 (44.3) | 78 (44.8) | |
PE+other disease (adenopathy, bronchiectasis, ground glass lung, honeycomb lung, etc.) | 135 (24.5) | 91 (24.1) | 44 (25.3) | |
Pleural involvement | 0.786 | |||
Isolated PE (ultrasound) | 316 (57.6) | 220 (58.7) | 96 (55.5) | |
Suspected empyema (ultrasound) | 2 (0.4) | 2 (0.5) | 0 (0) | |
Septa and partitions (ultrasound) | 27 (4.9) | 20 (5.3) | 7 (4) | |
Contrast uptake in the pleura (CT) | 13 (2.4) | 8 (2.1) | 5 (2.9) | |
Pleural thickening (ultrasound/CT) | 160 (29.2) | 105 (28) | 55 (31.8) | |
Pleural mass (ultrasound/CT) | 30 (5.5) | 20 (5.3) | 10 (5.8) | |
Signs of malignancy on chest X-ray/CT scana | 87 (13.1) | 61 (13.1) | 26 (13.1) | 1.000 |
Amount of fluid | 0.540 | |||
<1/3 of the hemithorax | 162 (24.3) | 109 (23.3) | 53 (26.5) | |
>1/3 and <2/3 of the hemithorax | 328 (49.1) | 236 (50.4) | 92 (46) | |
>2/3 of the hemithorax | 178 (26.6) | 123 (26.3) | 55 (27.5) | |
Symptoms | ||||
Dyspnea | 125 (18.6) | 85 (18.1) | 40 (19.8) | 0.677 |
Chest pain | 397 (59.3) | 280 (59.8) | 117 (58.2) | 0.760 |
General syndrome | 371 (55.4) | 255 (54.5) | 116 (57.4) | 0.537 |
Fever (>37°C) | 38 (5.6) | 27 (5.7) | 11 (5.4) | 0.991 |
Characteristics of pleural fluid | ||||
Appearance | 0.509 | |||
Serous | 334 (52.5) | 226 (51) | 108 (56.0) | |
Serosanguineous | 269 (42.4) | 193 (43.6) | 76 (39.4) | |
Bloody | 27 (4.2) | 19 (4.3) | 8 (4.1) | |
Purulent | 2 (0.3) | 1 (0.2) | 1 (0.5) | |
Milky | 4 (0.6) | 4 (0.9) | 0 (0) | |
Erythrocytes, cells/μL | 19,000 (5000–76,000) | 16,000 (5405–80,000) | 20,000 (4790–60,000) | 0.735 |
Leukocytes (cells/μL) | 1740 (860–3242.5) | 1786 (910–3275) | 1625 (792.5–3055) | 0.270 |
Segmented ≥50% | 46 (7.9) | 33 (8.1) | 13 (7.2) | 0.828 |
Lymphocytes ≥50% | 301 (51) | 210 (51.6) | 91 (49.7) | 0.740 |
Eosinophils ≥10% | 33 (6.2) | 22 (6) | 11 (6.9) | 0.826 |
pH | 7.4 (7.3–7.5) | 7.4 (7.3–7.5) | 7.4 (7.3–7.4) | 0.885 |
Glucose, mg/dL | 105 (83–126) | 104 (82.2–123) | 106 (84–13) | 0.369 |
Cholesterol, mg/dL | 83 (66–100) | 81 (67–100.2) | 85.5 (63–99.8) | 0.626 |
Protein, g/L | 4.4 (3.8–4.9) | 4.4 (3.8–4.9) | 4.4 (3.9–4.8) | 0.924 |
Albumin, g/L | 2.6 (2.2–2.9) | 2.6 (2.2–2.9) | 2.6 (2.2– 3) | 0.794 |
LDH, IU/L | 583 (348–1079) | 570 (349–1042) | 608 (345.5–1175) | 0.472 |
Adenosine deaminase, U/L | 12 (7–22.2) | 13 (7–24) | 11 (7–20) | 0.107 |
CRP, mg/L | 1.3 (0.6–2.5) | 1.3 (0.6–2.5) | 1.2 (0.5–2.5) | 0.719 |
CEA, ng/mL | 24 (1.6–243.9) | 18 (1.4–239.6) | 33 (2–260.9) | 0.243 |
NT-proBNP, pg/mL | 317.7 (126.8–824.8) | 333 (129–915) | 287 (122.5–649.8) | 0.166 |
Serum NLR | 5.2 (3.1–9.2) | 5.2 (3.1–9.2) | 5.3 (3.-10.3) | 0.749 |
Serum albumin, g/L | 3.9 (3.4–4.1) | 3.9 (3.4–4.1) | 3.9 (3.4–4.2) | 0.834 |
Primary tumor | 0.932 | |||
Lung | 350 (52.4) | 244 (51.4) | 106 (52) | |
Breast | 75 (11.2) | 48 (10.1) | 27 (13.2) | |
Hematologic | 84 (12.6) | 60 (12.6) | 24 (11.8) | |
Gastrointestinal | 61 (9.1) | 43 (9.1) | 18 (8.8) | |
Kidney | 13 (1.9) | 9 (1.9) | 4 (2) | |
Gynecological | 56 (8.4) | 40 (8.4) | 16 (7.8) | |
Urologic | 9 (1.3) | 7 (1.5) | 2 (1) | |
Sarcoma | 5 (0.7) | 5 (1.1) | 2 (1) | |
Melanoma | 1 (0.1) | 1 (0.2) | 1 (0.5) | |
Other | 9 (1.3) | 7 (1.5) | 4 (2) | |
Unknown primary | 5 (0.7) | 4 (0.8) | 1 (0.5) | |
Mutations | ||||
Lung cancer | 87/195 (44.6) | 63/70 (47.3) | 24/31 (38.7) | 0.864 |
Breast cancer | 42/51 (82.3) | 25/29 (86.2) | 17/22 (77.2) | 1.000 |
ECOG performance status | 2 (1–3) | 2 (1–3) | 2 (1–3) | 0.413 |
Outcomes | 0.168 | |||
Survival | 73 (10.7) | 44 (9.3) | 29 (14.1) | |
Death | 597 (87.8) | 424 (89.3) | 173 (84.4) | |
Lost to follow-up | 10 (1.5) | 7 (1.5) | 3 (1.5) | |
Median survival, days | 115 (95–138) | 110 (85–139) | 120 (94–178) | 0.300 |
Data are presented as n (%) or median (percentiles), unless otherwise specified.
95%CI, 95% confidence interval; CEA, carcinoembryonic antigen; CRP, C-reactive protein; CT, computed tomography; ECOG, Eastern Cooperative Oncology Group; LDH, lactate dehydrogenase; NLR, ratio of absolute number of neutrophils to absolute number of lymphocytes; NT-proBNP, N-terminal pro-B-type natriuretic peptide; PE, pleural effusion; PF, pleural fluid; VATS, video-assisted thoracoscopic surgery.
Survival analysis in the two cohorts revealed significant disparities across tumors, with median values ranging from 50 (gastrointestinal tumors and melanoma) to 330 days (gynecological and hematologic tumors) (Fig. 2 and Table 2). The median survival time in the lung cancer group was 97 days, with large variations depending on the presence (211 days [95%CI:115–423]) or absence (112 days [95%CI:73–176]) of mutations. The same pattern was observed for breast cancer. Table 2 also shows the mutations detected in patients with lung and breast cancers since 2016.
Median Survival by Neoplasm Type in the Two Cohorts (Combined).
Type of Neoplasm | n | Median Survival in Days (95%CI) |
---|---|---|
Lung (total) | 350 | 97 (73–126) |
With mutations | 87b | 211 (115–423) |
BRAF | 8 | 302 (65–445) |
EGFR | 30 | 324 (192–637) |
PDL-1 | 51 | 69 (37–423) |
ALK | 10 | NAa (NA–NA) |
ROS1 | 1 | NAa (NA–NA) |
Without mutations | 108 | 112 (73–176) |
Mutations not tested | 155 | 72 (56–97) |
Breast | 75 | 151 (90–394) |
With mutations | 42c | 253 (115–1075) |
Estrogen receptors | 42 | 253 (115–1075) |
Progesterone receptors | 17 | 501 (28–NA) |
HercepTest | 4 | 115 (27–NA) |
HER2 | 2 | 557 (27–NA) |
Without mutations | 9 | 62 (37–NA) |
Mutations not tested | 24 | 219 (45–660) |
Hematologic | 84 | 408 (194–1149) |
Gastrointestinal | 61 | 50 (35–77) |
Kidney | 13 | 70 (23–NA) |
Gynecologic | 56 | 318 (196–559) |
Urologic | 9 | 79 (49–NA) |
Sarcoma | 5 | 103 (54–NA) |
Melanoma | 1 | 33 (NA) |
Other | 9 | 179 (92–NA) |
Unknown primary | 5 | 70 (48-NA) |
NA, not applicable.
In 4 patients, mutations were positive for BRAF+PDL-1; in 6, for EGFR+PDL-1 and in 3, for PDL-1+ALK.
In 14 patients, mutations were positive for estrogen receptors+progesterone receptors; in 2, for estrogen receptors+HercepTest; in 1, for estrogen receptors, progesterone receptors and HerceptTest; in 1, for estrogen receptors, progesterone receptors and HER2; in 1, for estrogen receptors, progesterone receptors, HercepTest and HER2.
ALK, anaplastic lymphoma kinase; BRAF, v-RAF murine sarcoma viral oncogene B; EGFR, epidermal growth factor receptor; HER2, human epidermal growth factor receptor 2er 2; PDL-1, programmed death-ligand 1; ROS1, ROS proto-oncogene 1.
Of the 680 patients with MMPE, 262 (38.5%) had a previous diagnosis of cancer before the occurrence of MPE, whereas 418 (61.5%) were diagnosed with malignancy when the etiology of the pleural effusion was identified. Univariate analysis of the derivation cohort revealed that eight variables had a statistically significant effect on survival (age, effusion size, ECOG-PS, cancer type, serum albumin, NLR, and C-reactive protein in PF) (eTable 3). However, in the multivariate analysis, sex, ECOG-PS, serum albumin, and serum NLR were the only variables with an independent impact on survival (eTable 4).
Development of the GASENT ScoreBased on the clinical applicability of the variables, in conjunction with the results of the multivariate analysis, five variables were selected (Age, Sex, ECOG-PS, NLR, and Tumor type) for inclusion in the predictive model. The model was designated as “the GASENT score,” with the initial component of the acronym derived from Galicia, the Spanish region where the study was conducted. The scoring system obtained at the time of MMPE diagnosis (range: 10–150) is presented in Table 3. Patients were classified into three risk categories: low (score 10–55, median survival 477 days), moderate (score 56–75, median survival 108 days), and high (score: 76–150, median survival 35 days) (Table 3). The Kaplan–Meier survival curves for each group are shown in Fig. 3.
Estimation of the GASENT Score.
Variable | Score | |
---|---|---|
A | Age | |
20 | 0 | |
30 | 2 | |
40 | 3 | |
50 | 5 | |
60 | 6 | |
70 | 8 | |
80 | 9 | |
90 | 11 | |
S | Sex | |
0 (women) | 0 | |
1 (men) | 12 | |
E | ECOG performance status | |
0 | 0 | |
1 | 17 | |
2 | 33 | |
3 | 38 | |
4 | 94 | |
N | NLR | |
0 | 0 | |
10 | 10 | |
20 | 20 | |
30 | 30 | |
40 | 40 | |
50 | 50 | |
60 | 60 | |
70 | 70 | |
80 | 80 | |
90 | 90 | |
100 | 100 | |
T | Tumor | |
Lung | 20 | |
Breast | 33 | |
Lymphoma | 0 | |
Other | 28 |
Risk by Category | Total Score |
---|---|
Low risk | 10–55; 413 patients (60.7%) |
Moderate risk | 56–75; 154 patients (22.7%) |
High risk | 76–150; 113 patients (16.6%) |
ECOG, Eastern Cooperative Oncology Group; NLR, absolute neutrophil-to-lymphocyte count ratio.
Data from 475 patients were used for the statistical analysis of the GASENT score. The Harrell's C-index for the LENT and GASENT models was 0.70 (LENT), 0.681 (risk group-based GASENT score), and 0.712 (continuous-scale predictive GASENT score). Table 4 shows the median survival and HR (95%CI) for the derivation and validation cohorts for each risk group in the GASENT model. Fig. 4A shows the probability of survival for the derivation cohort and the different risk groups of the GASENT model at three time points (1, 3, and 6 months).
Median Survival (Days) and Hazard Ratios for the Derivation and Validation Cohorts by Risk Group Assigned to Each Patient.
Derivation Cohort | Validation Cohort | |||
---|---|---|---|---|
MS (95% CI) | HR (95% CI) | MS (95% CI) | HR (95% CI) | |
Low risk | 477 (377–665) | Ref. | 566 (393–1385) | Ref. |
Moderate risk | 108 (83–156) | 2.40 (1.88–3.07) | 158 (114, 276) | 2.14 (1.41–3.27) |
High risk | 35 (27–47) | 5.12 (3.97–6.72) | 42 (35–62) | 4.39 (2.97–6.48) |
95%CI, 95% confidence interval; HR: hazard ratio; IQR, interquartile range; MS, median survival.
The analysis of areas under the ROC curves (AUC) for the prediction of survival at 1, 3, and 6 months according to the GASENT model based on risk groups yielded higher values than the ECOG-PS and LENT models, although the differences were not statistically significant in either the derivation or validation cohort (Fig. 5 and Table 5). When the GASENT predictive model was applied on a continuous scale, the AUCs improved to reach statistically significant differences from the risk group-based GASENT model in the derivation cohort (1 month, p<0.001; 3 months, p<0.001; 6 months, p<0.001).
Analysis of ROC curves for GASENT and Eastern Cooperative Oncology Group performance status (ECOG-PS) scores for mortality outcomes. (A) Derivation cohort at 1 month. (B) Derivation cohort at 3 months. (C) Derivation cohort at 6 months. (D) Validation cohort at 1 month. (E) Validation cohort at 3 months. (F) Validation cohort at 6 months.
Performance (Area Under the Curve) of the Models Developed to Estimate Survival in Patients With Malignant Pleural Effusion.
Reference | 1 Month | 3 Months | 6 Months | |||
---|---|---|---|---|---|---|
Derivation CohortAUC (95%CI) | Validation CohortAUC (95%CI) | Derivation CohortAUC (95%CI) | Validation CohortAUC (95%CI) | Derivation CohortAUC (95%CI) | Validation CohortAUC (95%CI) | |
GASENT score by risk group | 0.737 (0.690–0.784) | 0.785 (0.718–0.852) | 0.777 (0.737–0.817) | 0.800 (0.742–0.858) | 0.781 (0.741–0.820) | 0.789 (0.731–0.847) |
GASENT continuous score | 0.777 (0.729–0.825) (p<0.001)* | 0.795 (0.719–0.872) (p=0.499)* | 0.810 (0.771–0.849) (p<0.001)* | 0.807 (0.745–0.869) (p=0.574)* | 0.812 (0.773–0.851) (p<0.001)* | 0.802 (0.741–0.862) (p=0.298)* |
(p=0.009)** | (p=0.521)** | (p=0.009)** | (p=0.030)** | (p=0.007)** | (p=0.085)** | |
(p<0.001)*** | (p=0.102)*** | (p<0.001)*** | (p=0.017)** | (p<0.001)*** | (p=0.035)*** | |
LENT* | 0.737 (0.687–0.786) (p=0.945)* | 0.778 (0.710–0.846) (p=0.798)* | 0.778 (0.738–0.818) (p=0.625)* | 0.773 (0.708–0.839) (p=0.142) | 0.780 (0.740–0.820) (p=0.893)* | 0.775 (0.711–0.839) (p=0.481)* |
ECOG-PS* | 0.711 (0.659–0.764) (p=0.154)* | 0.754 (0.674–0.833) (p=0.300)* | 0.746 (0.704–0.788) (p=0.180)* | 0.765 (0.701–0.828) (p=0.059)* | 0.748 (0.706–0.790) (p=0.019)* | 0.762 (0.699–0.825) (p=0.179)* |
ECOG-PS, Eastern Cooperative Oncology Group performance status.
A total of 205 patients were included in the validation cohort. Multivariate analysis of the components of the GASENT model in this cohort revealed that ECOG-PS and cancer type were independent predictors of mortality at a predefined cutoff of p<0.05 (Table 6).
Characteristics of 205 Patients in the Validation Cohort and Multivariate Analysis Results.
Variable | Result | Result of Multivariate Analysis | ||
---|---|---|---|---|
Hazard Ratio | 95% CI | p-Value | ||
Age, years | 71 (62–79) | 1.0 | 1.0–1.0 | 0.106 |
Sex | ||||
Women | 90 (43.9) | 0.342 | ||
Men | 115 (56.1) | 1.2 | 0.8–1.8 | |
ECOG performance status | ||||
0 | 10 (4.9) | |||
1 | 73 (35.6) | 1.7 | 0.7–4.2 | 0.273 |
2 | 47 (22.9) | 3.9 | 1.5–9.8 | 0.004 |
3 | 54 (26.3) | 5.1 | 2–13.1 | <0.001 |
4 | 21 (10.3) | 10 | 3.5–28.7 | <0.001 |
Type of cancer | ||||
Lung | 108 (52.7) | |||
Breast | 27 (13.2) | 0.5 | 0.3–1 | 0.034 |
Hematologic | 25 (12.2) | 0.6 | 0.4–1.1 | 0.109 |
Other | 45 (21.9) | 1.1 | 0.7–1.6 | 0.776 |
Serum NLR | 5.3 (3.1–10.3) | 1.0 | 1.0–1.0 | 0.061 |
Data are presented as n (%) or median (percentiles), unless otherwise indicated.
ECOG, Eastern Cooperative Oncology Group.
Survival analysis (Fig. 4B) demonstrated that the GASENT risk groups in the validation cohort had a median survival and HR of mortality similar to those of the derivation cohort (Fig. 4A and Table 4). The validation cohort had a higher Harrell's C-index than the derivation cohort (0.691 vs. 0.681). The proportion of patients in the validation cohort who survived for 1, 3, and 6 months was comparable to that in the derivation cohort (Fig. 4). The analysis of ROC curves for the validation cohort yielded higher AUC values for the continuous-scale GASENT score than for the GASENT model based on risk groups, ECOG-PS, and LENT; however, the differences were not always statistically significant (Table 5). The sensitivity analyses performed in the two cohorts (derivation and validation) after imputation of missing data showed results similar to those obtained using the original data in terms of survival, associated risks, and power of discrimination of the models (eTables 5 and 6, respectively).
Applicability of the GASENT ScoreThe individual risk of survival (continuous-scale predictive GASENT model) is obtained by adding the scores of all variables included in the model. Thus, a male patient (12 points) who is 50 years old (5 points) with an ECOG-PS of 1 (17 points), NLR of 10 (10 points), and lung cancer (20 points) will have a total score of 64, which indicates a moderate risk of mortality (56–75 points) with a probability of survival of 87% at 1 month, 74.7% at 3 months, and 53.3% at 6 months. eFig. 1 contains a spreadsheet for estimating the probability of surviving MMPE according to the GASENT model.
DiscussionIn most settings, the GASENT survival predictive model based on a continuous scale yielded significantly higher AUC values than the GASENT scores for risk groups, LENT, and ECOG-PS at different time points (1, 3, and 6 months), and a higher Harrell's C index. Using this model, the probability of survival for a particular patient can be estimated without assigning the patient to a specific risk group. Therefore, this model will help tailor therapeutic approaches based on the prognosis of individual cases.
Consistent with previous studies, the survival range of MMPE patients was very broad, suggesting the influence of different variables on patient survival.6 Hence, because survival depends on multiple factors, the same treatment should not be administered to all the patients. In addition, the use of reliable survival prediction scores is crucial, as the clinical judgment of clinicians may fail to establish an accurate prognosis.15,16
On multivariate analysis, sex, serum NLR, ECOG-PS, cancer type, and albumin level were the only variables independently associated with survival (Table 6). The first four variables were included in the GASENT score because of robust evidence of their association with survival in neoplastic diseases.17–28,8,29–31 Serum albumin was found to be a relevant prognostic factor in the multivariate Cox model; however, the influence of this variable did not translate into a statistically significant effect in the predictive models (logistic regression) used to calculate the score. Consequently, the albumin level was excluded from the model. This inconsistency in the results is due to the methodological differences between the models. Whereas the Cox model includes both time-to-event and censoring, the binary analysis only considers the occurrence or absence of mortality, regardless of the time. Finally, although age did not maintain an independent prognostic impact on survival in the multivariate analysis (p=0.329), it was included in the model, as age is known to contribute to mortality in neoplastic diseases. Moreover, age is the most relevant risk factor for cancer in general and for many types of tumors.32
LENT and PROMISE scores have been validated for predicting survival in MPE.6,7 Several predictive models have been developed for specific tumor types (lung and breast).33,34 In light of the limitations of LENT and PROMISE (the former potentially lacks accuracy owing to its sole reliance on risk group classification, whereas the latter involves building a model for each tumor that needs to be updated as new mutations appear or new treatments become available), the GASENT model represents an alternative approach that provides enhanced results, overcomes the limitations of the two existing models, and adapts to the demographic characteristics of each region.
In recent years, several alternative prognostic scores applicable to all tumor types have been developed to estimate the survival of patients with MPE, and their results have been compared with those of the LENT score. Notably, the SELECT score, which considers factors such as Sex, Eastern Cooperative Oncology Group performance status, Leukocyte count, EGFR mutation status, Chemotherapy, and Type of primary tumor, has been utilized to identify patients with a high likelihood of 90-day survival.35 Additionally, the CONCH prognostic score, which includes CEA, monocyte count, NT-pro-BNP, and chloride values (the latter in PF), is recommended for guiding intervention selection and management of MPE.33 Furthermore, a meta-analysis of five randomized controlled trials involving 553 patients with MPE concluded that dyspnea, assessed using a visual analog scale before and after MPE treatment procedures, serves as a reliable predictor of survival in these patients.29 In summary, despite the advancements achieved with existing predictive models for MPE survival, there remains a continuous pursuit of alternative models to enhance their accuracy, address their limitations, and tailor them to the demographic characteristics of specific regions.
Our study differs notably from the LENT study in several aspects. First, cases of malignant pleural mesothelioma (accounting for over 20% of cases in the LENT study) were excluded, as the incidence of this disease varies across different regions of the world.36 Additionally, survival is higher in mesothelioma than in MMPE, which may result in an increased median survival in each risk group. Second, in the GASENT study, pleural cytology or biopsy results were positive for malignancy in all patients. In contrast, in the LENT study, 28% of cases in the derivation cohort (221 patients) had a negative test result (204 had an effusion of unknown etiology with confirmed malignancy in an organ other than the pleura, and 17 had radiological evidence of malignancy that was not confirmed histologically). This is relevant because the differences in median survival would result from including patients with non-neoplastic PE in the LENT study. Finally, the LENT and PROMISE models only consider three or four mean survival times, which is a limitation for individualized predictions and clinical decision-making.
In our study, the probability of survival at one month in high-risk patients was 55% (Fig. 4A). Does this mean that all patients in this group have the same probability of survival at that time point? The answer is no, as these prognostic scores provide the median probability of survival for the group, but not for each case in that group. The Excel spreadsheet (eFig. 1) details the probability of survival at 1 month for three patients with high-risk MMPE with GASENT scores of 77, 118, and 147 points. This continuous-scale prediction model provides an enhanced prediction of survival in future cases. Higher AUCs were derived from the GASENT model than from the LENT model in the derivation cohort. In the validation cohort, the differences were significant only at 3 months. This was probably due to the high AUC of the LENT model for the validation cohort at one month (0.795 vs. 0.777 for the derivation cohort). Nevertheless, the two scoring systems are solid and consistent with their purpose.37
The GASENT model was solely compared with the LENT model. A comparison with the PROMISE model was not performed because it is more complex, and one of the variables, tissue inhibitor of metalloproteinase 1 (TIMP1), is not available in all hospitals, which prevents its widespread use. The GASENT model is a continuous-scale prediction score. However, the variable “tumor type” was also categorized into groups; otherwise, the prediction model would have severe limitations in low-incidence tumors owing to the broad variability in predictive estimations. The variable “oncogenic mutation” was not included in the score because we aimed to develop a model that was valid for all tumor types. Oncogenic mutations were only available for some cases of lung cancer and breast cancer. If the missing cases had been excluded, the model would have provided less-precise predictions. Finally, biological variability in each neoplasm was not considered in any of the studies (GASENT and LENT), which may have reduced the accuracy of the model.38
A similar study was recently conducted to externally validate the ability of the LENT and PROMISE scores to provide a prognosis for MPE. The study suggests using statistical techniques that identify non-linear relationships between potential biomarkers and disease prognosis, which spares the need for risk categorization and the resulting loss of information.39 Thus, the performance of future predictive models can be improved.
This study had some limitations. The GASENT score was not designed for suspected MPE or paramalignant effusions. In addition, as this was a single-center study, 100% of the study population was Caucasian. This limits the generalizability of the results to populations of other geographic regions or ethnicities. Mutations in lung and breast cancers were only tested from 2016. Although a significant difference was observed in survival, it was not considered for the reasons mentioned above, which probably overestimates the risk of death, since receiving targeted treatment is an independent protective factor against recurrence of MPE.40 As tumor staging was challenging, disease spread was excluded from the analysis. Finally, the model requires external validation.
In conclusion, in patients with MMPE, the GASENT model, a validated continuous-scale predictive score, predicts survival at 1, 3, and 6 months more accurately than currently available models. The use of these models is not widespread in clinical practice, as therapeutic decisions are made based on patient preferences, clinician experience and skills, and equipment available in the hospital. A predictive model that provides perfectly measurable results is necessary to improve clinical practice. However, such a model has not yet been developed. Predictive survival models are expected to be used more frequently in the future, as patients increasingly request accurate estimates of their life expectancy, which clinicians should be able to provide.41 The continuous-scale predictive model developed in our study offers individualized survival predictions that are sufficiently accurate to provide individual information that allows for effective therapeutic decision-making.
A continuous-scale predictive model, such as the GASENT model, may provide sufficiently accurate individual predictions that allow for effective therapeutic decision-making based on individual information.
Author ContributionsJuan Súarez-Antelo. Author and drafting. Conception and design. Reviewed intellectual content. Approval of the final manuscript.
Lucía Ferreiro. Co-author and drafting. Reviewed intellectual content. Approval of the final manuscript.
José M. Porcel. Co-author and drafting. Reviewed intellectual content. Approval of the final manuscript.
María E. Toubes. Co-author. Reviewed intellectual content. Approval of the final manuscript.
Óscar Lado Baleato. Co-author. Statistical analysis. Reviewed intellectual content. Approval of the final manuscript.
Nuria Rodríguez-Núñez. Co-author. Reviewed intellectual content. Approved final manuscript.
Jorge Ricoy. Co-author. Data Collect. Reviewed intellectual content. Approval of the final manuscript.
Adriana Lama. Co-author. Reviewed intellectual content. Approved final manuscript.
Antonio Golpe. Co-author. Reviewed intellectual content. Approved final manuscript.
José Manuel Álvarez-Dobaño. Co-author. Reviewed intellectual content. Approved final manuscript.
Francisco Gude. Co-author. Conception and design. Statistical analysis. Reviewed intellectual content. Approval of the final manuscript.
Luis Valdés. Author and drafting. Conception and design. Reviewed intellectual content. Approval of the final manuscript.
Artificial Intelligence InvolvementThe manuscript has not been produced partially or totally with the help of any artificial intelligence software or tool.
FundingThis research did not receive any specific grant from funding agencies in the public, commercial, or not-for-profit sectors.
Conflict of InterestThe authors declare no conflicts of interest.
We wish to confirm that there are no known conflicts of interest associated with this publication and that there has been no significant financial support for this work that could have influenced its outcome. We confirm that the manuscript has been read and approved by all the authors. We further confirm that the order of the authors listed in the manuscript has been approved by all the authors. We confirm that we have given due consideration to the protection of intellectual property associated with this work, and that there are no impediments to its publication.
The Corresponding Author is the sole contact for the editorial process (including the Editorial Manager and direct communication with the office). She is responsible for communicating with the other authors about the progress, submission of revisions, and final approval of proofs. We confirm that we have provided a current and correct email address that is accessible to the Corresponding Author (lferfer7@gmail.com).
We confirm that this manuscript has not been published elsewhere in any other language and is not currently being considered for publication in any other journal.
Lucía Ferreiro on behalf of all the co-authors.