


Blood eosinophil count (BEC) is currently used as a surrogate marker of T2 inflammation in severe asthma but its relationship with tissue T2-related changes is elusive. Bronchial biopsy could add reliable information but lacks standardization.
ObjectivesTo validate a systematic assessment of the bronchial biopsy for the evaluation of severe uncontrolled asthma (SUA) by standardizing a pathological score.
MethodsA systematic assessment of submucosal inflammation, tissue eosinophilic count/field (TEC), goblet cells hyperplasia, epithelial changes, basement membrane thickening, prominent airway smooth muscle and submucosal mucous glands was initially agreed and validated in representative bronchial biopsies of 12 patients with SUA by 8 independent pathologists. In a second phase, 62 patients with SUA who were divided according to BEC≥300cells/mm3 or less underwent bronchoscopy with bronchial biopsies and the correlations between the pathological findings and the clinical characteristics were investigated.
ResultsThe score yielded good agreement among pathologists regarding submucosal eosinophilia, TEC, goblet cells hyperplasia and mucosal glands (ICC=0.85, 0.81, 0.85 and 0.87 respectively). There was a statistically significant correlation between BEC and TEC (r=0.393, p=0.005) that disappeared after correction by oral corticosteroids (OCS) use (r=0.170, p=0.307). However, there was statistically significant correlation between FeNO and TEC (r=0.481, p=0.006) that was maintained after correction to OCS use (r=0.419, p=0.021). 82.4% of low-BEC had submucosal eosinophilia, 50% of them moderate to severe.
ConclusionA standardized assessment of endobronchial biopsy is feasible and could be useful for a better phenotyping of SUA especially in those receiving OCS.
Severe asthma is a heterogeneous condition1 encompassing several clinical and inflammatory phenotypes that may vary according to the severity of airflow obstruction, frequency of exacerbations, response to treatment, and prognosis.2 These phenotypes can be differentiated according to the age of onset (childhood vs. adulthood asthma), presence of allergy or other predominant findings associated such as nasal polyps. These phenotypes are also biologically different according to the presence or absence of T2 inflammation, that is frequently identified by blood eosinophil counts (BEC) or immunoglobulin E (IgE) levels and fractional exhaled nitric oxide (FeNO). BEC are currently used to decide specific therapies with biologics that target T2 cytokines.3 Induced sputum has been traditionally considered a useful tool4 to characterize T2 inflammation in asthma but it has been relegated by BEC5 due to the complexity of its technique which makes it available only in specialized centers. The exact site of origin of induced sputum material is unknown, and 10–20% of subjects are unable to produce an adequate sputum sample.
However, the correlation between BEC and sputum eosinophils is not optimal and may be influenced by different technical or patient-dependent conditions such as body weight.6 Some studies find a moderate-to-good correlation between BEC and sputum eosinophilia in mild to severe asthma population,7,8 while others find that the predicting power of BEC for sputum eosinophilia is poor.9,10 Moreover, BEC is highly variable in asthma11 and the use of oral corticosteroids (OCS) in severe asthma affects both FeNO, and BEC12 as well as sputum eosinophil count13 which is sometimes insufficient for an accurate stratification of this group of patients. Nevertheless, BEC are currently used to decide specific therapies with biologics that target T2 cytokines.
Unlike the less invasive sputum or exhaled breath analyses, bronchoscopy can obtain bronchial tissue by taking biopsy of the airways visible through the bronchoscope and also add information on possible diagnoses, e.g., gastro-oesophageal reflux disease, vocal cord dysfunction, tracheal stenosis, tumor or foreign-bodies.14 The safety of bronchoscopy in severe asthma (forced expiratory volume in 1s (FEV1)<60% predicted) appears to be acceptable in previous studies.15 However, in clinical practice, bronchoscopy is only recommended in the work-up of severe asthma to exclude unusual comorbidities in non-T2 asthma.16
Bronchoscopic biopsies can provide information on the underlying inflammatory process affecting the airways, since pathological studies which evaluated the whole airways demonstrated that the entire length of the bronchial tree is involved in patients with of asthma.17,18 Nevertheless, endobronchial biopsies have more limited value nowadays due to small size and crush artifacts, but also because specific pathological diagnostic parameters are limited, often resulting in pathology reports with vague descriptions such as “no tumor seen”, “scattered eosinophils”, or “changes concordant with clinical asthma diagnosis”. Thus, studies with better pathological qualification and quantification are required before bronchoscopic biopsies become routine procedures in patients with a severe asthma diagnosis.
Accordingly, we aim to develop and validate a systematic assessment of the bronchial biopsy for the evaluation of severe uncontrolled asthma (SUA) by developing a pathological score.
MethodsStudy design and ethicsThe study was designed in two phases. Firstly, a retrospective analysis of bronchial biopsies of 12 severe asthma patients using a modified protocol from Gordon et al.19 was performed and a pathological score with most relevant items was agreed among 8 expert pathologist. Secondly, the score generated with the items agreed in the previous phase was applied prospectively in samples from a multicentric prospective study that enrolled 62 consecutive patients with SUA (step 4–5) according to Global Initiative for Asthma (GINA 2021) guidelines20 who underwent fiberoptic bronchoscopy as a part of their routine evaluation. The patients were recruited from specialized asthma units in seven teaching hospitals in Spain. The study was approved by the Ethics Committees of the participating centers and was supported by the Instituto de Salud Carlos III, Spain (FIS19/01521) and endorsed by the PII of Asthma (SEPAR). All the patients signed an informed consent before participation.
Characteristics of the participantsAll patients from both phases had a previous diagnosis of SUA defined as asthma that is not adequately controlled (asthma control test (ACT) less than 20 points) despite treatment with high-dose of ICS plus a second controller (LABA and/or LAMA), LTRMs, theophylline or OCS.16,20 Patients with contraindications for bronchoscopy, or exacerbation of asthma within the previous 4 weeks, or refused to sign the consent were excluded from the study.
All the patients underwent complete clinical history, spirometry, and FeNO. A blood sample was taken from all participants for routine laboratory evaluation, C-reactive protein (CRP), IgE, radioallergosorbent test (RAST), complete blood count and differential white blood count (WBC) including BEC. The patients were further divided into 2 groups according to BEC≥300cells/mm3 or less into high-BEC and low-BEC asthma respectively. BEC≥300cells/mm3 is commonly accepted as a cut-off to classify T2-eosinophilic asthma in GINA and GEMA (Spanish asthma management) guidelines20,21 as well as in many clinical trials irrespective of OCS use and correlated with sputum eosinophilia.22–24
BronchoscopyAll the patients underwent fiberoptic bronchoscopy under conscious sedation with systematic assessment of the airways and collection of bronchial aspirate for microbiological and cytological assessment. Two to three endobronchial biopsies (EBBx) were taken from segmental and subsegmental airways of the right lower lobe for histopathological evaluation using size 19 cupped forceps. Diagnostic hematoxylin and eosin (H&E)-stained glass slides from formalin-fixed paraffin-embedded EBBx were systematically assessed and graded by expert pathologist in each center.
Pathological evaluationMorphometric measurements were performed with a light microscope (Leitz Biomed, Leica Cambridge, UK) connected to a video recorder linked to a computerized image system (Quantimet 500 Image Processing and Analysis System, Software Qwin V0200B, Leica). Light-microscopic analysis was performed at a magnification of 40×.
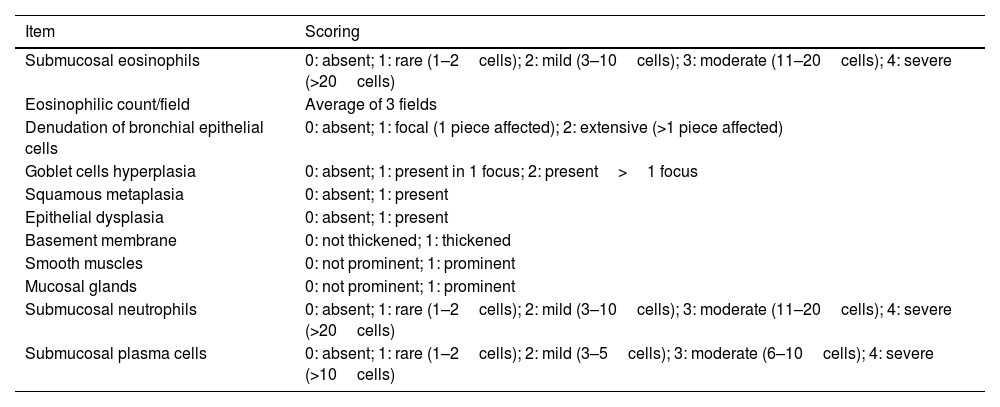
The biopsies were assessed, scanned and scored according to the aforementioned modified protocol by Gordon et al.19 that is described in Table 1. Briefly, a standardized grading score for EBBx was used to assess inflammatory and airway remodeling histopathologic features that are relevant in severe asthma, including the presence (grade 1) or absence (grade 0) of intraepithelial and submucosal inflammation, epithelial changes, basement membrane thickening, prominent airway smooth muscle and submucosal mucous glands. Presence for each inflammatory cell type was graded as absent, rare, mild, moderate, or severe (grade 0–4, respectively) based on arbitrary cut-offs as previously reported. Airway smooth muscle and submucosal mucous glands were categorized as prominent if there were large smooth muscle bundles or submucosal mucous glands identified in each biopsy fragment.19
The modified Gordon et al.15 pathological assessment protocol of SUA bronchial biopsies.
| Item | Scoring |
|---|---|
| Submucosal eosinophils | 0: absent; 1: rare (1–2cells); 2: mild (3–10cells); 3: moderate (11–20cells); 4: severe (>20cells) |
| Eosinophilic count/field | Average of 3 fields |
| Denudation of bronchial epithelial cells | 0: absent; 1: focal (1 piece affected); 2: extensive (>1 piece affected) |
| Goblet cells hyperplasia | 0: absent; 1: present in 1 focus; 2: present>1 focus |
| Squamous metaplasia | 0: absent; 1: present |
| Epithelial dysplasia | 0: absent; 1: present |
| Basement membrane | 0: not thickened; 1: thickened |
| Smooth muscles | 0: not prominent; 1: prominent |
| Mucosal glands | 0: not prominent; 1: prominent |
| Submucosal neutrophils | 0: absent; 1: rare (1–2cells); 2: mild (3–10cells); 3: moderate (11–20cells); 4: severe (>20cells) |
| Submucosal plasma cells | 0: absent; 1: rare (1–2cells); 2: mild (3–5cells); 3: moderate (6–10cells); 4: severe (>10cells) |
Initially, the score was evaluated in a representative sample of 12 different patients (Table S1, online supplement) with SUA by 8 independent expert pathologists for the 11 different items described in Table 1. The agreement between pathologists was calculated using interclass correlation (ICC). Then, the biopsies from the entire population were further assessed using the proposed score. Summation of the pathological items except for eosinophilic count/field was calculated for each sample.
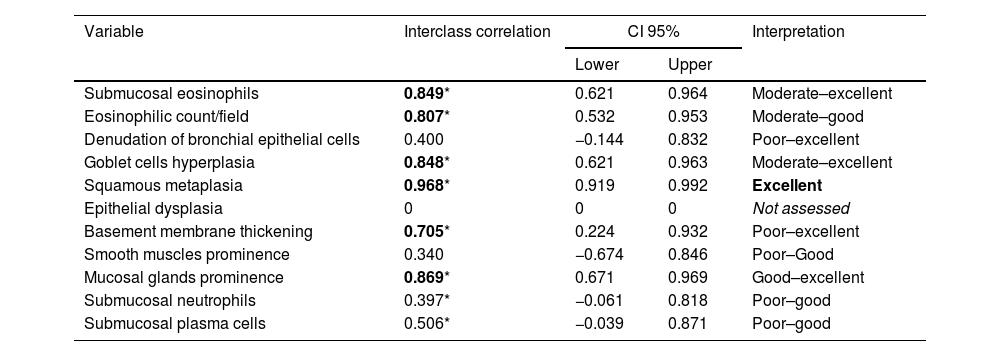
Statistical analysisData are presented as number and percentage (%) for qualitative data and mean±standard deviation (SD) or median and interquartile range (IQR) according to continuous data distribution. Chi-square, t-independent, and Mann–Whitney tests were used as appropriate for comparison between two groups of patients. Interclass correlation (ICC) and confidence interval (CI95%) were used to calculate the agreement between pathologists regarding the proposed pathological score considering the average measures. Two-way random effect model, using absolute agreement as the relationship among raters (absolute differences between the ratings of the 8 pathologists) were used in the current model of ICC calculation.25 The agreement was classified as excellent (ICC>0.9), good (ICC between 0.75 and 0.9), moderate (between 0.5 and 0.75) and poor (ICC<0.5).26 The correlations between the pathological items, pathological score and the patients’ clinical characteristics were calculated using Spearman's rho correlation coefficient. Two-tailed p value<0.05 was considered significant. SPSS software (V 22.0, IBM) was used for all analysis.
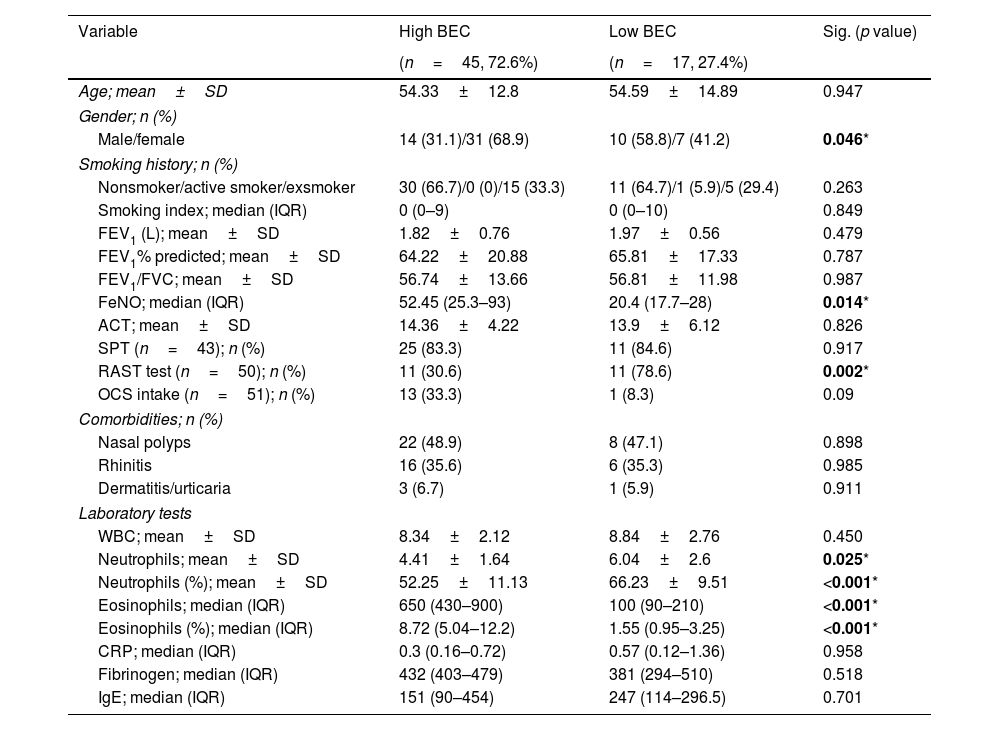
ResultsPatients’ characteristicsSixty-two patients were included in the analysis, divided into high-BEC (45 (72.6%) patients) and low-BEC (17 (27.4%) patients). Table 2 shows the baseline characteristics of the entire population. There was no statistically significant differences between groups regarding age, lung function, asthma control, smoking history or comorbidities (p>0.05, Table 2). As expected, FeNO and BEC were significantly higher in high-BEC asthma compared to low-BEC asthma (median of 52.45 (IQR=25.3–93) vs. 20.4 (IQR=17.7–28)ppb, p=0.014; and 650 (IQR=430–900) vs. 100 (IQR=90–210)cells/mm3, p<0.001, respectively; Table 2). Blood neutrophilic count was significantly higher in low-BEC asthma (6.04±2.6 vs. 4.41±1.64cells/mm3, p=0.025, Table 2). About 33% of high-BEC were maintained on OCS vs. 8% of low-BEC (p=0.09, Table 2). During the bronchoscopy, only 2 patients (3.2%) of the validation cohort had mild to moderate bleeding that was well controlled after local hemostasis.
Baseline characteristics of the studied population (n=62) classified according to blood eosinophilic count (BEC).
| Variable | High BEC | Low BEC | Sig. (p value) |
|---|---|---|---|
| (n=45, 72.6%) | (n=17, 27.4%) | ||
| Age; mean±SD | 54.33±12.8 | 54.59±14.89 | 0.947 |
| Gender; n (%) | |||
| Male/female | 14 (31.1)/31 (68.9) | 10 (58.8)/7 (41.2) | 0.046* |
| Smoking history; n (%) | |||
| Nonsmoker/active smoker/exsmoker | 30 (66.7)/0 (0)/15 (33.3) | 11 (64.7)/1 (5.9)/5 (29.4) | 0.263 |
| Smoking index; median (IQR) | 0 (0–9) | 0 (0–10) | 0.849 |
| FEV1 (L); mean±SD | 1.82±0.76 | 1.97±0.56 | 0.479 |
| FEV1% predicted; mean±SD | 64.22±20.88 | 65.81±17.33 | 0.787 |
| FEV1/FVC; mean±SD | 56.74±13.66 | 56.81±11.98 | 0.987 |
| FeNO; median (IQR) | 52.45 (25.3–93) | 20.4 (17.7–28) | 0.014* |
| ACT; mean±SD | 14.36±4.22 | 13.9±6.12 | 0.826 |
| SPT (n=43); n (%) | 25 (83.3) | 11 (84.6) | 0.917 |
| RAST test (n=50); n (%) | 11 (30.6) | 11 (78.6) | 0.002* |
| OCS intake (n=51); n (%) | 13 (33.3) | 1 (8.3) | 0.09 |
| Comorbidities; n (%) | |||
| Nasal polyps | 22 (48.9) | 8 (47.1) | 0.898 |
| Rhinitis | 16 (35.6) | 6 (35.3) | 0.985 |
| Dermatitis/urticaria | 3 (6.7) | 1 (5.9) | 0.911 |
| Laboratory tests | |||
| WBC; mean±SD | 8.34±2.12 | 8.84±2.76 | 0.450 |
| Neutrophils; mean±SD | 4.41±1.64 | 6.04±2.6 | 0.025* |
| Neutrophils (%); mean±SD | 52.25±11.13 | 66.23±9.51 | <0.001* |
| Eosinophils; median (IQR) | 650 (430–900) | 100 (90–210) | <0.001* |
| Eosinophils (%); median (IQR) | 8.72 (5.04–12.2) | 1.55 (0.95–3.25) | <0.001* |
| CRP; median (IQR) | 0.3 (0.16–0.72) | 0.57 (0.12–1.36) | 0.958 |
| Fibrinogen; median (IQR) | 432 (403–479) | 381 (294–510) | 0.518 |
| IgE; median (IQR) | 151 (90–454) | 247 (114–296.5) | 0.701 |
BEC: blood eosinophilic count, SPT: skin prick test, FEV1: forced expiratory volume in 1 second, FVC: forced vital capacity, L: liter, WBC: white blood count, RAST: radio-allergosorbent test, CRP: C-reactive protein, IgE: immunoglobulin E, ACT: asthma control test, FeNO: fraction of nitric oxide, n: number, SD: standard deviation.
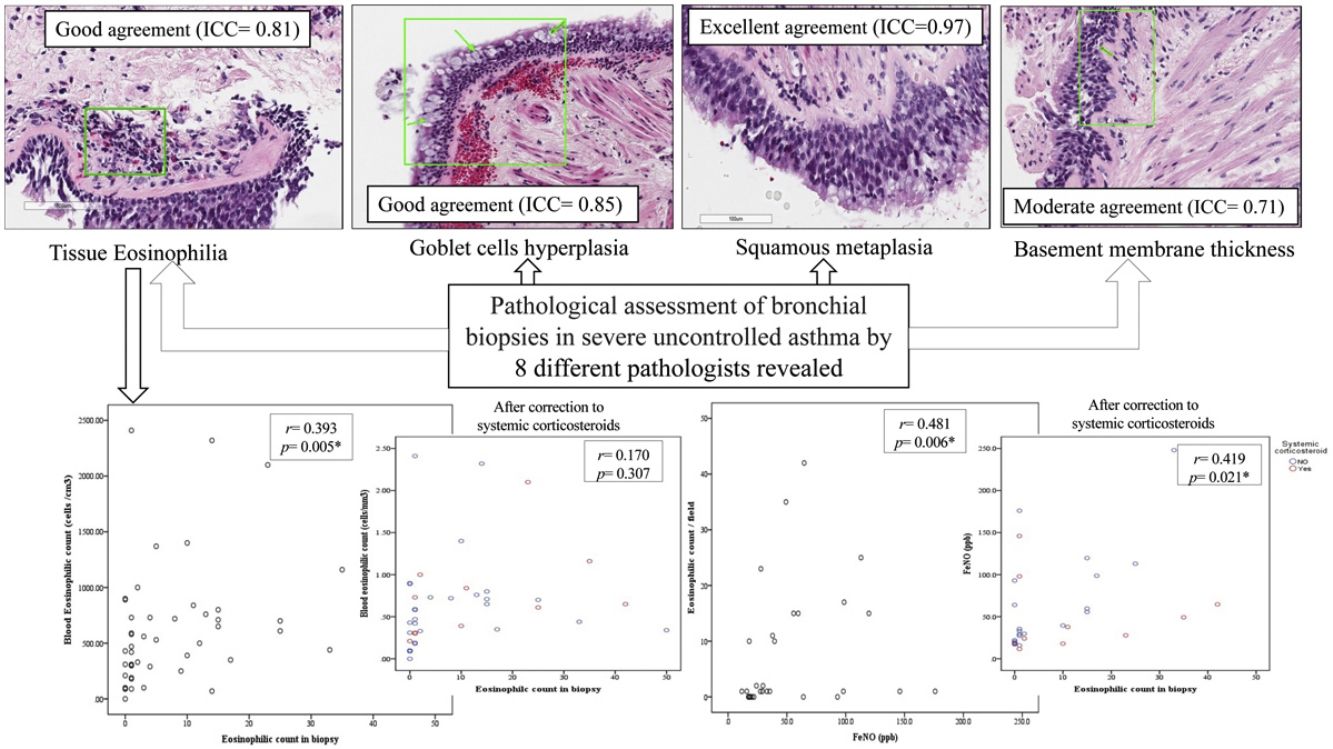
In the first phase of the study of 12 samples, there was good agreement among pathologists regarding submucosal eosinophils, eosinophilic count per field, mucosal glands and goblet cells hyperplasia (ICC=0.85, 0.81, 0.87 and 0.85 respectively, p<0.05, Table 3) with CI95% between 0.53 and 0.97 (Table 3 and Fig. 1A, B). Excellent agreement was detected among pathologists regarding squamous metaplasia (ICC=0.97, CI95%=0.92–0.99, p<0.05, Table 3, Fig. 1C). However, there was moderate agreement regarding basement membrane thickening (ICC=0.71, CI95%=0.22–0.93, p<0.05, Table 3, Fig. 1D) and poor agreement on smooth muscle prominence (Fig. 1E), submucosal neutrophils, submucosal plasma cells and denudation of bronchial epithelial cells (ICC<0.05). None of the pathologist detected epithelial dysplasia in the samples.
Agreement between the pathologists in the different pathological items.
| Variable | Interclass correlation | CI 95% | Interpretation | |
|---|---|---|---|---|
| Lower | Upper | |||
| Submucosal eosinophils | 0.849* | 0.621 | 0.964 | Moderate–excellent |
| Eosinophilic count/field | 0.807* | 0.532 | 0.953 | Moderate–good |
| Denudation of bronchial epithelial cells | 0.400 | −0.144 | 0.832 | Poor–excellent |
| Goblet cells hyperplasia | 0.848* | 0.621 | 0.963 | Moderate–excellent |
| Squamous metaplasia | 0.968* | 0.919 | 0.992 | Excellent |
| Epithelial dysplasia | 0 | 0 | 0 | Not assessed |
| Basement membrane thickening | 0.705* | 0.224 | 0.932 | Poor–excellent |
| Smooth muscles prominence | 0.340 | −0.674 | 0.846 | Poor–Good |
| Mucosal glands prominence | 0.869* | 0.671 | 0.969 | Good–excellent |
| Submucosal neutrophils | 0.397* | −0.061 | 0.818 | Poor–good |
| Submucosal plasma cells | 0.506* | −0.039 | 0.871 | Poor–good |
 Eosinophilic infiltration of the submucosa (square); (B) Goblet cells hyperplasia (arrow); (C) Squamous metaplasia (square); (D) Thickness of the basement membrane (arrow); (E) Smooth muscle hypertrophy (arrow).")
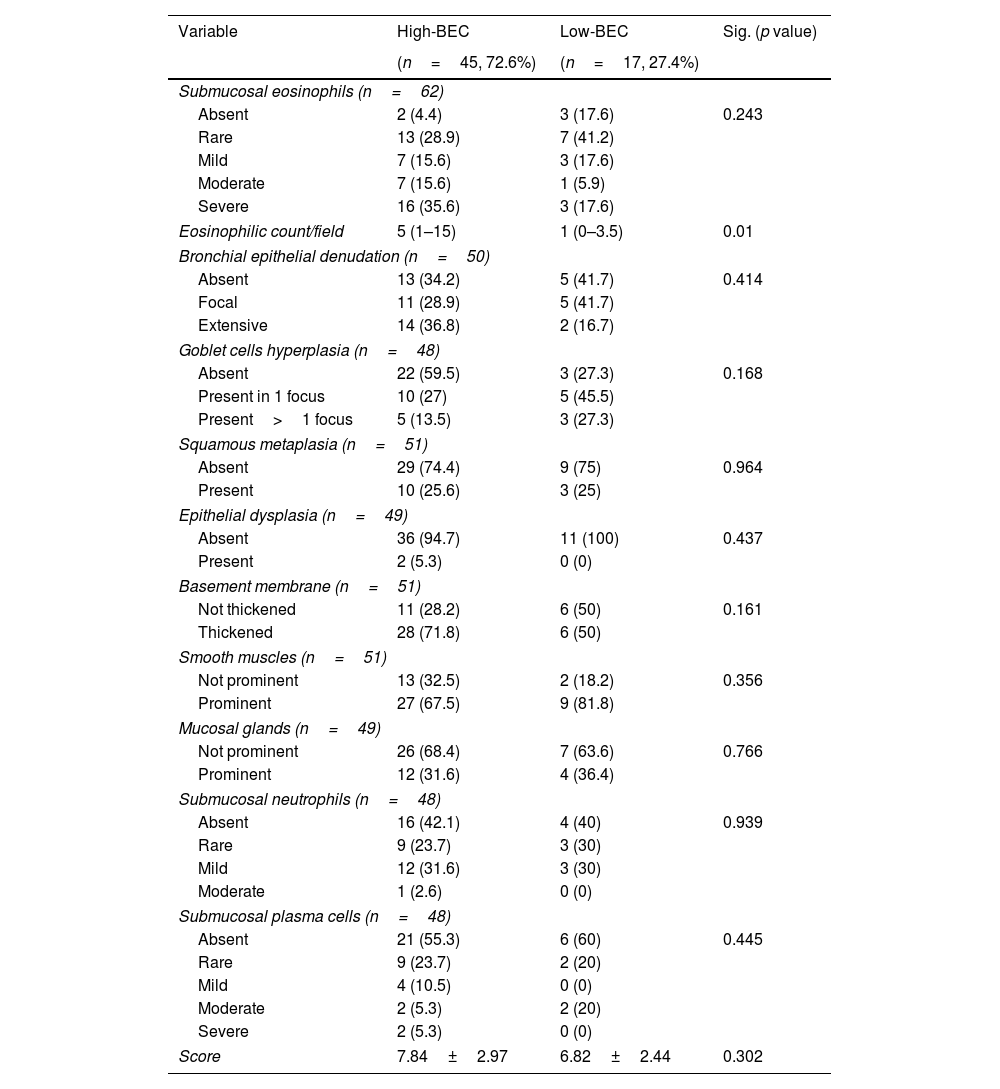
In the assessment of the validation cohort, there was statistically significant differences between both groups regarding the eosinophilic count in submucosa/field (median of 5 (IQR=1–15) vs. 1 (IQR=0–3.5), p=0.01, Table 4). However, there was no statistically significant differences between the other 10 items of the score between high-BEC and low BEC asthma groups (p>0.05, Table 4). Nevertheless, 14 patients (82.4%) of those with low-BEC asthma showed tissue eosinophilia on biopsy, of whom 4 patients (23.5%) had moderate to severe tissue eosinophilia (Table 4). Moreover, submucosal eosinophils could be still detected among OCS dependent asthma patients (14 patients) ranging from rare to severe, with 50% of them showing moderate to severe tissue eosinophilia (Fig. S1).
Frequencies of the pathological variables in the studied population classified according to BEC.
| Variable | High-BEC | Low-BEC | Sig. (p value) |
|---|---|---|---|
| (n=45, 72.6%) | (n=17, 27.4%) | ||
| Submucosal eosinophils (n=62) | |||
| Absent | 2 (4.4) | 3 (17.6) | 0.243 |
| Rare | 13 (28.9) | 7 (41.2) | |
| Mild | 7 (15.6) | 3 (17.6) | |
| Moderate | 7 (15.6) | 1 (5.9) | |
| Severe | 16 (35.6) | 3 (17.6) | |
| Eosinophilic count/field | 5 (1–15) | 1 (0–3.5) | 0.01 |
| Bronchial epithelial denudation (n=50) | |||
| Absent | 13 (34.2) | 5 (41.7) | 0.414 |
| Focal | 11 (28.9) | 5 (41.7) | |
| Extensive | 14 (36.8) | 2 (16.7) | |
| Goblet cells hyperplasia (n=48) | |||
| Absent | 22 (59.5) | 3 (27.3) | 0.168 |
| Present in 1 focus | 10 (27) | 5 (45.5) | |
| Present>1 focus | 5 (13.5) | 3 (27.3) | |
| Squamous metaplasia (n=51) | |||
| Absent | 29 (74.4) | 9 (75) | 0.964 |
| Present | 10 (25.6) | 3 (25) | |
| Epithelial dysplasia (n=49) | |||
| Absent | 36 (94.7) | 11 (100) | 0.437 |
| Present | 2 (5.3) | 0 (0) | |
| Basement membrane (n=51) | |||
| Not thickened | 11 (28.2) | 6 (50) | 0.161 |
| Thickened | 28 (71.8) | 6 (50) | |
| Smooth muscles (n=51) | |||
| Not prominent | 13 (32.5) | 2 (18.2) | 0.356 |
| Prominent | 27 (67.5) | 9 (81.8) | |
| Mucosal glands (n=49) | |||
| Not prominent | 26 (68.4) | 7 (63.6) | 0.766 |
| Prominent | 12 (31.6) | 4 (36.4) | |
| Submucosal neutrophils (n=48) | |||
| Absent | 16 (42.1) | 4 (40) | 0.939 |
| Rare | 9 (23.7) | 3 (30) | |
| Mild | 12 (31.6) | 3 (30) | |
| Moderate | 1 (2.6) | 0 (0) | |
| Submucosal plasma cells (n=48) | |||
| Absent | 21 (55.3) | 6 (60) | 0.445 |
| Rare | 9 (23.7) | 2 (20) | |
| Mild | 4 (10.5) | 0 (0) | |
| Moderate | 2 (5.3) | 2 (20) | |
| Severe | 2 (5.3) | 0 (0) | |
| Score | 7.84±2.97 | 6.82±2.44 | 0.302 |
There was statistically significant correlation between BEC and both submucosal eosinophilia and eosinophilic count in submucosa/field (r=0.338, p=0.007 and r=0.393, p=0.005 respectively, Fig. 2A, B) but this correlation disappeared in patients who were receiving OCS (r=0.258, p=0.071 and r=0.170, p=0.307 respectively, Fig. 2D). Further, FeNO significantly correlated with eosinophilic count in submucosa/field (r=0.481, p=0.006, Fig. 2C) and this correlation was maintained after correction for OCS use (r=0.419, p=0.021, Fig. 2F). Moreover, FeNO but not BEC significantly correlated with eosinophilic count in submucosa/field among low-BEC asthma group (r=0.828, p=0.042 and r=0.295, p=0.352 respectively, Table S2).
 Correlation between BEC and submucosal eosinophils (r=0.338, p=0.007); (B) Correlation between BEC and eosinophilic count in bronchial biopsy (r=0.393, p=0.005); (C) Correlation between FeNO and eosinophilic count in bronchial biopsy (r=0.481, p=0.006); (D) Correlation between BEC and eosinophilic count in bronchial biopsy after correction to systemic corticosteroids use (r=0.170, p=0.307; partial correlation); (F) Correlation between the FENO (PPB) and eosinophilic count in bronchial biopsy after correction to systemic corticosteroids use (r=0.419, p=0.021; partial correlation).")
(A) Correlation between BEC and submucosal eosinophils (r=0.338, p=0.007); (B) Correlation between BEC and eosinophilic count in bronchial biopsy (r=0.393, p=0.005); (C) Correlation between FeNO and eosinophilic count in bronchial biopsy (r=0.481, p=0.006); (D) Correlation between BEC and eosinophilic count in bronchial biopsy after correction to systemic corticosteroids use (r=0.170, p=0.307; partial correlation); (F) Correlation between the FENO (PPB) and eosinophilic count in bronchial biopsy after correction to systemic corticosteroids use (r=0.419, p=0.021; partial correlation).
There was a statistically significant inverse correlation between FEV1 and the smooth muscle prominence as well as between denudation of bronchial epithelial cells and FEV1/FVC (p<0.05, Table S3). However, there were no statistically significant correlations between symptoms (ACT) and any of the pathological items (p>0.05, Table S3).
DiscussionWe have demonstrated that the standardized pathological assessment of bronchial biopsies in SUA yielded good agreement between pathologists in most of its proposed items and renders a good correlation with clinical variables that are relevant in phenotyping severe asthma beyond blood eosinophils and regardless the use of oral corticosteroids, especially with FeNO.
Previous studiesA large number of clinical studies have demonstrated the relationship between T2 inflammation and SUA, but most of them using BEC or induced sputum. Kraft et al.27 found that asthma population with BEC>300cells/μL and FeNO>50ppb had higher rate of asthma exacerbation/year regardless IgE. Similarly, Busse et al.28 found that high FeNO in combination with high BEC was associated with higher rate of exacerbations in uncontrolled asthma patients. Bronchial biopsies have been used for research purposes and to evaluate response to novel therapies. Chakir et al.29 performed bronchial biopsies in asthmatic patients’ candidate for bronchial thermoplasty in order to evaluate bronchial smooth muscle reduction and basement membrane changes after therapy. Further, Gordon et al.19 were the first to propose a standardized histologic grading form for endobronchial biopsies that could be included in the diagnostic pathology report although they found no significant difference between asthma and controls for some of the proposed items in the form. In their study, they performed bronchial biopsies in severe asthma prior to thermoplasty and they reported goblet cells hyperplasia, increased intraepithelial eosinophils and hypertrophied smooth muscle that decreased after therapy. Moreover, they found that tissue eosinophilia correlated significantly with FeNO.19 Our results are in accordance with this data and extended them to those patients under OCS treatment as we found significant positive correlation with tissue eosinophilia and BEC and FeNO as well as inverse correlation between FEV1 and smooth muscle prominence.
Interpretation of novel resultsIn this study, we demonstrate that a modification of the previously proposed assessment of EBBx renders a good interobserver agreement which makes it feasible to be applied in real life. To our knowledge, this the first study that tests the validity of a pathological score for evaluation SUA using systematic standardized evaluation of bronchial biopsies in a large prospective cohort of patients. In the era of biologics, histopathological scores are used in other inflammatory diseases, such as inflammatory bowel diseases30–32 to guide the use of biologics for selected patients. Our results suggest that the current way of selecting candidate patients to receive biologic therapies for SUA using BEC is imprecise. In the current study, we found that tissue eosinophilia ranging from rare to severe could be still detected in 82.4% of low-BEC group. Elliot et al.23 found in post-mortem samples that airway remodeling occurred irrespective of the type of airway inflammation in asthma especially regarding smooth muscle hypertrophy and basement membrane thickness. Our findings support this concept as the proposed pathological score was not significantly differ between high- and low-BEC groups. Lommatzsch et al.33 found that BEC and FeNO are higher in T2 high inflammation being more frequent in severe adult onset asthma, but there was no correlation between BEC and FeNO. Toledo-Pons et al.11 found that BEC is highly variable among asthma population and one absolute value is not sufficient to predict poor clinical outcomes. In order to serve as a better biomarker, Bandyopadhyay et al.34 found that sputum eosinophils>3% was a good biomarker to assess asthma severity and response to therapy. However, Cianchetti et al.35 found that sputum eosinophilia weakly correlated to asthma severity. Our results support the role of bronchoscopy in the assessment of severe asthma. Bronchoscopy was previously found to be a safe procedure in severe asthma with good tolerability during the procedure and rare exacerbation afterward.15,36,37 In the current study, we had 3.2% of mild-to moderate bleeding that was well controlled during the procedure denoting the safety of bronchoscopy, which did not have any entry restrictions for lung function since we included allcomers with severe asthma regardless of lung function. We have recently shown in a larger population that bronchoscopy is safe and useful in phenotyping severe asthma.38
Moreover, we found that tissue eosinophilia could be still detected in OCS dependents being moderate-to-severe in 50% of them that was positively correlating with FeNO but not BEC after correction for OCS use. Ortega et al.39 found that BEC decreased after OCS initiation in asthma patients and did not return to its index levels after OCS discontinuation. Further, Wenzel et al.37 found that despite the use of high dose of OCS, airway inflammation remains in SUA with no data regarding the peripheral BEC. Similarly, Chakir et al.40 found persistent cellular infiltration by both lymphocytes and eosinophils in about 50% of bronchial biopsies in a small series of asthma patients after treatment with high dose OCS for 14 days.
Clinical implicationTissue eosinophilia assessed by EBBx could be a promising good biomarker of T2 high asthma and useful guide for specific therapies especially in those receiving OCS or with low-BEC since tissue eosinophilia could be still detected in those patients. Further, adding FeNO to tissue eosinophilia could be the best combined biomarkers helping personalization of asthma therapy under these circumstances. Current guidelines consider BEC, total IgE and FeNO as biomarkers for high-T2 asthma20 and are the cornerstone before initiating biological therapy, especially BEC. The standardization of the assessment of EBBx should help to better characterize these patients and select the best candidates for expensive therapies.
LimitationsThe current study has some limitations. Firstly, we did not include a control group in the current study. Since we aimed to validate Gordon et al.15 protocol and this already included a comparison to a control group, we consider it unnecessary. Secondly, most of our patients had high-BEC so the results on the group with low-BEC may be elusive. Still, despite not significant, some clinically relevant findings are described. Finally, we did not include sputum eosinophils in the evaluation of airway inflammation in the current population so we cannot postulate that EBBx is better than sputum analysis in SUA. Nevertheless, sputum analysis technique is not feasible in many centers and needs some technical experience.34,35 Further, bronchoscopy is gaining high acceptance in the evaluation of severe asthma according to latest guidelines.20,21
ConclusionsThe endobronchial biopsy is a useful and valid tool to assess relevant aspects of severe asthma, especially tissue eosinophilia. The standardized pathological assessment proposed is feasible and adds value in phenotyping patients beyond blood eosinophils, especially in those receiving oral corticosteroids.
FundingThe study was funded by the Instituto de Salud Carlos III, Ministry of Health of Spain (PI19/01521) and endorsed by the asthma research board of SEPAR.
Conflict of interestBorja G. Cosio declares speaker fees, advisory board fees or research grants from ASTRAZENECA, TEVA, SANOFI, CHIESI, GSK and NOVARTIS. The rest of authors declare no conflict of interest.
Authors are thankful to the pathologist Mar Iglesias, Melchor Saiz and Bairon Paz for their insights and contribution in the validation of the pathological score. Also we thank the bronchoscopy teams from the participating centers for their cooperation in the sample collection.
The following are the supplementary data to this article:


