

The main aim of this study was to assess the utility of differential white cell count and cell population data (CPD) for the detection of COVID-19 in patients admitted for community-acquired pneumonia (CAP) of different etiologies.
MethodsThis was a multicenter, observational, prospective study of adults aged ≥18 years admitted to three teaching hospitals in Spain from November 2019 to November 2021 with a diagnosis of CAP. At baseline, a Sysmex XN-20 analyzer was used to obtain detailed information related to the activation status and functional activity of white cells.
ResultsThe sample was split into derivation and validation cohorts of 1065 and 717 patients, respectively. In the derivation cohort, COVID-19 was confirmed in 791 patients and ruled out in 274 patients, with mean ages of 62.13 (14.37) and 65.42 (16.62) years, respectively (p<0.001). There were significant differences in all CPD parameters except MO-Y. The multivariate prediction model showed that lower NE-X, NE-WY, LY-Z, LY-WY, MO-WX, MO-WY, and MO-Z values and neutrophil-to-lymphocyte ratio were related to COVID-19 etiology with an AUC of 0.819 (0.790, 0.846). No significant differences were found comparing this model to another including biomarkers (p=0.18).
ConclusionsAbnormalities in white blood cell morphology based on a few cell population data values as well as NLR were able to accurately identify COVID-19 etiology. Moreover, systemic inflammation biomarkers currently used were unable to improve the predictive ability. We conclude that new peripheral blood biomarkers can help determine the etiology of CAP fast and inexpensively.
The coronavirus disease 2019 (COVID-19) caused by severe acute respiratory syndrome coronavirus 2 (SARS-CoV-2) was identified in December 2019 and the outbreak was declared a pandemic on March 11 by World Health Organization.1 It has caused over 500 million confirmed cases and over 6 million deaths.2 Early diagnosis of SARS-CoV-2 infection is crucial, not only for its long incubation period with a median of 5–7 days but also because it requires isolation to prevent the spread of the disease as well as specific management.3 During the last 2 years, reverse transcription polymerase chain reaction (RT PCR) tests for SARS-CoV-2 have been necessary for the diagnosis leading to a significant increase in healthcare costs. Both access to these tests and the time to test results vary between regions. In addition, if the result is negative but the suspicion of COVID-19 remains high, the test tends to be repeated, possibly also requiring the collection of additional samples.4
Abnormalities in white blood cell morphology (size, shape and composition) have been observed and related to response to infection.5 Actually, in sepsis there are functional changes in certain monocytes subsets and it is reflected in a variation in the morphology of monocytes.6 Immune dysregulation characterizes SARS-CoV-2 infection leading to certain features in differential white blood cell count such as neutrophilia or lymphopenia and morphological abnormalities, which might be useful for early recognition of the infection.7 Over the past few decades, hematology analyzers have undergone rapid development due to technological advances, allowing new parameters to be reported along with the basic complete blood count (CBC). Cell population data (CPD) are background parameters providing quantitative information on the morphological and functional characteristics of blood cells. In particular, various characteristics of blood cells like granularity, volume, and nucleic acid/protein content describe their morphology.
This detailed study of white blood cells and their morphological variations, which can be quantified with numerical values from the CPD, might be useful for COVID-19 screening.8 In this context, the aim of this study was to assess the utility of these parameters for the detection of COVID-19 in patients admitted for community-acquired pneumonia (CAP) of different etiologies.
MethodsStudy designThis was a multicenter prospective observational study of patients hospitalized with CAP from November 2019 to November 2021. The study was approved by the Regional Ethics Committee (PI2019090, 17 July 2019) and registered in ClinicalTrials.gov:NCT 04930926. All participants provided informed consent before their inclusion and after being informed about the study and having discussed its goals, risks, and potential benefits.
Setting and study populationThis study was carried out in three hospitals in the north of Spain, part of the national public health service network. Hospitalized consecutive patients diagnosed with CAP were recruited over a period of 2 years. Eligible patients were ≥18 years old and hospitalized with a diagnosis of CAP. Pneumonia was defined as pulmonary infiltrate on chest X-ray not seen previously, plus at least one symptom compatible with pneumonia such as cough, fever, dyspnea, and/or chest pain.9 Patients were excluded if they had been discharged from an acute care hospital, an onsite subacute care unit, or a palliative care unit within the previous 14 days, or were HIV positive or chronically immunosuppressed (defined as immunosuppression for solid organ transplantation, having undergone a splenectomy, receiving ≥10mg/d of prednisone or equivalent for >30 days, taking other immunosuppressive agents, or having neutropenia, i.e., neutrophil count<109/L).
Data collectionDemographic and clinical data for each patient were collected at baseline from medical records and included comorbidities, physical examination findings, radiological presentation, and laboratory test results, as well as complications during admission. Disease severity was assessed using Confusion, Urea, Respiratory rate, Blood pressure, and age>65 (CURB-65) and Severe Community-Acquired Pneumonia (SCAP) scores, calculated within the first 24h after diagnosis.10,11 All patients were managed according to clinical guidelines that ensured the prospective and systematic collection of relevant clinical information.
Patients with COVID-19 were diagnosed following the current standards, based on positive results in real-time RT-PCR and/or antigen tests for SARS-CoV-2 in throat swab specimens. Additionally, sputum or urinary antigen tests were performed and other viruses, bacteria and atypic microorganisms were screened by standard laboratory methods.
At baseline, a Sysmex XN-20 analyzer was used to obtain detailed information related to the morphological and functional characteristics of white blood cells based on the internal cellular complexity (NE-X, LY-X, MO-X, NE-WX, LY-WX and MO-WX), cell size (NE-Z, LY-Z, MO-Z, NE-WZ, LY-WZ and MO-WZ) and quantity of nucleic acid (NE-Y, LY-Y, MO-Y, NE-WY, LY-W, and MO-WY). The membrane composition of activated cells is different from that of resting cells. The optical signals are different which allows to distinguish the morphological changes that have occurred and that are directly related to the functionality and which can be quantified with numerical values from the CPD. A detailed explanation of the cell population data is given in Supplementary Table 1.
Assessment of outcomesThe primary outcome was the etiology of CAP, to distinguish between SARS-CoV-2 infection and other etiologies among patients admitted for CAP. SARS-CoV-2 infection was confirmed by real-time RT-PCR and/or antigen tests for SARS-CoV-2 in throat swab samples.
Statistical analysisAs a first step, the sample of eligible patients included in the analysis was split into two cohorts: derivation (60% of the overall sample) and validation (40%) sets.12,13 An exploratory data analysis was conducted of the characteristics of the sample by (1) cohort type and (2) SARS-CoV-2 positive status, calculating mean and standard deviations (or median and interquartile ranges) for continuous variables and frequencies and percentages for categorical variables. The non-parametric Wilcoxon test (for continuous variables) and the Chi-square test or Fisher's exact test as appropriate (for categorical ones) were performed to assess the homogeneity of data on demographic and clinical features.
In the derivation cohort, we first performed univariate analysis to evaluate the relationship of the demographic, clinical and laboratory CPD features with the presence of COVID-19. Again, the non-parametric Wilcoxon test (for continuous variables) and the Chi-square test or Fisher's Exact test as appropriate (for categorical ones) were used. Furthermore, the optimal cut-off points for each of the CPD that best predicted SARS-CoV-2 positive status were determined, and the relationship of the categorized CPD values with this status was expressed using odds ratios (ORs) and their corresponding 95% confidence intervals (CIs).
As a next step, a multivariate logistic regression model was developed to identify any independent predictors of SARS-CoV-2 status. To do so, variables with a p-value in the previous step of <0.20 were included as explanatory variables. Using a backward procedure, the final multivariate model was obtained. The ORs and 95% CIs of all selected variables are reported. Collinearity among the final explanatory variables was evaluated by means of the correlations and the variance inflation factor (VIF). VIF values>3 will be considered as indicative of collinearity.14 The beta coefficients from this model were used to weight the relative importance of each variable for calculating the prediction score. Specifically, weights were calculated as the beta coefficient for each predictor in the model divided by the variable with the lowest beta coefficient and rounded to the nearest whole number.15 Similarly, from those CPD features more highly associated with the outcome of interest we developed a reduced multivariable version.
From the weights derived from the beta coefficient weights of the variables obtained in the multivariable model in the derivation sample we developed a continuous prediction score for each patient, and three risk categories were established (mild, moderate and severe) based on predicted versus observed SARS-CoV-2 status. We tested the continuous and categorized risk scores in the validation cohort. The same was also done for the reduced model.
Model robustness was assessed in terms of discrimination and calibration. Model discrimination was evaluated by computing the area under the receiver operating characteristic curve (AUC), considering an AUC value>0.70 to indicate good discrimination.16 The AUC value was obtained after having performed bootstrapping with 2000 samples. The Hosmer–Lemeshow test was used to gauge the ability of the model to match predicted and observed SARS-CoV-2 status in the logistic models.
All the statistical procedures were performed using SAS for Windows, version 9.4 (SAS Institute, Cary, NC). Figures were plotted using R version 4.40. All effects were considered significant at p<0.05 unless stated otherwise.
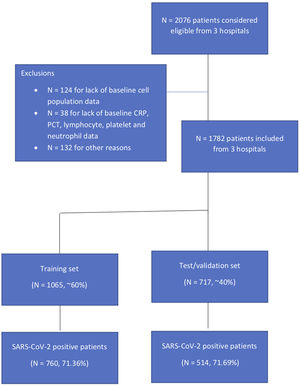
ResultsIn this study, 1782 patients were included for analysis from three different teaching hospitals, 1065 in the training set and 717 patients in the validation set (Supplementary Fig. 1). Overall, 71.36% were positive for SARS-CoV-2 in the first set and 71.69% in the second. There were no statistically significant differences between these cohorts in baseline characteristics or main outcomes (Supplementary Table 2). Table 1 summarizes sociodemographic and clinical data by SARS-CoV-2 status in the derivation cohort. In the derivation cohort, COVID-19 was confirmed in 791 and ruled out in 274 patients, with mean ages of 62.13 (14.37) and 65.42 (16.62), respectively (p<0.001). Compared to SARS-CoV-2 negative (non-COVID-19) patients, SARS-CoV-2 positive (COVID-19) patients were less severe as measured by the CURB-65 while there were no differences in severity as measured by the SCAP. The 30-day mortality rate was 6.20%, corresponding to 54 (6.83%) patients who were SARS-CoV-2 positive and 12 (4.38%) who were not (p 0.19). Patients with COVID-19 were more likely to be admitted to the intensive care unit (ICU), receive mechanical ventilation, vasopressors, and/or noninvasive ventilation and be readmitted within 30 days (Table 1). Etiology distribution and coinfection data are shown in Table 2. S. pneumoniae was the most commonly isolated bacteria in both groups, but was more frequent among non-Covid-19 patients.
Descriptive statistics of the sociodemographic and clinical data by SARS-CoV-2 status in the derivation sample (n=1065).
| SARS-CoV-2 STATUS | ||||
|---|---|---|---|---|
| Negative | Positive | Total | ||
| (N=274) | (N=791) | (n=1065) | p-Value | |
| Sex | 0.234 | |||
| Male | 166 (24.52) | 511 (75.48) | 677 (63.57) | |
| Female | 108 (27.84) | 280 (72.16) | 388 (36.43) | |
| Age, mean (sd) | 65.42 (16.62) | 62.13 (14.37) | 63.07 (15.11) | <0.001 |
| Living in residential care | 9 (40.91) | 13 (59.09) | 22 (2.07) | 0.14 |
| Charlson Comorbidity Index | 0.08 | |||
| 0 | 157 (23.82) | 502 (76.18) | 659 (61.88) | |
| 1 | 56 (25.23) | 166 (74.77) | 222 (20.85) | |
| 2 | 29 (32.22) | 61(67.78) | 90 (8.45) | |
| ≥3 | 32 (34.04) | 62 (65.96) | 94 (8.83) | |
| SCAP score, mean (sd) | 7.47 (7.38) | 7.91 (7.04) | 7.80 (7.12) | 0.64 |
| SCAP | 0.33 | |||
| <2 | 82 (21.64) | 297 (78.36) | 379 (67.80) | |
| ≥2 | 46 (25.56) | 134 (74.44) | 180 (32.20) | |
| CURB-65 score, mean (sd) | 1.29 (1.09) | 0.96 (0.91) | 1.05 (0.97) | <0.001 |
| CURB-65 | <0.001 | |||
| ≤2 | 145 (22.21) | 508 (77.79) | 653 (93.15) | |
| >2 | 26 (54.17) | 22 (45.83) | 48 (6.85) | |
| Complicationsa | ||||
| Death within 30 days | 12 (4.38) | 54 (6.83) | 66 (6.20) | 0.19 |
| Invasive mechanical ventilation | 10 (3.65) | 74 (9.36) | 84 (7.89) | 0.002 |
| Use of vasopressors | 7 (2.55) | 51 (6.45) | 58 (5.45) | 0.01 |
| Intensive care unit admission | 20 (7.30) | 139 (17.57) | 159 (14.93) | <0.001 |
| Noninvasive mechanical ventilation | 35 (12.77) | 238 (30.09) | 273 (25.63) | <0.001 |
| Readmission within 30 days | 27 (9.87) | 47 (5.94) | 74 (6.95) | 0.04 |
CURB65, Confusion, Urea, Respiratory rate, Blood pressure, and age>65; SCAP, Severe Community-Acquired Pneumonia.
Values are expressed are frequencies (row percentages).
Etiology distribution by SARS-CoV-2 status in the derivation sample.
| Non-COVID-19 patients (n=449) | COVID-19 patients (n=1333) | Total (n=1782) | p-Value* | |
|---|---|---|---|---|
| Type of positivity | ||||
| Viral | 14 (3.12) | 6 (0.45) | 20 (1.12) | <0.001 |
| Bacterial | 97 (21.60) | 76 (5.70) | 173 (9.71) | <0.001 |
| Virus (n=20)* | ||||
| Adenovirus E | 2 (14.29) | 0 (0) | 2 (10) | 0.33 |
| Bocavirus | 0 | 0 | 0 (0) | – |
| Influenza A | 5 (35.71) | 0 (0) | 5 (25) | 0.26 |
| Metapneumovirus | 0 | 0 | 0 (0) | – |
| Parainfluenza | 3 (21.43) | 6 (100) | 9 (45) | 0.002 |
| Rhinovirus | 3 (21.43) | 0 (0) | 3 (15) | 0.52 |
| Respiratory syncytial virus | 1 (7.14) | 0 (0) | 1 (5) | 0.50 |
| Influenza B | 1 (7.14) | 0 (0) | 1 (5) | 0.50 |
| Bacteria (n=173)* | ||||
| S. pneumoniae | 42 (43.30) | 19 (25) | 61 (35.26) | 0.02 |
| H. influenzae | 3 (3.09) | 5 (6.58) | 8 (4.62) | 0.30 |
| Staphylococcus aureus | 4 (4.12) | 10 (13.16) | 14 (8.09) | 0.05 |
| P. aeruginosa | 6 (6.19) | 3 (3.95) | 9 (5.20) | 0.73 |
| Escherichia coli | 9 (9.28) | 5 (6.58) | 14 (8.09) | 0.58 |
| K. pneumoniae | 5 (5.15) | 1 (1.32) | 6 (3.47) | 0.23 |
| Serratia marcescens | 0 (0) | 0 (0) | 0 (0) | - |
| L. pneumophila | 14 (14.43) | 10 (13.16) | 24 (13.87) | 0.81 |
| M. pneumoniae | 3 (3.09) | 11 (14.47) | 14 (8.09) | 0.01 |
| C. burnetti | 9 (9.28) | 9 (11.84) | 18 (10.40) | 0.62 |
| C. pneumoniae | 11 (11.34) | 13 (17.11) | 24 (13.87) | 0.38 |
| M. catarrhalis | 2 (2.06) | 1 (1.32) | 3 (1.73) | 0.71 |
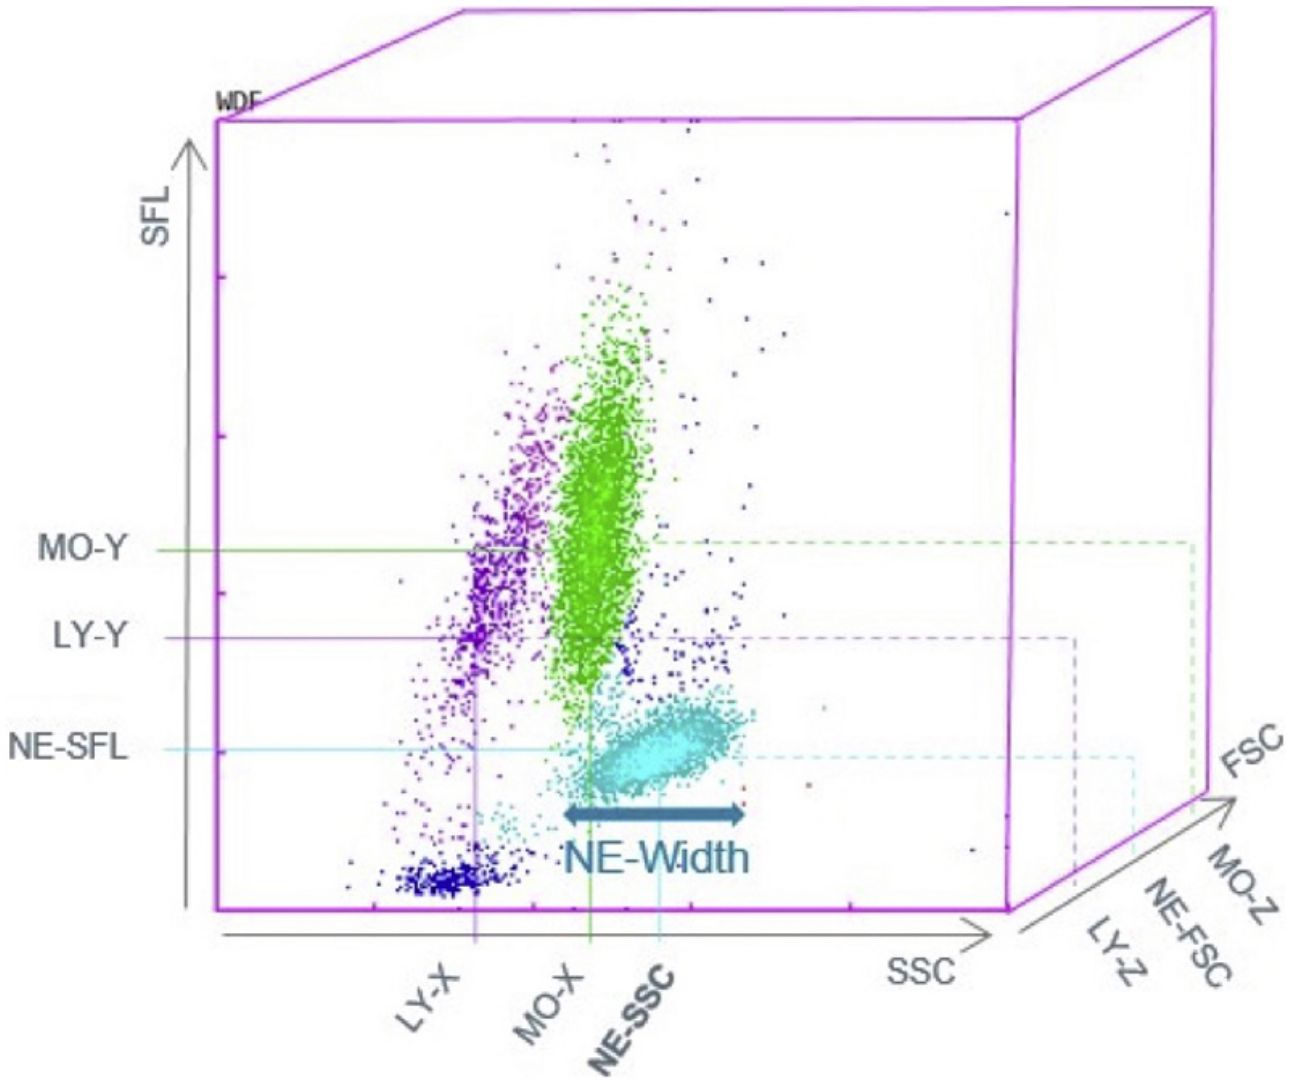
Fig. 1 presents the differential white cell counts, CPD parameters and biomarker levels by SARS-CoV-2 positive status as well as cut-offs, ORs (95%CI) and p values. There were significant differences in all CPD parameters except MO-Y. In addition, COVID-19 patients presented significantly lower CRP and PCT levels, as well as a lower neutrophil/lymphocyte ratio (NLR) than non-COVID patients with a median of 5.79 (3.43–9.64) in COVID-19 patients and 9.32 (5.22–17.83) in non-COVID-19 patients (OR 3.47, [2.61, 4.61], p<0.001, OR 9.41 [6.02, 14.69], p<0.001, and OR 2.83 [2.13, 3.76], p=<0.001, respectively). On the other hand, COVID-19 patients had a higher platelet/lymphocyte ratio (OR 1.79 [1.34, 2.37], p<0.001). The white blood cell differential fluorescence (WDF) scattergram results revealed differences in the distribution of cell clusters between COVID-19 and non-COVID-19 patients, as illustrated in Fig. 2.
.")
 is shown on the X-axes and side fluorescence (SFL) on the Y-axes.")
A weighted multivariate prediction model was developed to identify SARS-CoV-2 positive status (Table 3). Lower NE-X, NE-WY, LY-Z, LY-WY, MO-WX, MO-WY, and MO-Z values as well as NLR were related to COVID-19 etiology. The variables most strongly related to COVID-19 pneumonia were NE-WY, LY-WY, and MO-WX. This model showed good discrimination and calibration with an AUC (95% CI) of 0.819 (0.790, 0.846). No multicollinearity was present in this model (all VIF values ranged from 1.03 (NE-X) to 1.18 (NE-WY) as well as all correlation were weak). The multivariate model was compared with another one that included CRP and PCT, with an AUC value of 0.823 (0.800, 0.855) (Supplementary Table 3). Results derived from the comparison of the models indicated that differences were not statistically significant (p=0.18).
Multivariate prediction model for identifying SARS-CoV-2 positive status in the internal derivation sample (n=1065).
| Model 1 | ||||
|---|---|---|---|---|
| Beta (s.e.) | OR (95% CI) | p-Value | Weight | |
| NE-X≤153 | 0.64 (0.17) | 1.90 (1.35, 2.67) | <0.001 | 3 |
| NE-WY≤645.5 | 1.27 (0.18) | 3.55 (2.49, 5.06) | <0.001 | 6 |
| LY-Z≤59.5 | 0.65 (0.20) | 1.91 (1.30, 2.81) | 0.001 | 3 |
| LY-WY≤835.9 | 1.23 (0.17) | 3.41 (2.45, 4.73) | <0.001 | 5 |
| MO-WX≤246 | 0.72 (0.18) | 2.05 (1.45, 2.92) | <0.001 | 3 |
| MO-WY≤667.5 | 1.13 (0.17) | 3.08 (2.20, 4.32) | <0.001 | 5 |
| MO-Z≤68.5 | 0.73 (0.18) | 2.08 (1.45, 2.97) | <0.001 | 3 |
| NLR≤9 | 0.47 (0.17) | 1.61 (1.14, 2.26) | 0.007 | 2 |
| AUC (95% CI)*Hosmer–Lemeshow test | 0.819 (0.790, 0.846) | 0.56 | ||
AUC, area under the receiver operating characteristic curve; NLR, neutrophil-to-lymphocyte ratio.
In addition, a risk score based on three different groups was developed both in the derivation and validation sets, categorized as low (0–7 points), moderate (8–16 points) and high (≥17 points) and showing an AUC value of 0.777 (0.726, 0.825) (Table 4). Additionally, adjusted (by sex, age, Charlson Comorbidity Index and CURB-65 score) analysis was performed in the validation set.
Risk groups in the derivation and validation samples (n=1065 and n=717 respectively).
| Derivation sample | Validation sample | |||||||
|---|---|---|---|---|---|---|---|---|
| Unadjusted analysis | Adjusted analysis** | |||||||
| No of events/total | OR (95% CI) | p-Value | No of events/total | OR (95% CI) | p-Value | OR (95% CI) | p-Value | |
| Continuous risk score** | – | 1.25 (1.21, 1.29) | <0.001 | – | 1.22 (1.18, 1.27) | <0.001 | 1.23 (1.17, 1.29) | <0.001 |
| AUC (95% CI) | 0.814 (0.784, 0.843) | 0.783 (0.742, 0.823) | 0.806 (0.757, 0.854) | |||||
| Hosmer–Lemeshow test | 0.83 | 0.19 | 0.65 | |||||
| Risk groups | ||||||||
| 0–7 | 17/83 (20.48) | Reference | 11/47 (23.40) | Reference | Reference | |||
| 8–16 | 169/297 (56.90) | 5.13 (2.87, 9.16) | <0.001 | 121/204 (59.31) | 4.77 (2.30, 9.91) | <0.001 | 4.87 (2.22, 10.69) | <0.001 |
| ≥17 | 605/685 (88.32) | 29.36 (16.41, 52.54) | <0.001 | 410/466 (87.98) | 23.96 (11.54, 49.76) | <0.001 | 25.04(10.75,58.32) | <0.001 |
| AUC (95% CI)* | 0.757 (0.725, 0.789) | 0.727 (0.688,0.764) | 0.777 (0.726, 0.826) | |||||
| Hosmer–Lemeshow test | 0.99 | 0.99 | 0.73 | |||||
AUC, area under the receiver operating characteristic curve.
Finally, a reduced model was developed including NE-WY, LY-WY and MO-WY with an AUC (95%) of 0.758 (0.725,0.790) (Supplementary Table 4). Risk groups of the reduced model is shown in Supplementary Table 5. Original model showed significantly higher predictive accuracy (AUC (95%) 0.819 (0.790, 0.846) vs 0.758 (0.725, 0.790), respectively, p<0.001)
DiscussionThe present study highlights the utility of commonly used white blood cell analysis to distinguish between pneumonia due to COVID-19 from pneumonia of other etiologies. Moreover, NLR and abnormalities in white blood cell morphology assessed based on a few cell population data values were able to accurately identify COVID-19 etiology in these patients over a long study period including different waves of the pandemic. In addition, current systemic inflammation biomarkers were not able to improve the predictive ability.
Complete blood count and differential white cell count have been widely studied among patients with SARS-CoV-2 infection.17 Both lymphopenia and neutrophilia have been reported in patients with COVID-19.18,19 In relation to this, several laboratory predictors have been explored for assessing disease severity. A recent meta-analysis identified high white blood cell count and low lymphocyte and platelet counts as markers for progression to critical illness.20 Likewise, high NLR has been positively associated with higher mortality in these patients.21–23 In our results, NLR was associated with the presence of SARS-CoV-2 infection.
Alterations in white blood cell morphology like granularity, volume, and nucleic acid/protein content (size, shape and composition) have been observed in response to stimuli, such as infections, and may offer valuable information on the cells’ state of activation and functional activity.24 Activated cells can be distinguished morphologically from resting ones by various features, i.e., nucleic acid content and volume. Atypical lymphocytes circulating in blood have been reported in COVID-19 patients.25
Little is known about the utility of differential white cell count and cell population data to distinguish between COVID-19 and other forms of CAP. Our data suggest that the straightforward evaluation of neutrophil activation can identify COVID-19 in patients with CAP in a way that is both easy and inexpensive. In a retrospective study, Dai et al. constructed a machine learning model that was able to promptly distinguish COVID-19 from other forms of CAP.26 Similarly, an Italian group reported basophil and eosinophil optimal cut-off values that could rule out COVID-19 in patients with CAP.27 These authors focused on the ability of high values to exclude SARS-CoV-2 infection, but below proposed cut-offs, the performance to detect the disease decreased considerably.
The COVID-19 pandemic has exposed weaknesses in many health systems, even those previously considered resilient, and exacted a serious economic toll. In this context, it is crucial to ensure rational use of tests both now and in possible future waves. Advantages of the approach we propose include the fact that CPD and differential white cell analysis are easy to perform avoiding unnecessary costs. The drawback to the use of CPD is that these are research parameters which are complex to explain to clinicians and this is why we have developed a score rather than proposing the use of numerical values from CPD. Actually, the model that included CRP and PCT, which would be more complex and expensive to obtain, did not show better accuracy. Additionally, we developed a short risk score model with just three CPD features, easier to use but with less predictive ability than the longer one.
Our study has certain strengths: first, its prospective and multicenter design; second, the large sample size including cases from different waves of the COVID-19 pandemic; third, the analysis of coinfection; and finally, the performance of comparisons with current systemic biomarkers. On the other hand, this study has some limitations. In particular, a Sysmex XN analyzer is required to perform the analysis; however, this method is used frequently, Sysmex being the leader in the market for this type of laboratory equipment in Europe. Further research is required focusing on children, and less severe and asymptomatic patients as well as validating these data in an external cohort.
In conclusion, new peripheral blood biomarkers can help determine the etiology of CAP in a fast and inexpensive way. In a future lower incidence scenario, this could provide a useful tool, reducing the number of PCR tests performed, and providing a rapid and inexpensive diagnostic approach which could lead to faster initiation of treatment and instigation of preventive measures to reduce the risk of transmission.
Authors’ contributionsAU and PPE contributed to the study design, data collection and data interpretation. AU wrote the manuscript. AU, PPE and EU took responsibility for study design, data integrity review, editing and approval the final version. UA carried out data analysis and review the manuscript. JMQ contributed to the study design, review and approval the final version. MI, CRM, CP, CS, MJLG and PS contributed substantially to acquisition and interpretation of data. All authors reviewed critically the manuscript. LEUCOCAP STUDY GROUP contributed to the data collection, data interpretation, review, editing and approval the fnal version.
Access to dataPlease contact the first author for data requests.
FundingThis work was supported in part by grant 2018111033 from the Basque Country Health Department and grant 2019/968 from the Spanish Pulmonology and Thoracic Surgery Society.
Conflict of interestAll authors have nothing to declare.
Authors would like to thank Ideas Need Communicating Language Services for improving the use of English in the manuscript.
Ane Uranga, Amaia Artaraz, Aitor Ballaz, Sandra Dorado, Silvia Pascual (Department of Pneumology, Universitary Hospital of Galdakao-Usansolo, Galdakao, Spain), Urko Aguirre, Jose María Quintana, Ane Villanueva (Osakidetza Basque Health Service, Galdakao-Usansolo University Hospital, Research Unit, Galdakao, Spain), María Jose Lopez de Goicoechea (Department of Microbiology, Universitary Hospital of Galdakao-Usansolo, Galdakao, Spain), Carmen Mar, Eloisa Urrechaga, Cristina Ponga (Laboratory, Universitary Hospital of Galdakao-Usansolo, Galdakao, Spain) Ignacio Arriaga, Maider Intxausti, (Department of Pneumology, Universitary Hospital of Basurto, Bilbao, Spain), Domingo Fernandez (Department of Microbiology, Universitary Hospital of basurto, Bilbao, Spain), Itziar Benito (Laboratoty, Universitary Hospital of basurto, Bilbao, Spain), Carlos Ruiz-Martinez, Javier Ugeda (Department of Pneumology, Universitary Hospital of San Pedro Logroño, La Rioja, Spain), Pilar Sanz, Ivan Bernardo (Department of Biomedical Diagnostics, Universitary Hospital of San Pedro Logroño, La Rioja, Spain), Pedro Pablo España (Department of Pneumology, Universitary Hospital of Galdakao-Usansolo, Galdakao, Spain).