
Asthma is the most common chronic respiratory disease, affecting an estimated 262 million people worldwide and associated with several comorbidities whose prevalence have increased in recent years.1 Although the broader implications of asthma in the development of cancer have been of interest for many years, evidence regarding the risk of cancer development after asthma diagnosis is controversial and inconclusive. For instance, a Korean population-based cohort showed that asthma increased the risk of several cancer,2 but other epidemiological studies suggested that asthma decreased the overall risk of cancer.3 Conflicting observations may be from small sample sizes, inadequate adjustment for confounding factors that could affect cancer development, use of cross-sectional or case–control designs, or focus on specific cancer types. For example, traffic-related air pollution has been related to the development of a wide variety of cancers in adults and also has been found to be a risk factor for the development of adult-onset asthma. Pollutants vary by geographic location, and individuals living closer to major roadways may be at a higher risk for both asthma and cancer. Due to the limitation of observational design, it remains unclear if there is a true causal relationship between asthma itself and cancer risks. Mendelian randomization (MR) has emerged as a powerful tool to evaluate causal relationships between exposures and outcomes using genetic variants as instrumental variables. MR leverages the principle of genetic inheritance and random assortment of alleles during gamete formation to help identify causal effects. This method can provide valuable insights into the potential causal relationship between asthma and cancer risk, minimizing biases commonly encountered in observational studies. Thus, the present study aimed to explore the relationship between asthma and cancer risk using the MR method, identifying potential areas of future research.
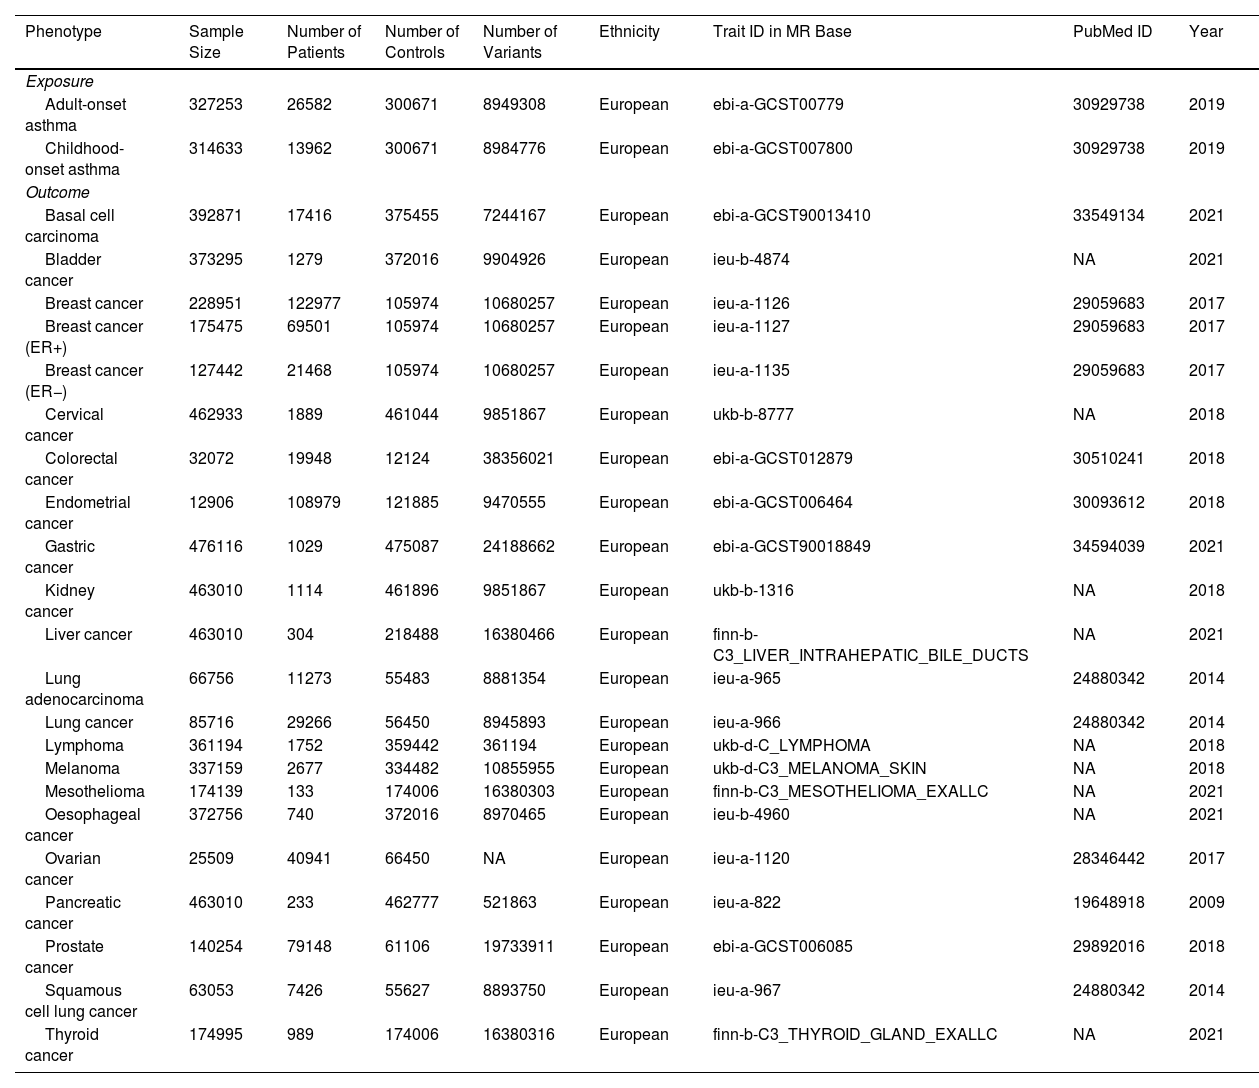
To meticulously adhere to these principles, we employed four criteria for instrumental variables (IVs) selection. Firstly, we obtained SNPs from existing genome-wide association studies (GWASs) that demonstrated a substantial and consistent correlation with asthma and cancers (p<5×10⁻⁸). Subsequently, we performed linkage disequilibrium (LD) clumping analysis at an R2<0.001 and 10,000kb window to preserve the SNPs that were most robustly related to asthma. Thirdly, to address potential pleiotropic effects, we performed a comprehensive analysis utilizing the PhenoScanner database (http://www.phenoscanner.medschl.cam.ac.uk/). Lastly, we eliminated palindromic SNPs to mitigate potential pleiotropic effects. We extracted genetic variants regarding childhood-onset and adult-onset asthma from a study enrolling 314,633 and 327,253 participants of European descent from the UK Biobank, respectively (Table 1). Other large-scale GWASs were used to obtain 18 specific-site cancer-related SNPs (Table 1). The main MR results were obtained through the utilization of the inverse variance weighted (IVW) method. To ensure the reliability of the findings, the weighted median and MR-Egger approaches were employed, each offering distinct advantages and assumptions. The results of the MR analysis were reported as odds ratios (ORs) with corresponding 95% confidence intervals (CIs). To assess potential pleiotropic effects, we conducted the MR-PRESSO test. Considering the extensive scope of our MR analyses, which encompassed 22 unique cancer subtypes, we deemed the statistical significance of potential associations to be contingent upon the p-value adjustment through the Bonferroni correction, falling within the range of 0.05–0.0022 (calculated as 0.05 divided by 22). Therefore, a p-value below 0.05 was considered indicative of a significant causal association, while results within the range of p-values from 0.05 to 0.0022 suggested a suggestive causality. All statistical analyses were performed using R (Version 4.2.0) with the TwosampleMR package.
Details of GWASs Analyzed in the Present MR Analyses.
| Phenotype | Sample Size | Number of Patients | Number of Controls | Number of Variants | Ethnicity | Trait ID in MR Base | PubMed ID | Year |
|---|---|---|---|---|---|---|---|---|
| Exposure | ||||||||
| Adult-onset asthma | 327253 | 26582 | 300671 | 8949308 | European | ebi-a-GCST00779 | 30929738 | 2019 |
| Childhood-onset asthma | 314633 | 13962 | 300671 | 8984776 | European | ebi-a-GCST007800 | 30929738 | 2019 |
| Outcome | ||||||||
| Basal cell carcinoma | 392871 | 17416 | 375455 | 7244167 | European | ebi-a-GCST90013410 | 33549134 | 2021 |
| Bladder cancer | 373295 | 1279 | 372016 | 9904926 | European | ieu-b-4874 | NA | 2021 |
| Breast cancer | 228951 | 122977 | 105974 | 10680257 | European | ieu-a-1126 | 29059683 | 2017 |
| Breast cancer (ER+) | 175475 | 69501 | 105974 | 10680257 | European | ieu-a-1127 | 29059683 | 2017 |
| Breast cancer (ER−) | 127442 | 21468 | 105974 | 10680257 | European | ieu-a-1135 | 29059683 | 2017 |
| Cervical cancer | 462933 | 1889 | 461044 | 9851867 | European | ukb-b-8777 | NA | 2018 |
| Colorectal cancer | 32072 | 19948 | 12124 | 38356021 | European | ebi-a-GCST012879 | 30510241 | 2018 |
| Endometrial cancer | 12906 | 108979 | 121885 | 9470555 | European | ebi-a-GCST006464 | 30093612 | 2018 |
| Gastric cancer | 476116 | 1029 | 475087 | 24188662 | European | ebi-a-GCST90018849 | 34594039 | 2021 |
| Kidney cancer | 463010 | 1114 | 461896 | 9851867 | European | ukb-b-1316 | NA | 2018 |
| Liver cancer | 463010 | 304 | 218488 | 16380466 | European | finn-b-C3_LIVER_INTRAHEPATIC_BILE_DUCTS | NA | 2021 |
| Lung adenocarcinoma | 66756 | 11273 | 55483 | 8881354 | European | ieu-a-965 | 24880342 | 2014 |
| Lung cancer | 85716 | 29266 | 56450 | 8945893 | European | ieu-a-966 | 24880342 | 2014 |
| Lymphoma | 361194 | 1752 | 359442 | 361194 | European | ukb-d-C_LYMPHOMA | NA | 2018 |
| Melanoma | 337159 | 2677 | 334482 | 10855955 | European | ukb-d-C3_MELANOMA_SKIN | NA | 2018 |
| Mesothelioma | 174139 | 133 | 174006 | 16380303 | European | finn-b-C3_MESOTHELIOMA_EXALLC | NA | 2021 |
| Oesophageal cancer | 372756 | 740 | 372016 | 8970465 | European | ieu-b-4960 | NA | 2021 |
| Ovarian cancer | 25509 | 40941 | 66450 | NA | European | ieu-a-1120 | 28346442 | 2017 |
| Pancreatic cancer | 463010 | 233 | 462777 | 521863 | European | ieu-a-822 | 19648918 | 2009 |
| Prostate cancer | 140254 | 79148 | 61106 | 19733911 | European | ebi-a-GCST006085 | 29892016 | 2018 |
| Squamous cell lung cancer | 63053 | 7426 | 55627 | 8893750 | European | ieu-a-967 | 24880342 | 2014 |
| Thyroid cancer | 174995 | 989 | 174006 | 16380316 | European | finn-b-C3_THYROID_GLAND_EXALLC | NA | 2021 |
MR: Mendelian randomization; GWAS: genome-wide association studies; NA: not available.
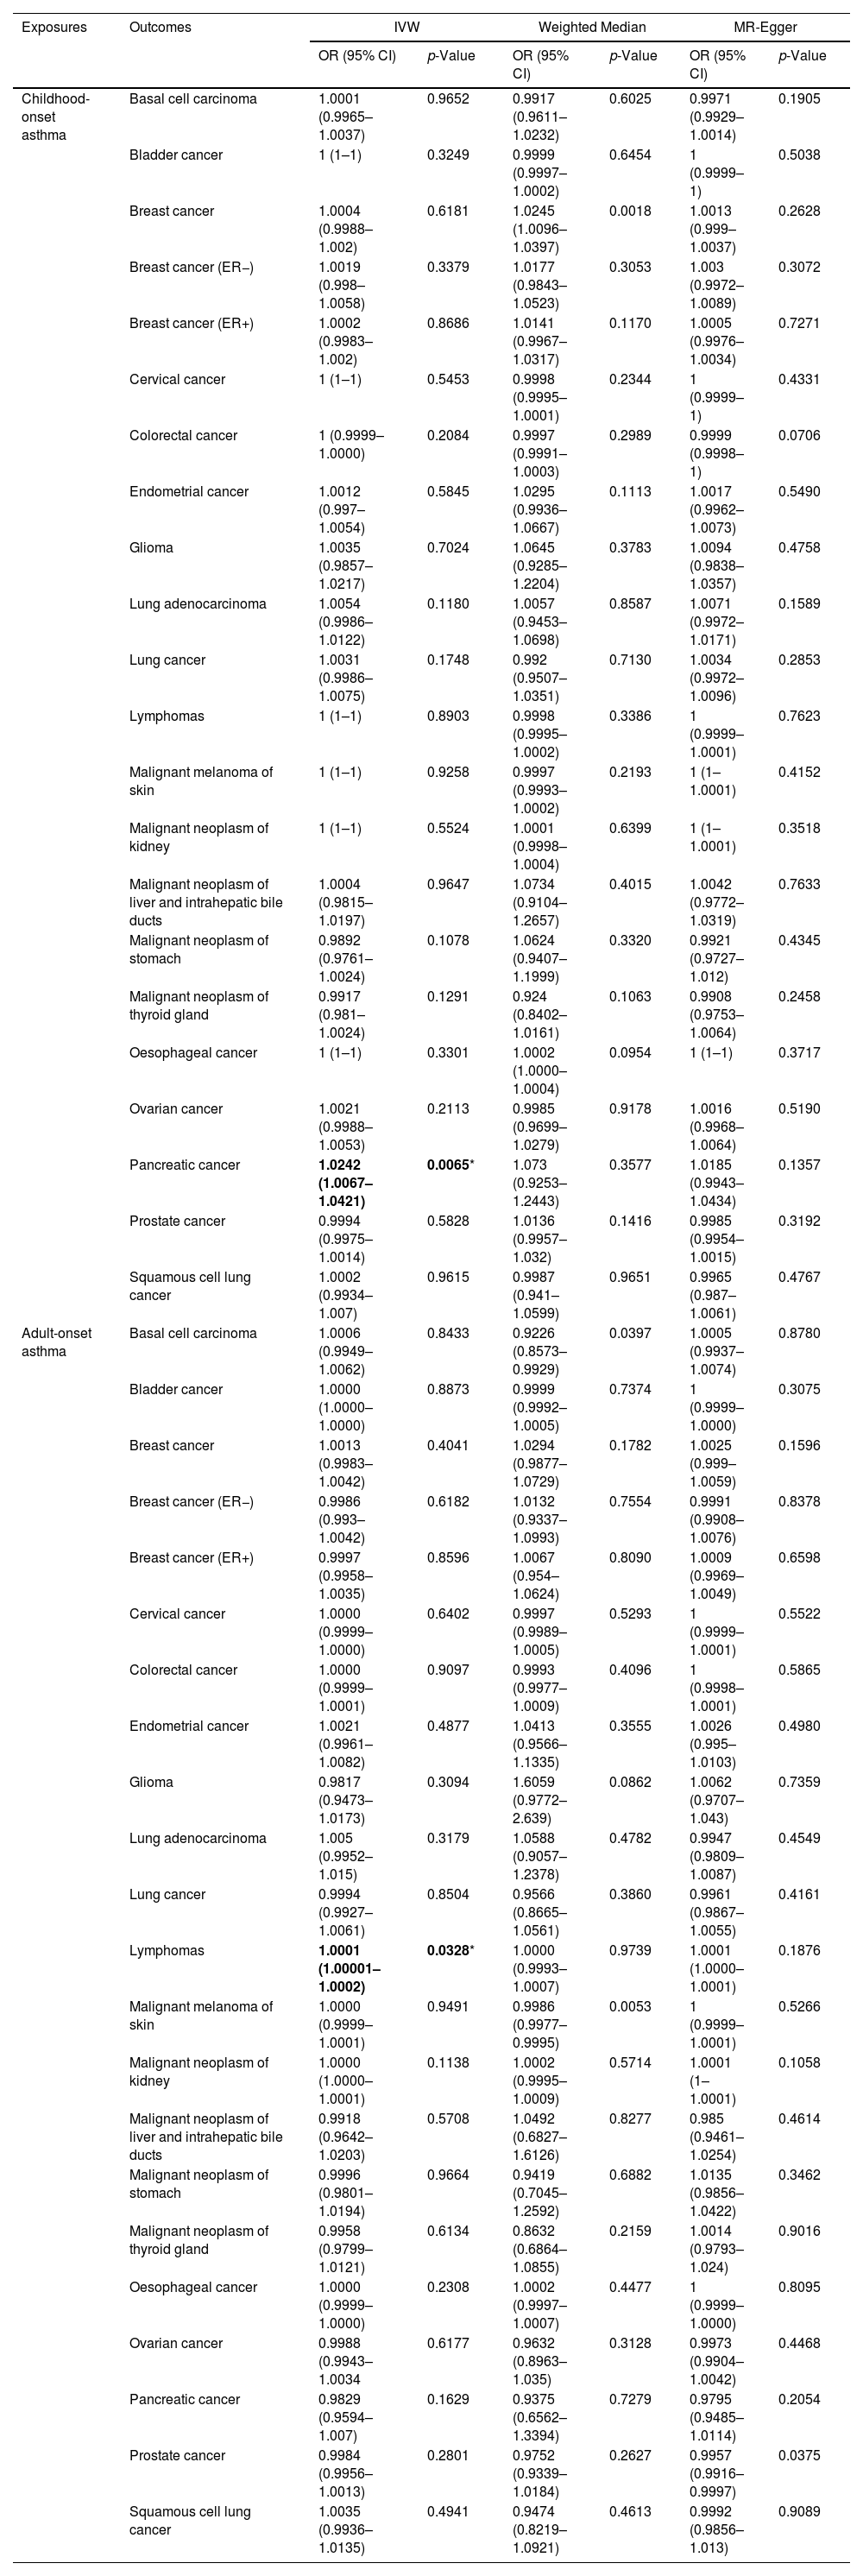
Table 2 illustrates the results of our IV estimation in the present study. The results of our MR analyses revealed a positive association between asthma (childhood onset) and pancreatic cancer (ORIVW: 1.0242, 95% CI: 1.0067–1.0421, p=0.0064) (Table 2). Besides, the MR-PRESSO Global tests (p=0.455) further validated the IVW results and revealed no obvious heterogeneity. However, no causality between asthma (childhood onset) and other cancers was observed (Table 2). Besides, the risks of lymphomas were higher in asthma (adult onset) patients when compared to the general population (ORIVW: 1.0001, 95% CI: 1.00001–1.0002, p=0.033) (Table 2). The MR-PRESSO Global tests (p=0.715) further validated the IVW results and revealed no obvious heterogeneity. However, no causality between asthma (adult onset) and other cancers was observed (Table 2).
Causality of the Risk for Asthma and Cancers.
| Exposures | Outcomes | IVW | Weighted Median | MR-Egger | |||
|---|---|---|---|---|---|---|---|
| OR (95% CI) | p-Value | OR (95% CI) | p-Value | OR (95% CI) | p-Value | ||
| Childhood-onset asthma | Basal cell carcinoma | 1.0001 (0.9965–1.0037) | 0.9652 | 0.9917 (0.9611–1.0232) | 0.6025 | 0.9971 (0.9929–1.0014) | 0.1905 |
| Bladder cancer | 1 (1–1) | 0.3249 | 0.9999 (0.9997–1.0002) | 0.6454 | 1 (0.9999–1) | 0.5038 | |
| Breast cancer | 1.0004 (0.9988–1.002) | 0.6181 | 1.0245 (1.0096–1.0397) | 0.0018 | 1.0013 (0.999–1.0037) | 0.2628 | |
| Breast cancer (ER−) | 1.0019 (0.998–1.0058) | 0.3379 | 1.0177 (0.9843–1.0523) | 0.3053 | 1.003 (0.9972–1.0089) | 0.3072 | |
| Breast cancer (ER+) | 1.0002 (0.9983–1.002) | 0.8686 | 1.0141 (0.9967–1.0317) | 0.1170 | 1.0005 (0.9976–1.0034) | 0.7271 | |
| Cervical cancer | 1 (1–1) | 0.5453 | 0.9998 (0.9995–1.0001) | 0.2344 | 1 (0.9999–1) | 0.4331 | |
| Colorectal cancer | 1 (0.9999–1.0000) | 0.2084 | 0.9997 (0.9991–1.0003) | 0.2989 | 0.9999 (0.9998–1) | 0.0706 | |
| Endometrial cancer | 1.0012 (0.997–1.0054) | 0.5845 | 1.0295 (0.9936–1.0667) | 0.1113 | 1.0017 (0.9962–1.0073) | 0.5490 | |
| Glioma | 1.0035 (0.9857–1.0217) | 0.7024 | 1.0645 (0.9285–1.2204) | 0.3783 | 1.0094 (0.9838–1.0357) | 0.4758 | |
| Lung adenocarcinoma | 1.0054 (0.9986–1.0122) | 0.1180 | 1.0057 (0.9453–1.0698) | 0.8587 | 1.0071 (0.9972–1.0171) | 0.1589 | |
| Lung cancer | 1.0031 (0.9986–1.0075) | 0.1748 | 0.992 (0.9507–1.0351) | 0.7130 | 1.0034 (0.9972–1.0096) | 0.2853 | |
| Lymphomas | 1 (1–1) | 0.8903 | 0.9998 (0.9995–1.0002) | 0.3386 | 1 (0.9999–1.0001) | 0.7623 | |
| Malignant melanoma of skin | 1 (1–1) | 0.9258 | 0.9997 (0.9993–1.0002) | 0.2193 | 1 (1–1.0001) | 0.4152 | |
| Malignant neoplasm of kidney | 1 (1–1) | 0.5524 | 1.0001 (0.9998–1.0004) | 0.6399 | 1 (1–1.0001) | 0.3518 | |
| Malignant neoplasm of liver and intrahepatic bile ducts | 1.0004 (0.9815–1.0197) | 0.9647 | 1.0734 (0.9104–1.2657) | 0.4015 | 1.0042 (0.9772–1.0319) | 0.7633 | |
| Malignant neoplasm of stomach | 0.9892 (0.9761–1.0024) | 0.1078 | 1.0624 (0.9407–1.1999) | 0.3320 | 0.9921 (0.9727–1.012) | 0.4345 | |
| Malignant neoplasm of thyroid gland | 0.9917 (0.981–1.0024) | 0.1291 | 0.924 (0.8402–1.0161) | 0.1063 | 0.9908 (0.9753–1.0064) | 0.2458 | |
| Oesophageal cancer | 1 (1–1) | 0.3301 | 1.0002 (1.0000–1.0004) | 0.0954 | 1 (1–1) | 0.3717 | |
| Ovarian cancer | 1.0021 (0.9988–1.0053) | 0.2113 | 0.9985 (0.9699–1.0279) | 0.9178 | 1.0016 (0.9968–1.0064) | 0.5190 | |
| Pancreatic cancer | 1.0242 (1.0067–1.0421) | 0.0065* | 1.073 (0.9253–1.2443) | 0.3577 | 1.0185 (0.9943–1.0434) | 0.1357 | |
| Prostate cancer | 0.9994 (0.9975–1.0014) | 0.5828 | 1.0136 (0.9957–1.032) | 0.1416 | 0.9985 (0.9954–1.0015) | 0.3192 | |
| Squamous cell lung cancer | 1.0002 (0.9934–1.007) | 0.9615 | 0.9987 (0.941–1.0599) | 0.9651 | 0.9965 (0.987–1.0061) | 0.4767 | |
| Adult-onset asthma | Basal cell carcinoma | 1.0006 (0.9949–1.0062) | 0.8433 | 0.9226 (0.8573–0.9929) | 0.0397 | 1.0005 (0.9937–1.0074) | 0.8780 |
| Bladder cancer | 1.0000 (1.0000–1.0000) | 0.8873 | 0.9999 (0.9992–1.0005) | 0.7374 | 1 (0.9999–1.0000) | 0.3075 | |
| Breast cancer | 1.0013 (0.9983–1.0042) | 0.4041 | 1.0294 (0.9877–1.0729) | 0.1782 | 1.0025 (0.999–1.0059) | 0.1596 | |
| Breast cancer (ER−) | 0.9986 (0.993–1.0042) | 0.6182 | 1.0132 (0.9337–1.0993) | 0.7554 | 0.9991 (0.9908–1.0076) | 0.8378 | |
| Breast cancer (ER+) | 0.9997 (0.9958–1.0035) | 0.8596 | 1.0067 (0.954–1.0624) | 0.8090 | 1.0009 (0.9969–1.0049) | 0.6598 | |
| Cervical cancer | 1.0000 (0.9999–1.0000) | 0.6402 | 0.9997 (0.9989–1.0005) | 0.5293 | 1 (0.9999–1.0001) | 0.5522 | |
| Colorectal cancer | 1.0000 (0.9999–1.0001) | 0.9097 | 0.9993 (0.9977–1.0009) | 0.4096 | 1 (0.9998–1.0001) | 0.5865 | |
| Endometrial cancer | 1.0021 (0.9961–1.0082) | 0.4877 | 1.0413 (0.9566–1.1335) | 0.3555 | 1.0026 (0.995–1.0103) | 0.4980 | |
| Glioma | 0.9817 (0.9473–1.0173) | 0.3094 | 1.6059 (0.9772–2.639) | 0.0862 | 1.0062 (0.9707–1.043) | 0.7359 | |
| Lung adenocarcinoma | 1.005 (0.9952–1.015) | 0.3179 | 1.0588 (0.9057–1.2378) | 0.4782 | 0.9947 (0.9809–1.0087) | 0.4549 | |
| Lung cancer | 0.9994 (0.9927–1.0061) | 0.8504 | 0.9566 (0.8665–1.0561) | 0.3860 | 0.9961 (0.9867–1.0055) | 0.4161 | |
| Lymphomas | 1.0001 (1.00001–1.0002) | 0.0328* | 1.0000 (0.9993–1.0007) | 0.9739 | 1.0001 (1.0000–1.0001) | 0.1876 | |
| Malignant melanoma of skin | 1.0000 (0.9999–1.0001) | 0.9491 | 0.9986 (0.9977–0.9995) | 0.0053 | 1 (0.9999–1.0001) | 0.5266 | |
| Malignant neoplasm of kidney | 1.0000 (1.0000–1.0001) | 0.1138 | 1.0002 (0.9995–1.0009) | 0.5714 | 1.0001 (1–1.0001) | 0.1058 | |
| Malignant neoplasm of liver and intrahepatic bile ducts | 0.9918 (0.9642–1.0203) | 0.5708 | 1.0492 (0.6827–1.6126) | 0.8277 | 0.985 (0.9461–1.0254) | 0.4614 | |
| Malignant neoplasm of stomach | 0.9996 (0.9801–1.0194) | 0.9664 | 0.9419 (0.7045–1.2592) | 0.6882 | 1.0135 (0.9856–1.0422) | 0.3462 | |
| Malignant neoplasm of thyroid gland | 0.9958 (0.9799–1.0121) | 0.6134 | 0.8632 (0.6864–1.0855) | 0.2159 | 1.0014 (0.9793–1.024) | 0.9016 | |
| Oesophageal cancer | 1.0000 (0.9999–1.0000) | 0.2308 | 1.0002 (0.9997–1.0007) | 0.4477 | 1 (0.9999–1.0000) | 0.8095 | |
| Ovarian cancer | 0.9988 (0.9943–1.0034 | 0.6177 | 0.9632 (0.8963–1.035) | 0.3128 | 0.9973 (0.9904–1.0042) | 0.4468 | |
| Pancreatic cancer | 0.9829 (0.9594–1.007) | 0.1629 | 0.9375 (0.6562–1.3394) | 0.7279 | 0.9795 (0.9485–1.0114) | 0.2054 | |
| Prostate cancer | 0.9984 (0.9956–1.0013) | 0.2801 | 0.9752 (0.9339–1.0184) | 0.2627 | 0.9957 (0.9916–0.9997) | 0.0375 | |
| Squamous cell lung cancer | 1.0035 (0.9936–1.0135) | 0.4941 | 0.9474 (0.8219–1.0921) | 0.4613 | 0.9992 (0.9856–1.013) | 0.9089 | |
Asthma, being a chronic inflammatory ailment, is integral in the process of cancer development as inflammation takes precedence. Previous MR studies have endeavored to explore the underlying biological mechanisms linking intrinsic immunity and cancer, but have yielded no evidence suggesting a causal relationship between asthma and the risk of breast,4 prostate,4 or lung cancer.5 It has been observed that airway inflammation in asthmatic individuals may exert an influence on the overall inflammatory response in other bodily regions, thereby being potentially linked to pancreatic cancer development. Consequently, the prevalence of pancreatic cancer is expected to be higher in asthma cases that manifest during childhood due to the prolonged impact of inflammation. Our research findings further corroborate this notion. Regarding the cellular mechanisms involved, STAT6, a constituent of a protein family encompassing seven analogous proteins, assumes a principal role.6 Activation of STAT6 is primarily prompted by interleukins IL-4 and IL-13, thereby playing a vital role in the initiation of T helper type 2 immune response. The involvement of STAT6 has been established in various allergic conditions, including asthma, while also playing a part in regulating the tumor microenvironment. Perturbations in the STAT6 pathway have been associated with the progress and onset of lymphomas. In parallel, our results indicate that asthmatic individuals are more prone to developing lymphomas when compared to the general population lacking asthma, thereby aligning with our preceding findings. In summary, our investigation demonstrates a positive association between childhood-onset asthma and the incidence of pancreatic cancer, along with a heightened risk of lymphomas among asthma patients, particularly those with adult-onset asthma, when compared to the broader population. However, it is crucial to highlight the limitations of the present study. Despite both the current investigation and previous MR research5 indicating no causal link between asthma and the risk of lung cancer, further studies are warranted due to the significant implications for public health.7 Moreover, several pertinent confounding factors related to asthma were not accounted for in the current MR study. Specifically, the treatment of asthma, such as corticosteroids, may confer an impact on the onset of lung cancer.8 Additionally, chronic activation pathways in the lung microenvironment induced by house dust mites, an etiological factor of asthma, may exert a tumorigenic effect.9 Therefore, additional research is necessary to establish causality and elucidate potential underlying mechanisms.
Ethical ApprovalNo ethical approval and written consent were needed for the secondary analysis of public data.
Authors’ ContributionsWenjie Li and Peixin Dong: conceptualization, methodology, data curation, software and writing – review & editing. Wei Wang: funding acquisition, project administration, supervision and validation. The work reported in the paper has been performed by the authors, unless clearly specified in the text.
).
FundingThis work was supported by the National Natural Science Foundation of China Grant (82172642 to W. Wang) and Natural Science Foundation of Guangdong Province (2021A1515011683 to W. Wang).
Conflicts of InterestNone declared.
We appreciate the work of the open GWAS project (https://gwas.mrcieu.ac.uk/).


