


Lung cancer is the leading cause of cancer death and the second most common cancer in both sexes worldwide, with tobacco being its main risk factor. The aim of this study is to establish the temporal relationship between smoking prevalence and lung cancer mortality in Spain.
MethodsTo model the time dependence between smoking prevalence and lung cancer mortality, a distributed lag non-linear model was applied adjusting for sex, age, year of mortality and population at risk. Smoking prevalence data from 1991-2020 were used. Considering a maximum lag of 25 years, mortality data from 2016-2020 were included. The effect of prevalence on mortality for each lag is presented in terms of relative risk (RR). To identify the lag at which smoking prevalence has the greatest effect on mortality, the RR of the different lags were compared.
ResultsThe optimal lag observed between smoking prevalence and lung cancer mortality in Spain was 15 years. The maximum RR was 2.9 (95%CI: 2.0-4.3) for a prevalence of 71% and a 15-year lag. The RR was 1.8 for a prevalence of 33%, an approximate median value between 1991-2020, and a 15-year lag.
ConclusionsIn Spain, lung cancer mortality is affected by smoking prevalence 15 years prior. Knowing the evolution of the smoking prevalence series in a country and establishing a lag time is essential to predict how lung cancer incidence and mortality will evolve.

According to GLOBOCAN 2020 data,1 lung cancer is, in both sexes, the type of cancer that causes the most deaths (18.0%) and the second in incidence (11.4%) worldwide. One-year survival is approximately 42%, and at five years it drops to 15%.2 Tobacco use has been causally associated with lung cancer since 1964,3 being its main risk factor. Tobacco consumption is responsible for almost 90% of lung cancers in men and 70-80% in women. Smokers may have up to 27 times the risk of developing lung cancer compared to non-smokers, depending on age, duration and intensity of consumption.4
In Spain, lung cancer is the fourth cancer with the highest incidence in both sexes, after colorectal, prostate and breast cancer, and the first in mortality.5 Although there are certain clinical and genetic characteristics that may affect to a different age at diagnosis, especially in younger cases,6 epidemiological characteristics continue to be the most relevant issue. It is estimated that in Spain, tobacco consumption caused 18,324 deaths from lung cancer in 20167 and 17,842 in 20178 in population aged 35 years and over, representing approximately 85% of all lung cancer deaths. This overall decrease of 2.6% is primarily due to a decrease in mortality in men (15,214 deaths in 2016 vs. 14,816 in 2017), while in women lung cancer attributed to tobacco use remained stable (3,020 deaths in 2016 vs. 3,026 in 2017). These data reflect that, although the peak in smoking prevalence has been reached in both sexes, this peak occurred much earlier in men than in women. For men, the peak prevalence of tobacco use was between 1978-1987.9 The available data do not permit more precision. In women, peak prevalence occurred in 2001.10 This represents a difference of 13-23 years. Lung cancer incidence and observed mortality is beginning to decrease in men. On the other hand, in women, it is expected to continue increasing in the coming years because of their later onset of smoking.
The effect of tobacco consumption on lung cancer incidence is not immediate. The lag time varies depending on the evolution of smoking prevalence, as well as the socioeconomic and health characteristics of the country.11
Since tobacco consumption is responsible for a high percentage of lung cancers in both men and women, knowledge of the evolution of smoking prevalence series and their temporal association with lung cancer could contribute to the prediction of morbidity and mortality from this disease. Thus, the aim of this study is to establish the temporal relationship between smoking prevalence and lung cancer mortality in Spain.
MethodsTo model the time dependence between smoking prevalence and lung cancer mortality, a distributed lag non-linear model was applied adjusting for sex, age group, year of mortality and population at risk. Thirty-year record of prevalence data from 1991 to 2020 was used. Considering a maximum lag of 25 years, the mortality data included comprise the period 2016 to 2020.
Data SourcesLung cancer deaths from 2016 to 2020 by sex and five-year age group (40-44 to 80-84 years) were obtained from the statistics on deaths according to cause of death, available on the website of the National Institute of Statistics (INE).12 Codes C33 Malignant tumour of the trachea and C34 Malignant tumour of the bronchi and lung of the International Classification of Diseases 10th Revision were considered.
The prevalence of tobacco use from 1991 to 2020 by sex and five-year age group (15-19 to 80-84 years) correspond to estimates obtained in a previous study13 using small area methodology. In that study, a multinomial logistic mixed model with random area and time effects was applied. This model included auxiliary information related to tobacco use to accurately estimate the annual prevalence series of smokers, ex-smokers and never smokers by sex and age group for the period 1991-2020.
To appropriately relate smoking prevalence estimates between 1991 and 2020 to lung cancer mortality between 2016 and 2020, each five-year mortality age group was matched to the five-year prevalence age group retrospectively. For instance, deaths in those aged 50-54 years in 2016 were matched to smoking prevalence in those aged 50-54 years in 2016, 45-49 years in 2011, 40-44 years in 2006, and so on down to 25-29 years in 1991.
From the continuous population statistics, available on the INE website,14 reference populations on July 1st by sex and five-year age group for the period 2016-2020 were taken. These populations represent the population at risk.
Statistical AnalysisTo model the temporal relationship between smoking prevalence and lung cancer mortality, the distributed lag non-linear model proposed by Smith et al.,15 was applied.
Distributed lag models allow modelling an observed response at time t in terms of past occurrences of an exposure.16 These models include an additional dimension that specifies the time dependence between the exposure and the response on the lag scale. The aim is to fit a two-dimensional surface as a function of two variables, the exposure and the delay.16 When the effect of exposure on the response, considering the delay, is assumed to be non-linear, we speak of distributed lag non-linear models.
The units of analysis were the i = 18 demographic strata resulting from the combination of the two sexes and the nine mortality age groups (from 40-44 to 80-84 years) at each time t, being t the year of mortality (2016-2020).
The model takes the form:


where Yit represents the number of lung cancer deaths in stratum i and time t; μit is the number of expected lung cancer deaths in stratum i and time t; α is the intercept of the model; Pit is the population at risk by sex and age group at time t; Git is a binary variable representing sex (0: female, 1: male), with η its vector of coefficients; Ait and Oit are categorical fixed-effect variables for age group and year of mortality, respectively, with δ and λ their coefficient vectors; and GitAit is an interaction term between sex and age group, with ν the coefficient vector. Sit,l is the cross-basis matrix for smoking prevalence, with l representing the lag (l =0, 5, 10, 15, 20, 25) and β the coefficient vector. The construction of Sit,l uses one function basis for the smoking prevalence dimension and another for the lag dimension. The function bases are crossed by applying the tensor product. The estimation of the model coefficients is done by maximum likelihood.
The logarithm of the population at risk Pit was considered as the model offset to account for annual variations in population numbers. For Sit,l construction, natural cubic splines with 3 degrees of freedom were considered for both the exposure and the lag function basis. The intercept in the lag function basis was excluded to set deaths to 0 at lag 0. This allows the assumption that the change in the proportion of smokers in the population has no immediate effect on lung cancer mortality. More information on the model can be found elsewhere.15
The effect of smoking prevalence on lung cancer mortality at each lag is presented in terms of relative risk (RR). The reference level of smoking prevalence was established at 0%. Thus, the RR represents the risk of dying from lung cancer as a function of smoking prevalence at a given lag compared to the reference level of 0%. For instance, for a smoking prevalence of 22% and a 5-year lag, an RR=2 would indicate that the current risk of dying from lung cancer in those with a smoking prevalence of 22% five years ago is twice that of those exposed to 0% prevalence five years ago. To identify the lag at which smoking prevalence has the greatest effect on mortality, the RR of the different lags were compared across the range of prevalences.
Statistical analysis was performed with the R package dlnm17 v2.4.7 (Antonio Gasparrini, London, UK).
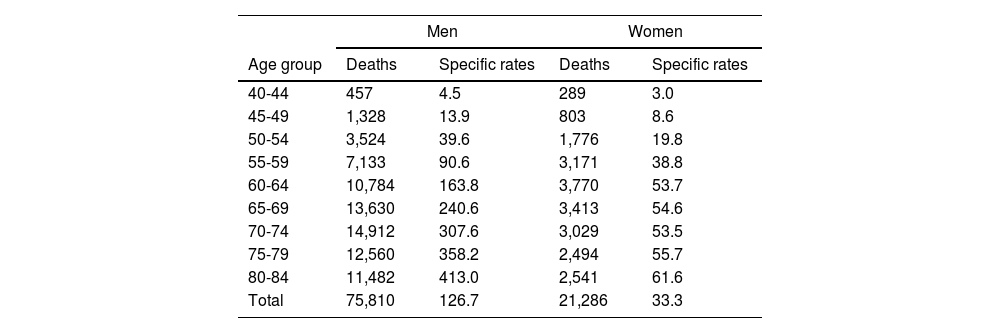
ResultsBetween 2016 and 2020, 97,096 people aged 40-84 years died of lung cancer in Spain, 75,810 men (78,1%) and 21,286 women (21,9%). Table 1 shows the crude and age-specific lung cancer mortality rates by sex from 2016 to 2020. The crude mortality rate was 126.7 deaths per 100,000 men, and 33.3 deaths per 100,000 women.
Age-specific lung cancer mortality rates (per 100,000) by sex in the period 2016-2020 in Spain.
| Men | Women | |||
|---|---|---|---|---|
| Age group | Deaths | Specific rates | Deaths | Specific rates |
| 40-44 | 457 | 4.5 | 289 | 3.0 |
| 45-49 | 1,328 | 13.9 | 803 | 8.6 |
| 50-54 | 3,524 | 39.6 | 1,776 | 19.8 |
| 55-59 | 7,133 | 90.6 | 3,171 | 38.8 |
| 60-64 | 10,784 | 163.8 | 3,770 | 53.7 |
| 65-69 | 13,630 | 240.6 | 3,413 | 54.6 |
| 70-74 | 14,912 | 307.6 | 3,029 | 53.5 |
| 75-79 | 12,560 | 358.2 | 2,494 | 55.7 |
| 80-84 | 11,482 | 413.0 | 2,541 | 61.6 |
| Total | 75,810 | 126.7 | 21,286 | 33.3 |
Figure 1 shows the evolution of the smoking prevalence in Spain by sex and age.13 Each curve corresponds to a year of the period 1991 to 2020. More recent years are in lighter colors. Smoking prevalence ranged from a minimum of 1.6% to a maximum of 71% (Q1=18.3%, Q2=33.4%, Q3=26.6%). For men, the highest smoking prevalence is observed at age 20-30 in all years of the series, peaking at younger ages over time. Prevalence declines with age and over time. In women, smoking prevalence is also highest between ages 20-30 in all years, but the peak prevalence is reached at ages closer to 30 years, especially in more recent years. Prevalence declines with age, but not over time in all ages. Thus, from 45 onwards, smoking prevalence in the later years of the series are higher than those observed in the earlier years.

The distributed lag non-linear model explaining the relationship between smoking prevalence and lung cancer mortality showed a good fit to the data, with an Akaike Information Criterion of 925.9. Furthermore, the residuals of the model meet the assumptions of normality and homocedasticity, as can be seen in Figure S1 of the Supplementary Material. This figure shows the quantile-quantile plot of the scaled residuals obtained by simulation.
Figure 2 plots the three-dimensional surface of the RR values estimated from the model as a function of smoking prevalence between 1991 and 2020 and lag l, with l from 0 to 25 years. The maximum RR was reached at a prevalence of 71% and 15-year lag, being 2.9 (CI95%: 2.0-4.3). That is, for those exposed to a smoking prevalence of 71% 15 years ago, the current risk of dying from lung cancer is 2.9 times higher than if the prevalence 15 years ago had been 0%.
.")
The prevalence-risk curves varied according to the delay (Figure 3). For small (5 or 10 years) or very large (25 years) lags the RR did not exceed 2. The highest RR was observed for lags of 15-20 years. For these lags, the evolution of the curves was very similar for prevalence below 45%. From this value onwards, the 15-year lag curve remained above the 20-year lag curve. For a prevalence of 33%, approximately the median value of smoking prevalence between 1991 and 2020, the RR was 1.1 for the 5-year lag, 1.3 for the 10-year lag, 1.8 for the 15 and 20-year lags, and 1.4 for the 25-year lag.
 curves for lung cancer mortality as a function of smoking prevalence for different lags.")
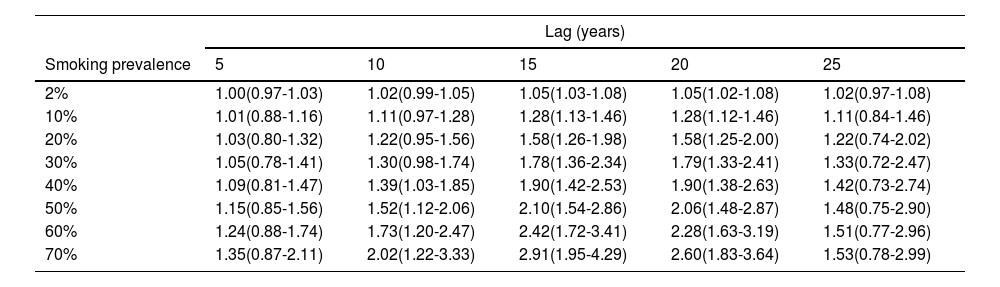
Table 2 shows the RR at each delay for different smoking prevalence values. The risk of dying from lung cancer in smokers compared to the baseline level of 0% increases in the first few lags, peaks between lags 15 and 20, and declines thereafter. For smoking prevalence values above 40%, the RR is slightly higher at lag 15 than at lag 20.
Relative risk (RR) of lung cancer mortality for different increases in smoking prevalence at each lag l,with l =5, 10, 15, 20, 25, and 95% confidence interval.
| Lag (years) | |||||
|---|---|---|---|---|---|
| Smoking prevalence | 5 | 10 | 15 | 20 | 25 |
| 2% | 1.00(0.97-1.03) | 1.02(0.99-1.05) | 1.05(1.03-1.08) | 1.05(1.02-1.08) | 1.02(0.97-1.08) |
| 10% | 1.01(0.88-1.16) | 1.11(0.97-1.28) | 1.28(1.13-1.46) | 1.28(1.12-1.46) | 1.11(0.84-1.46) |
| 20% | 1.03(0.80-1.32) | 1.22(0.95-1.56) | 1.58(1.26-1.98) | 1.58(1.25-2.00) | 1.22(0.74-2.02) |
| 30% | 1.05(0.78-1.41) | 1.30(0.98-1.74) | 1.78(1.36-2.34) | 1.79(1.33-2.41) | 1.33(0.72-2.47) |
| 40% | 1.09(0.81-1.47) | 1.39(1.03-1.85) | 1.90(1.42-2.53) | 1.90(1.38-2.63) | 1.42(0.73-2.74) |
| 50% | 1.15(0.85-1.56) | 1.52(1.12-2.06) | 2.10(1.54-2.86) | 2.06(1.48-2.87) | 1.48(0.75-2.90) |
| 60% | 1.24(0.88-1.74) | 1.73(1.20-2.47) | 2.42(1.72-3.41) | 2.28(1.63-3.19) | 1.51(0.77-2.96) |
| 70% | 1.35(0.87-2.11) | 2.02(1.22-3.33) | 2.91(1.95-4.29) | 2.60(1.83-3.64) | 1.53(0.78-2.99) |
According to our results, the highest effect of smoking prevalence on lung cancer mortality in Spain is at a lag of 15 years. For a smoking prevalence of 33%, approximately the median value in the period 1991 to 2020, the relative risk at 15 years was 1.8.
To date, one study has attempted to establish the time window between tobacco use and lung cancer mortality in Spain.18 The method is based on the calculation of cross-correlations between smoking prevalence series (1940-2011) and lung cancer mortality rates (1980-2013). The estimated lag time was 33 years for men and 32 years for women. This represents a maximum difference with respect to the results obtained in this study of 18 years. The explanation could be due to different factors, such as the smoking prevalence estimates, the time periods considered, or the methodology applied. The authors applied smoking prevalence estimates constructed retrospectively for up to 71 years from three years of surveys. This fact might underestimate prevalence and consequently overestimate the lag. On the other hand, the authors assessed a lag from 0 to 40 years, whereas in our case a maximum lag of 25 years was considered. Finally, these authors applied a statistics such as Pearson's correlation to determine the optimal delay, assuming a linear relationship between smoking prevalence and lung cancer mortality. However, the relationship between prevalence and mortality may not be linear. The distributed lag non-linear model applied in this study allows for this by modelling lung cancer mortality from smoking prevalence and lag together without imposing the linearity constraint, which makes it more flexible.
The lag of 15 years between smoking prevalence and lung cancer mortality estimated here is shorter than the 20-30 that might be expected. However, Smith et al.,15 suggest in their study that this may depend on the initial prevalence of tobacco use as well as its evolution. Other studies worldwide that addressed the issue of establishing a temporal relationship between smoking prevalence and lung cancer incidence or mortality show time lags between 8 and 40 years.19-23 Although the methodology applied differs between studies, these studies highlight the strong influence of socioeconomic characteristics and the evolution of the tobacco epidemic on the estimation of the lag time. The age of initiation, intensity, and duration of consumption, as well as changes in tobacco products, tobacco control policies or histological lung cancer types could affect the estimation of the delay. Thus, a recent study comparing the relationship between smoking prevalence and lung cancer incidence in Canada, Norway, and Sweden, three countries with similar socioeconomic characteristics and social and environmental factors, found differences in the estimated delay for men of up to 8 years (range of lags between 13-21 years). For women, hardly any differences were found, with an estimated lag of 29-32 years.21 For the United States, Shibuya et al.,19 estimated a 25-years lag for both sexes between 1950-1998 using average tar content of cigarettes and per capita tobacco consumption as predictors. Kafle et al.,22 estimated an 8-year lag for both sexes using smoking prevalence data from 1976-2018.
The point in time when smoking prevalence among Spanish men peaked is uncertain. However, in women, a recent study analyzing trends in smoking prevalence in Spain between 1987 and 202010 shows two periods with different trends: the first between 1987 and 2001 with and increasing trend, and the second between 2002 and 2020 with a decreasing trend. This change would place the peak of smoking prevalence in women in 2001. Therefore, and considering the lag estimated in this study, we would expect the peak in lung cancer mortality in women between 2016 and 2021. In this estimate, however, other factors must be considered. One of them is the rate of decline in smoking prevalence, which in women may be too slow to produce significant changes in lung cancer mortality. While between 1987 and 2020 the prevalence of tobacco use in men decreased by 29 percentage points, the decrease in women between 2001 and 2020 was only 4.5 points.10 The other factor is the evolution of prevalence according to age. In the case of men, smoking prevalence has decreased in all age groups since 1987. But this is not the case for women, whose current smoking prevalence from the age of 45 onwards has stabilized or continues to rise.10,13 Thus, neither the peak prevalence of smoking nor lung cancer mortality has yet been reached in women aged 45 years and over, who also account for the majority of lung cancer deaths (Table 1).
This study has several limitations. Firstly, insufficient data were available to estimate the delay for each sex separately. While some studies have found no differences in delay between sexes,18,19,22 others20,21,23 have found that delay is generally lower in men than in women, possibly because of higher tobacco consumption. However, the model applied in this study includes sex, age and year of mortality as predictors, so that the expected number of lung cancer deaths is adjusted by these variables. A second limitation is the maximum delay considered, 25 years, which is limited by the smoking prevalence series. However, in view of the results, it seems that the range of lags was enough to find the optimum. Another limitation of the study is the availability of smoking prevalence data by five-year age groups, which made it necessary to work with five-year gaps between lags to retrospectively match mortality age groups with prevalence age groups. Single-year lags would provide a finer estimate of the optimal lag, but the available data did not allow reconstruction of the smoking prevalence series at single ages. Finally, the model ignores certain important aspects associated with smoking, such as duration and intensity, which may affect the estimation of the lag. In Spain, in 2003, in a multicentre study conducted to determine the hospital incidence of lung cancer, it was found that both smokers and ex-smokers had accumulated a large number of pack-years at the time of diagnosis, despite the fact that almost 38% of ex-smokers had quit smoking more than 10 years earlier.24 However, including in the model different predictors that are closely related to each other may lead to multicollinearity problems, affecting precision. This is the case for age, which is related to the duration of smoking, pack-years in smokers and years of abstinence in ex-smokers. In addition, future analyses should include information related to the use of new tobacco products such as electronic cigarettes or heated tobacco products. Although, to date, the health impact in terms of mortality risk has not been established due to both their recent introduction and their dual use with tobacco.
Another important aspect is that this study used mortality data as the outcome variable, whereas Smith et al.,15 used incidence data. Our results would have benefited from lung cancer incidence data in smokers, but this information is not available in Spain at the population level. On the other hand, lung cancer mortality has decreased in recent years due to different reasons, such as some patients having certain driver genes (e.g. EGFR, ALK, ROS, KRAS) that make them susceptible to effective treatments and also, even more recently, the development of new immunotherapy treatments. Data from the United States show that 5-year survival has improved by 10% for cases diagnosed in 2016 compared to those diagnosed in 2006,25 which is a very significant improvement in a deadly tumour such as lung cancer. Consequently, the estimated 15-year lag between smoking prevalence and lung cancer mortality could be larger than that estimated for incidence.
Finally, it should be noted that this study does not analyze the induction time, as distinct from the delay time. The former corresponds to the time needed for risk factor exposure to produce the disease. The latter refers to the time window between the values of the series for which relationship is measured, i.e. the smoking prevalence series and the lung cancer mortality series. The optimal lag of 15 years estimated here is the time for which the effect of smoking prevalence on lung cancer mortality figures is maximal.
One of the main strengths of this study lies in the data sources. A precisely validated thirty-year record of smoking prevalence13 has been used. In addition, a new approach has been applied to establish the temporal relationship between smoking prevalence and lung cancer mortality, a distributed lag non-linear model. This model allows the capture of non-linear associations between the response and the predictor while allowing simultaneous modelling of lung cancer mortality from smoking prevalence and different lags.
ConclusionsAlthough the incidence of lung cancer in Spain has begun to decrease in men, it continues to rise in women and has not reached its peak yet, probably due to their late incorporation to smoking compared to men. Knowing the evolution of the series of smoking prevalence in a country and establishing a lag time is essential to predict how the evolution of lung cancer incidence and mortality will be. We must continue to emphasize the importance of prevention and reduction of tobacco consumption, which continues to be the avoidable risk factor that causes the most deaths worldwide.
Ethics ApprovalSince the data used in this study are completely anonymous, no ethical approval was required.
FundingThis work was supported by the Instituto de Salud Carlos III (ISCIII) through the project “PI22/ 00727” and co-financed by the European Union.
Authors ContributionsCGT: data curation, analysis, visualization, writing – original draft; ELV & MISP: conceptualization, technical-guidance, writing – review and editing; JRB & CCP: visualization and writing – review; ARR: supervision, writing – review and editing; MPR: conceptualization, funding acquisition, supervision, writing – review and editing. All authors read and approved the final manuscript.
Conflicts of InterestThe authors declare not to have any conflicts of interest that may be considered to influence directly or indirectly the content of the manuscript.
Article Intelligence InvolvementThe authors declare that any of the material has been partially or totally produced with the help of any artificial intelligence software or tool.
The authors would like to thank the Spanish Society of Pulmonology and Thoracic Surgery (SEPAR) for its support through the grant [1426, 2023].
Supplementary Material. The online version contains supplementary information.


