Journal Information
Share
Share
Download PDF
More article options
Visits
356
Original Article
Full text access
Available online 13 January 2025
Sputum Microbiota Correlates With Metabolome and Clinical Outcomes in Asthma–Bronchiectasis Overlap
Visits
356
Xiao-xian Zhanga,1, Zhen-feng Hea,1, Jia-hui Hea,1, Zhao-ming Chena,1, Cui-xia Pana, Zhen-hong Lina, Lai-jian Cena, Hui-min Lia, Yan Huangb, Ming-xin Shia, Wei-jie Guana,c,
Corresponding author
battery203@163.com

Corresponding author.
a Department of Allergy and Clinical Immunology, Department of Respiratory and Critical Care Medicine, State Key Laboratory of Respiratory Disease, National Clinical Research Center for Respiratory Disease, National Center for Respiratory Medicine, Guangzhou Institute of Respiratory Health, The First Affiliated Hospital, Guangzhou Medical University, Guangzhou, Guangdong, China
b Department of Geriatrics, National Key Clinical Specialty, Guangzhou First People's Hospital, Guangzhou Medical University, Guangzhou, China
c Guangzhou National Laboratory, Guangzhou, Guangdong, China
This item has received
Article information
Abstract
Full Text
Bibliography
Download PDF
Statistics
Figures (15)
Show moreShow less
Tables (1)
Table 1. Baseline Characteristics of Patients With ABO, Asthma and Bronchiectasis.
Additional material (1)
Abstract
Objectives

To investigate the microbiota and metabolome of patients with ABO compared with bronchiectasis and asthma, and determine the relevance with clinical characteristics, inflammatory endotype and exacerbation risks.

Methods

In this prospective cohort study, patients underwent comprehensive assessments, including sputum differential cell count, and sputum collection at baseline. Sputum microbiota was profiled via 16S rRNA gene sequencing and metabolome via liquid chromatography/mass spectrometry. Shannon-Wiener Diversity Index (SWDI) was used to reflect dysbiosis. Patients were followed-up to record exacerbations. ABO patients were stratified by the SWDI and sputum eosinophilia to determine the exacerbation risks.

Results

Two hundred forty-seven patients were recruited, including 99 ABO (median age: 53.2 years, 65.7% female), 61 asthma (median age: 39.5 years, 50.8% female) and 87 bronchiectasis patients (median age: 52.3 years, 55.2% female). Both microbiota compositions and metabolites differed among asthma, ABO and bronchiectasis, and between eosinophilic and non-eosinophilic ABO at steady-state. Baseline SWDI of microbiota was highest in asthma, followed by ABO. Both Pseudomonadaceae and Rothia most effectively discriminated ABO from asthma and bronchiectasis. Pseudomonas exhibited a more pronounced negative correlation with other taxa in nonEos-ABO. ABO patients with low SWDI with sputum eosinophilia, or those with high SWDI without sputum eosinophilia, had a shorter time to the first exacerbation. Metabolomic compositions in Eos-ABO separated from nonEos-ABO. The relative abundance of Enterobacteriaceae correlated negatively with 15-hydroxylated eicosatetraenoic acid, whose concentrations were higher in Eos-ABO.

Conclusions

Integrating microbiota and metabolome profiles, together with eosinophilic inflammatory endotyping, can inform exacerbation risk and personalized management of ABO.

Keywords:
Asthma–bronchiectasis overlap
Eosinophil
Exacerbation
Metabolome
Microbiota
Abbreviations:
ABO
AE
ASVs
BSI
CRDs
Eos-ABO
FDR
FEV1
HR
HRCT
IgE
IQR
LDA
LEfSe
nonEos-ABO
PCA
SWDI
PERMANOVA
Graphical abstract
Full Text
Introduction

Asthma and bronchiectasis are common chronic respiratory diseases (CRDs)1,2 and frequently coexist, a condition termed asthma–bronchiectasis overlap (ABO). The prevalence of ABO in patients with bronchiectasis reportedly ranged between 15% and 30.2%.3 In bronchiectasis, the pathological bronchial dilation primarily stems from chronic airway infection and inflammation – the shared pathophysiological components of asthma. Asthma may develop among patients with bronchiectasis, and the vice versa.1,3 Compared with asthma or bronchiectasis alone, ABO yielded greater symptom burden and higher frequency of acute exacerbation (AE).4–6 Because of the lack of specific guidelines, the management schema of ABO have been extrapolated from asthma and bronchiectasis.1,2,7 In asthma, inhaled corticosteroids are the cornerstone of anti-inflammatory treatment, which is not recommended for bronchiectasis because of increased infection risks. For ABO, how to balance anti-inflammatory and antimicrobial treatment remains challenging.

While some culture-dependent pathogens correlated with the outcomes of ABO,8 airway microbiota could be better characterized with 16S rRNA gene sequencing.9 In asthma, Proteobacteria were enriched compared with healthy controls, and the degree of dysbiosis (bacterial diversity, community composition and abundance of specific phylotypes) predicted the levels of airway hyperresponsiveness, disease severity and asthma control.10,11 In bronchiectasis, airway dysbiosis correlated with disease severity and lung function impairment. The dominance of Pseudomonas spp. conferred a higher risk of AE and all-cause mortality in bronchiectasis.12–14

Dysbiosis may modify clinical outcomes of CRDs via shaping the airway inflammatory milieu or releasing metabolites that alter the host transcriptome.15,16 Notably, different airway inflammatory endotypes correlated with distinct microbiota profiles in asthma. Compared with the eosinophilic endotype, the neutrophilic endotype correlated with markedly lower bacterial diversity and enrichment of pathogenic bacteria.17 In bronchiectasis, higher blood eosinophil counts were associated with the relative abundance of Streptococcus and Pseudomonas and a shorter time to the next AE.18 Because the microbiota reportedly shaped the airway microenvironment via metabolites modulating inflammatory signaling or immunity,15,16 ascertaining the role of microbiota and metabolome would help appraise the pathophysiology among asthma, bronchiectasis and ABO.

We hypothesized that the microbiota compositions and their metabolome differed considerably among asthma, ABO and bronchiectasis, which correlated with the disease severity, inflammatory endotypes and future risks of AE. Our findings might help identify strategies for personalized management of ABO.

Methods

See Supplementary Materials for details.

Study Participants

We consecutively recruited adult patients between May 2018 and August 2023. The inclusion criteria were: clinically significant bronchiectasis was diagnosed based on high-resolution computed tomography (HRCT) manifestations (an inner/outer airway-artery diameter ratio ≥1.0, no tapering of airways, or visible airways in the periphery) compatible with respiratory symptoms (daily cough, chronic sputum production, a history of exacerbations).19 Asthma was a physician diagnosis based on Global Initiative for Asthma guidelines – respiratory symptoms (wheezing, shortness of breath, cough or chest tightness) plus variable expiratory airflow limitation (significant bronchodilator response or airway hyperresponsiveness).1 Severe asthma denoted asthma requiring level 4/5 treatments to maintain asthma control, or uncontrolled asthma despite maximal treatment. ABO was diagnosed among patients with co-existing asthma and bronchiectasis.

Eligible patients were in steady-state at baseline, remaining exacerbation-free and had no antibiotics use (except for low-dose macrolides) for more than 4 weeks. AE denoted significant deterioration of three or more symptoms persisting for more than 48h that required immediate changes in treatment.19 Key exclusion criteria for all patients were active tuberculosis, malignancy, eosinophilic granulomatosis with polyangiitis, allergic bronchopulmonary aspergillosis, antineutrophil cytoplasmic antibody-associated lung disease, traction bronchiectasis, pregnancy, lactation, or insufficient yield of valid sputum.

Ethics approval was obtained. All patients signed written informed consent.

Study Design

At initial visits, we collected clinical information, performed spirometry, chest HRCT and rated the radiologic severity of bronchiectasis using modified Reiff score.20 We rated bronchiectasis severity using Bronchiectasis Severity Index (BSI)21 and E-FACED score,22 and assessed bronchiectasis etiology.23 We ascertained atopic status according to the total or specific serum immunoglobulin E titers for allergens, or skin-prick tests. Blood eosinophil count was stratified into high- (>300/μL) or low-eosinophil (≤300/μL) subgroups. Patients were followed-up for recording AE. Sputum was collected prior to antibiotics prescriptions.

Sputum Collection

Spontaneous sputum was prioritized. If the sputum yield was insufficient, induction with 3% saline was performed. After thorough mouth rinsing, patients forcefully expectorated into sterile containers. Sputum plugs were selected after removal of saliva via repeated dragging onto a sterile petri dish. We performed quality-control and split sputum for differential cell counts, bacterial culture, 16S rRNA gene sequencing and metabolomic profiling. ABO was stratified by the presence [eosinophilic ABO (Eos-ABO), sputum eosinophils ≥3%] or absence [non-eosinophilic ABO (nonEos-ABO), sputum eosinophils <3%] of sputum eosinophilia, in accordance with the accepted standards in published literature.24,25 Furthermore, the percentage instead of absolute sputum eosinophil count was selected to minimize the influence of the variability in viscosity and cell density within the sputum. Sputum with a squamous epithelial cell to leucocyte ratio <1:2.5 per low-power microscopic field (magnified 40×) was assayed.26 Supernatant was obtained after rinsing with phosphate buffer solution before metabolomic profiling.

16s rRNA Sequencing Analytical Pipelines

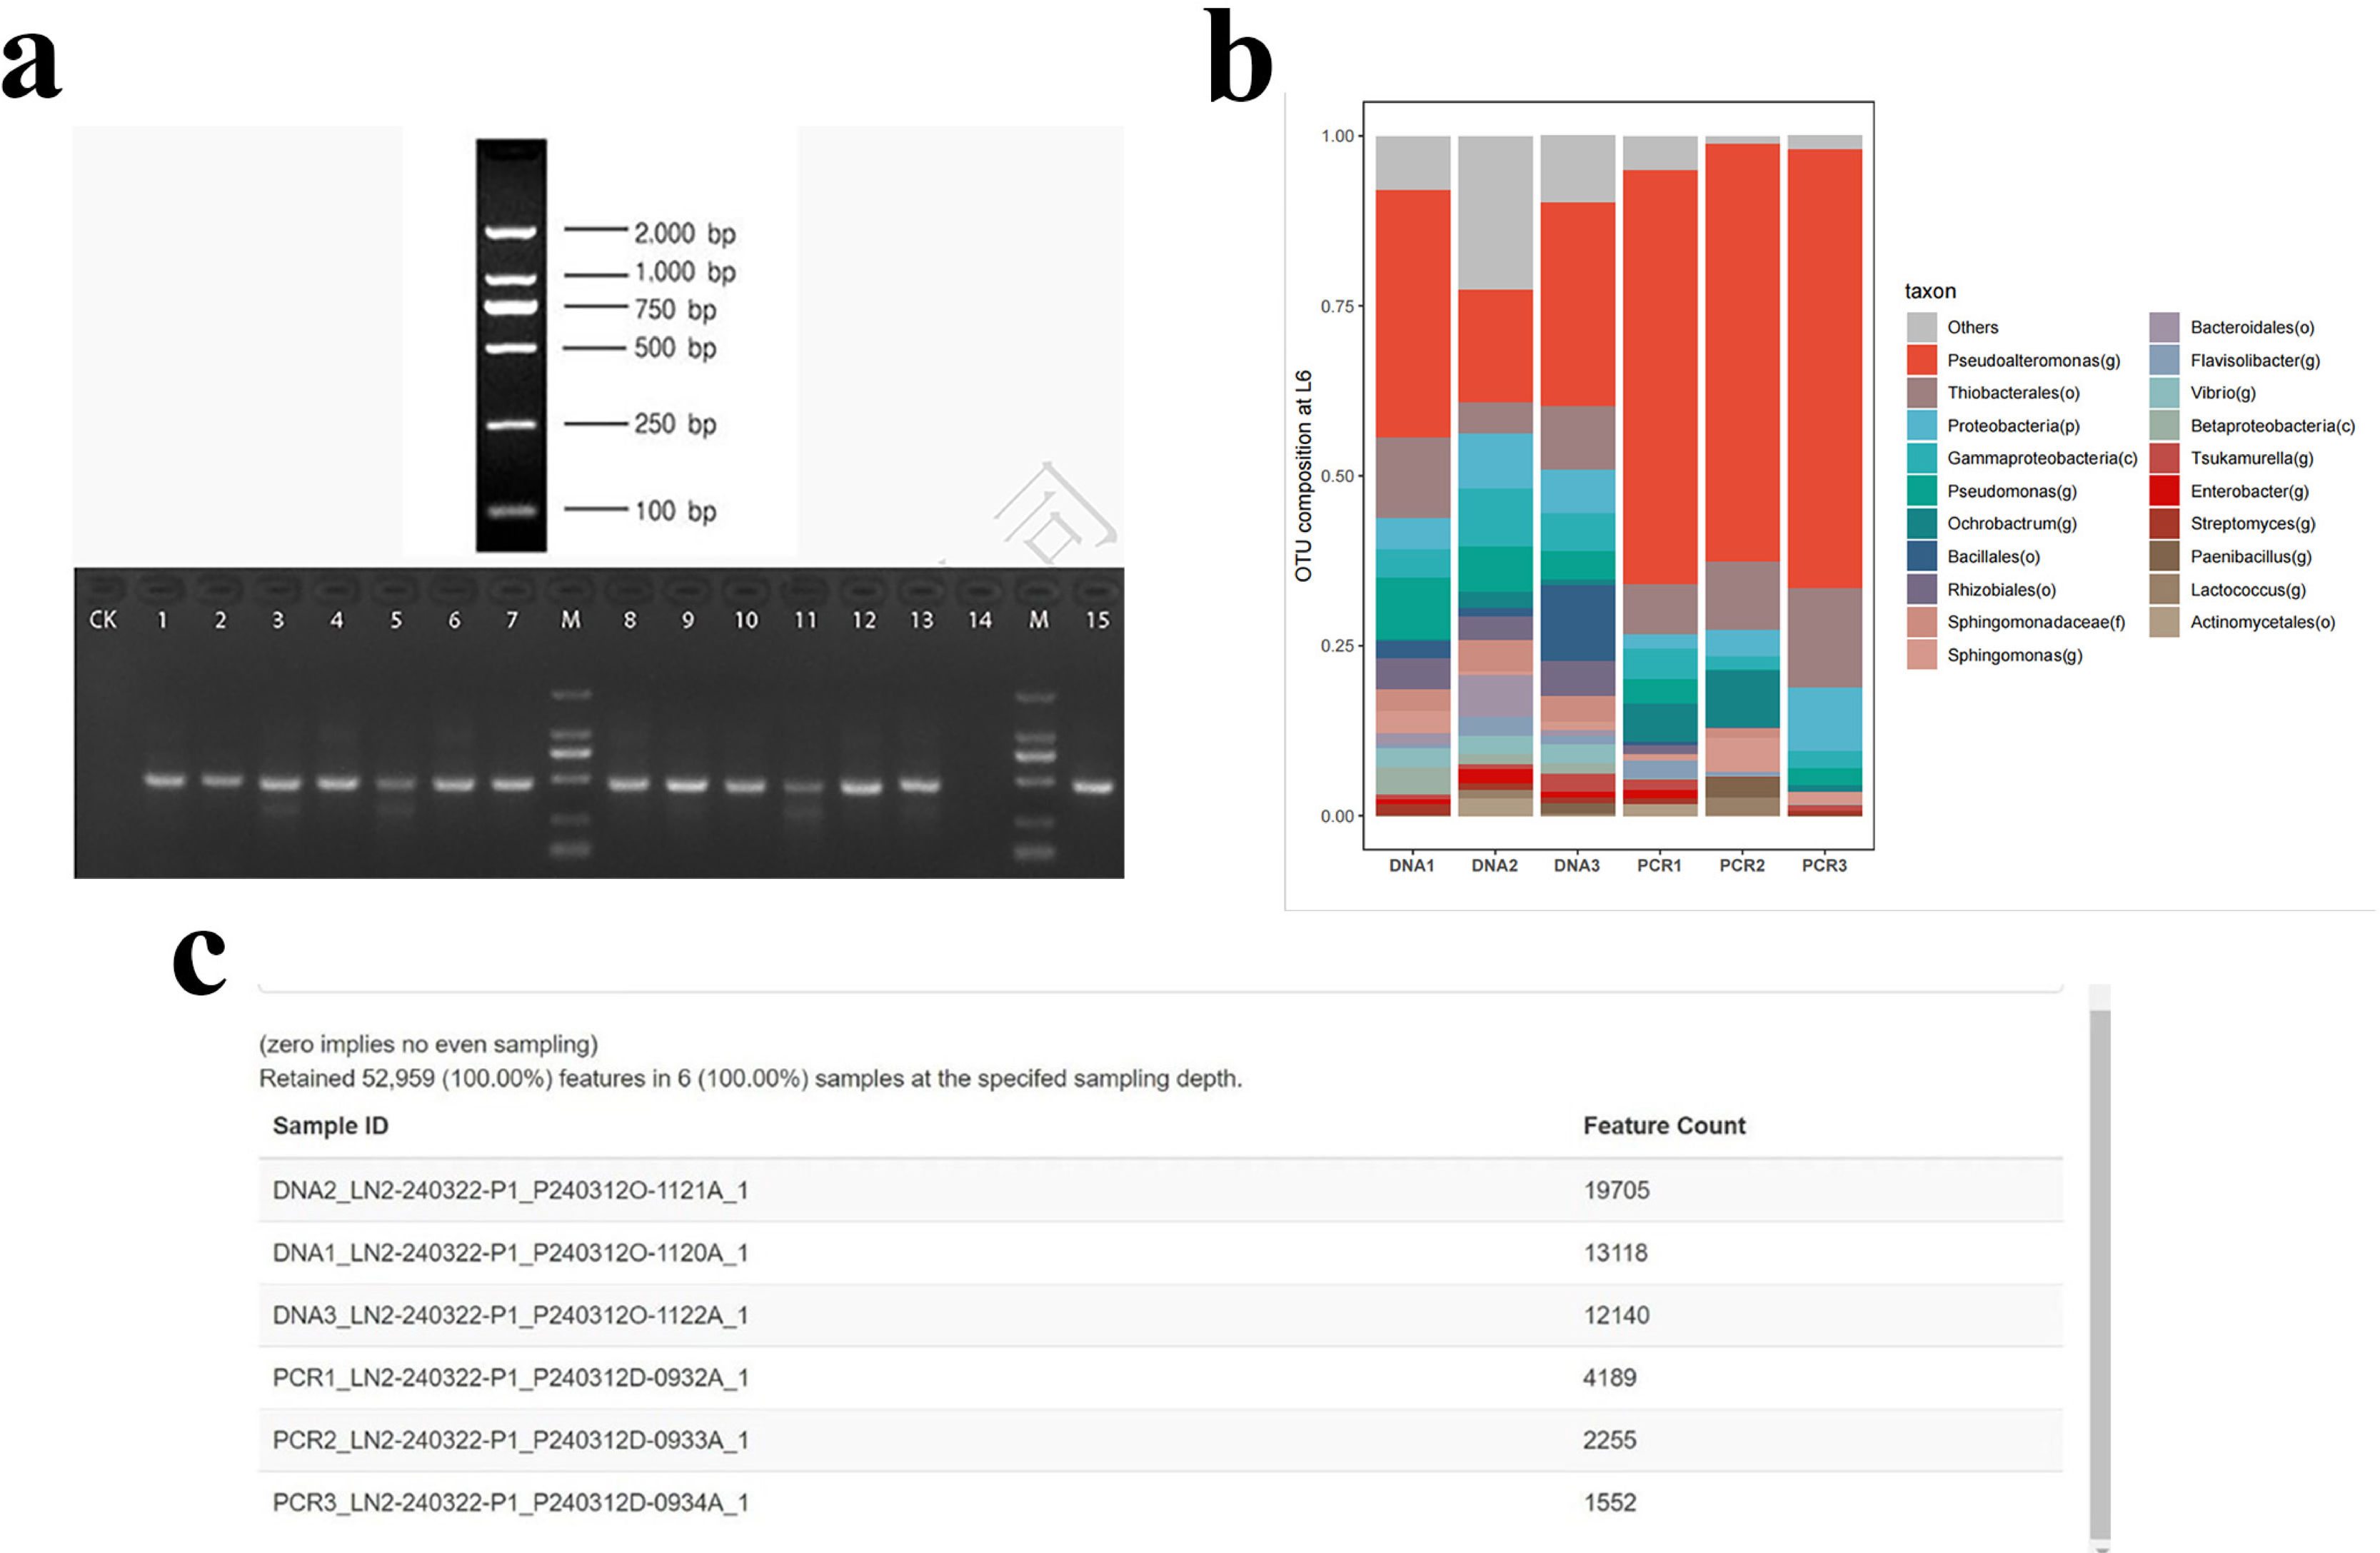
The detailed procedures are provided in Supplement. DNA was extracted from sputum, followed by agarose gel electrophoresis and quality-control with ND-100 Nanodrop. Quality-filtered samples underwent library construction. The V3–V4 region of 16S rRNA genes was amplified from sputum DNA, followed by sequencing with Illumina Nova 6000 (Guangdong Magigene Biotechnology Co., Ltd. Guangzhou, China). Sequences were deposited in GenBank (PRJNA1007275). All 16S rRNA gene datasets were processed using a standardized pipeline in Quantitative Insights Into Microbial Ecology 2.0 (QIIME 2.0).27 The demultiplexed sequencing reads were denoised to generate amplicon sequence variants (ASVs) using Divisive Amplicon Denoising Algorithm 2 (DADA2).28,29 A custom Naive Bayes classifier was trained on Greengenes Database (Second Genome, Inc.) 13_8 99% operational taxonomic units to assign a taxonomy for the ASVs. Samples were rarefied to 32,137 reads.

Alpha diversity was estimated by Shannon-Wiener Diversity Index (SWDI), and beta diversity by weighted Unifrac and visualized with principal coordinate analysis (PCoA). Permutational multivariate analysis-of-variance (PERMANOVA) calculated the total distance between individuals within each group. Linear discriminant analysis effect size (LEfSe) analysis assessed the importance of taxa contributing to the between-group differences. Significant inter-taxa SparCC30 (sparse correlations for compositional data) correlations with coefficients >0.3 (false-discovery rate [FDR]-adjusted P<0.05) were displayed by co-occurrence network graphics.

Extensively Targeted Metabolomics

Ice-thawed sputum was vortexed for 10s. One hundred microliters each of sputum and extraction solution (acetonitrile/methanol 1:4, V/V) containing internal standards were added into 2ml microcentrifuge tubes, followed by vortex for 3min and centrifugation (13,400g for 10min, 4°C). One hundred fifty microliters of supernatant were placed in −20°C for 30min, and centrifuged (13,400g for 3min, 4°C). One hundred twenty microliters of supernatant were transferred for liquid chromatography–mass spectrometry with triple time-of-flight mass spectrometer (TripleTOF 6600, AB SCIEX). In each cycle, 12 precursor ions whose intensity >100 were selected for fragmentation at 30V.

Statistical Analysis

Data were processed with SPSS 23.0, R version 4.2.2, python 3.10 and GraphPad Prism (version 8.0.1 GraphPad Inc., San Diego, USA). Continuous variables were presented as mean±standard deviation (SD) or median (interquartile range [IQR]), whereas counts (proportion) for categorical variables. We analyzed continuous variables with t-test, analysis-of-variance, Mann–Whitney or Kruskal–Wallis test, and compared categorical variables with Chi-square or Fisher's exact test. The future risk of AE was analyzed with Kaplan–Meier model and compared with log-rank test, with the hazards ratio (HR) and 95% confidence interval (95% CI) being displayed. The differentially enriched microbiota were identified by LEfSe with Wilcoxon rank-sum test and linear discriminant analysis (LDA) score (log10) >2 (permutation-based FDR-P<0.05). For significant between-group differences in microbial/metabolomic profiles in PCA, we applied orthogonal partial least-squares discriminant analysis (OPLS-DA) to highlight the differentially expressed metabolites. We explored the association of taxa with the clinical parameters using Microbiome Multivariable Associations with Linear Models31 (MaAsLin2 2.1.16 R package), and assessed the Spearman's correlation between the taxa and metabolites after applying a log-ratio transformation (FDR-P<0.05). LEfSe analysis, PCoA and taxa–metabolites correlation analysis were performed using the OmicStudio tools32 at https://www.omicstudio.cn/. Details are provided in Online Supplement or deposited in GitHub under https://github.com/Dr-Hezf/Dr-Zhang-ABO-microbiota.git.

ResultsBaseline Characteristics

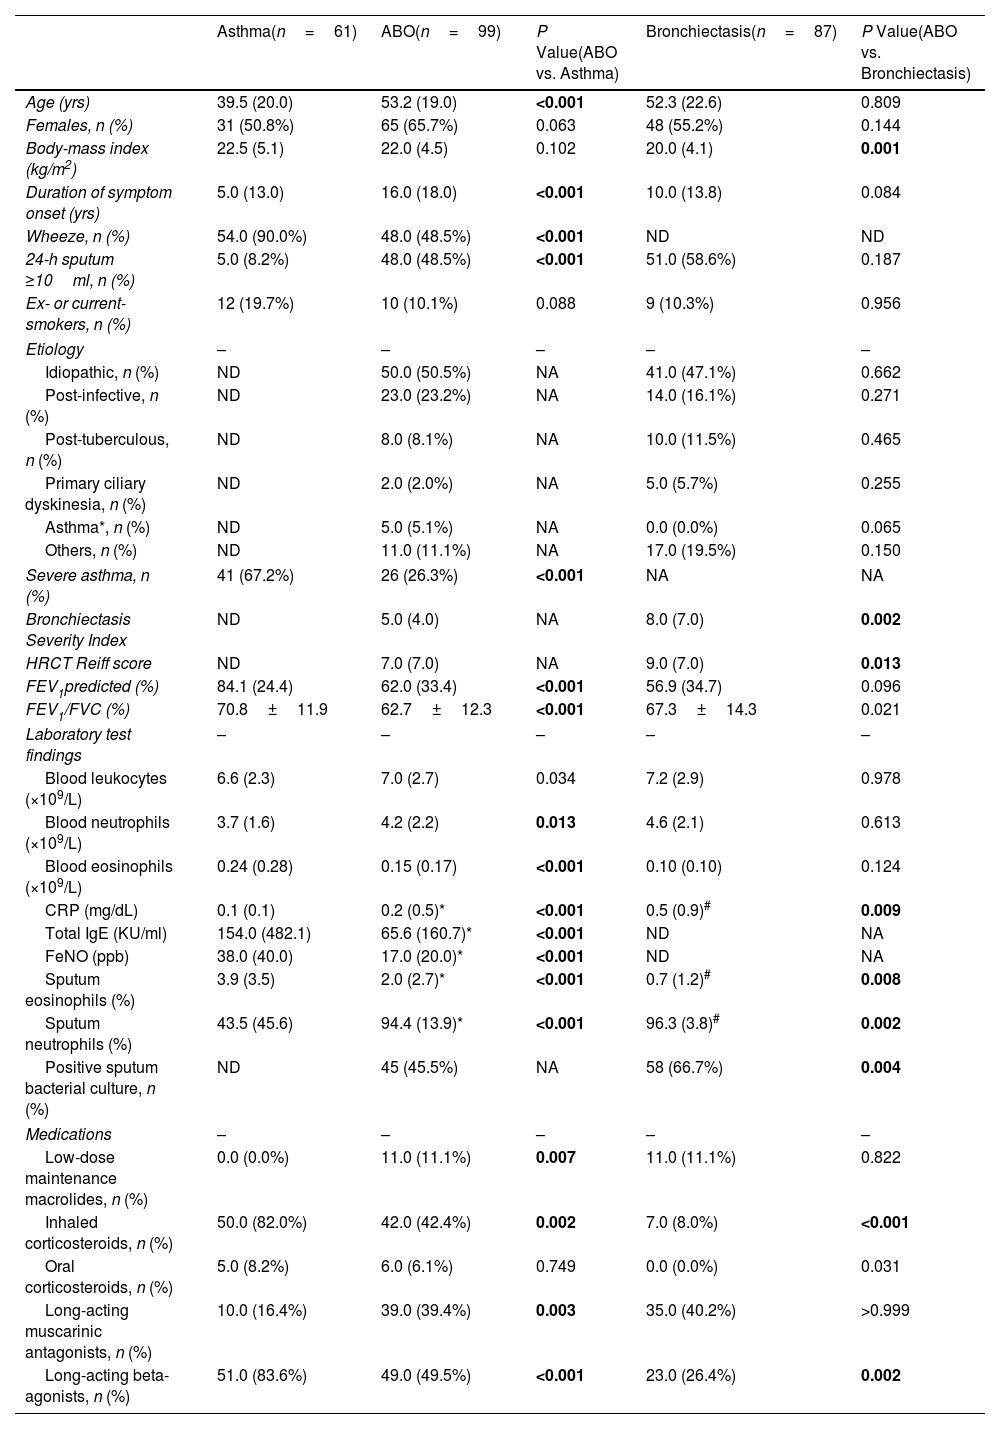
Of 271 patients screened, 247 were enrolled (61 asthma, 99 ABO, 87 bronchiectasis) (Fig. 1). All patients provided a sputum sample at baseline. The median follow-up was 23.8 (IQR: 16.0) months. Compared with asthmatic patients, those with ABO were older, had a longer disease duration, more severe airflow limitation, more frequent sputum neutrophilia, and non-atopy. Compared with bronchiectasis patients, those with ABO had higher body-mass index, lower BSI and modified Reiff scores, and more prominent sputum eosinophilia (Table 1).

Fig. 1.

Flowchart of patient recruitment. Abbreviations: ABO: asthma–bronchiectasis overlap; Eos-ABO: eosinophilic asthma–bronchiectasis overlap; nonEos-ABO: non-eosinophilic asthma–bronchiectasis overlap; AE: acute exacerbation.

(0.21MB).
Table 1.

Baseline Characteristics of Patients With ABO, Asthma and Bronchiectasis.

  Asthma(n=61)  ABO(n=99)  P Value(ABO vs. Asthma)  Bronchiectasis(n=87)  P Value(ABO vs. Bronchiectasis) 
Age (yrs)  39.5 (20.0)  53.2 (19.0)  <0.001  52.3 (22.6)  0.809 
Females, n (%)  31 (50.8%)  65 (65.7%)  0.063  48 (55.2%)  0.144 
Body-mass index (kg/m2)  22.5 (5.1)  22.0 (4.5)  0.102  20.0 (4.1)  0.001 
Duration of symptom onset (yrs)  5.0 (13.0)  16.0 (18.0)  <0.001  10.0 (13.8)  0.084 
Wheeze, n (%)  54.0 (90.0%)  48.0 (48.5%)  <0.001  ND  ND 
24-h sputum10ml, n (%)  5.0 (8.2%)  48.0 (48.5%)  <0.001  51.0 (58.6%)  0.187 
Ex- or current-smokers, n (%)  12 (19.7%)  10 (10.1%)  0.088  9 (10.3%)  0.956 
Etiology  –  –  –  –  – 
Idiopathic, n (%)  ND  50.0 (50.5%)  NA  41.0 (47.1%)  0.662 
Post-infective, n (%)  ND  23.0 (23.2%)  NA  14.0 (16.1%)  0.271 
Post-tuberculous, n (%)  ND  8.0 (8.1%)  NA  10.0 (11.5%)  0.465 
Primary ciliary dyskinesia, n (%)  ND  2.0 (2.0%)  NA  5.0 (5.7%)  0.255 
Asthma*, n (%)  ND  5.0 (5.1%)  NA  0.0 (0.0%)  0.065 
Others, n (%)  ND  11.0 (11.1%)  NA  17.0 (19.5%)  0.150 
Severe asthma, n (%)  41 (67.2%)  26 (26.3%)  <0.001  NA  NA 
Bronchiectasis Severity Index  ND  5.0 (4.0)  NA  8.0 (7.0)  0.002 
HRCT Reiff score  ND  7.0 (7.0)  NA  9.0 (7.0)  0.013 
FEV1predicted (%)  84.1 (24.4)  62.0 (33.4)  <0.001  56.9 (34.7)  0.096 
FEV1/FVC (%)  70.8±11.9  62.7±12.3  <0.001  67.3±14.3  0.021 
Laboratory test findings  –  –  –  –  – 
Blood leukocytes (×109/L)  6.6 (2.3)  7.0 (2.7)  0.034  7.2 (2.9)  0.978 
Blood neutrophils (×109/L)  3.7 (1.6)  4.2 (2.2)  0.013  4.6 (2.1)  0.613 
Blood eosinophils (×109/L)  0.24 (0.28)  0.15 (0.17)  <0.001  0.10 (0.10)  0.124 
CRP (mg/dL)  0.1 (0.1)  0.2 (0.5)*  <0.001  0.5 (0.9)#  0.009 
Total IgE (KU/ml)  154.0 (482.1)  65.6 (160.7)*  <0.001  ND  NA 
FeNO (ppb)  38.0 (40.0)  17.0 (20.0)*  <0.001  ND  NA 
Sputum eosinophils (%)  3.9 (3.5)  2.0 (2.7)*  <0.001  0.7 (1.2)#  0.008 
Sputum neutrophils (%)  43.5 (45.6)  94.4 (13.9)*  <0.001  96.3 (3.8)#  0.002 
Positive sputum bacterial culture, n (%)  ND  45 (45.5%)  NA  58 (66.7%)  0.004 
Medications  –  –  –  –  – 
Low-dose maintenance macrolides, n (%)  0.0 (0.0%)  11.0 (11.1%)  0.007  11.0 (11.1%)  0.822 
Inhaled corticosteroids, n (%)  50.0 (82.0%)  42.0 (42.4%)  0.002  7.0 (8.0%)  <0.001 
Oral corticosteroids, n (%)  5.0 (8.2%)  6.0 (6.1%)  0.749  0.0 (0.0%)  0.031 
Long-acting muscarinic antagonists, n (%)  10.0 (16.4%)  39.0 (39.4%)  0.003  35.0 (40.2%)  >0.999 
Long-acting beta-agonists, n (%)  51.0 (83.6%)  49.0 (49.5%)  <0.001  23.0 (26.4%)  0.002 

Abbreviations: ABO: asthma–bronchiectasis overlap; HRCT: high-resolution computed tomography; IgE: immunoglobulin E; FeNO: fractional exhaled nitric oxide; CRP: C-reactive protein; FEV1: forced expiratory volume in one second; FEV1/FVC: the ratio of forced expiratory volume in one second/forced vital capacity; ND: not done; NA: not applicable.

*

In ABO patients, 96 had undergone sputum cytology assays, 91 had undergone total IgE assays, 74 had undergone FeNO testing, 92 had undergone CRP assays; asthma means asthma onset prior to bronchiectasis.

#

In patients with bronchiectasis, 69 had undergone sputum cytology assays and 82 had undergone C-reactive protein assays.

Bold font: P<0.017, significant differences subjected to Bonferroni's correction.

We identified modest correlations between blood and sputum eosinophil count in ABO (r=0.43, P<0.001). Ninety-six ABO patients with sputum cytology findings were divided into Eos-ABO (n=25) and nonEos-ABO group (n=71) (Table E1).

Differential Microbiota Compositions and Interactions at Baseline

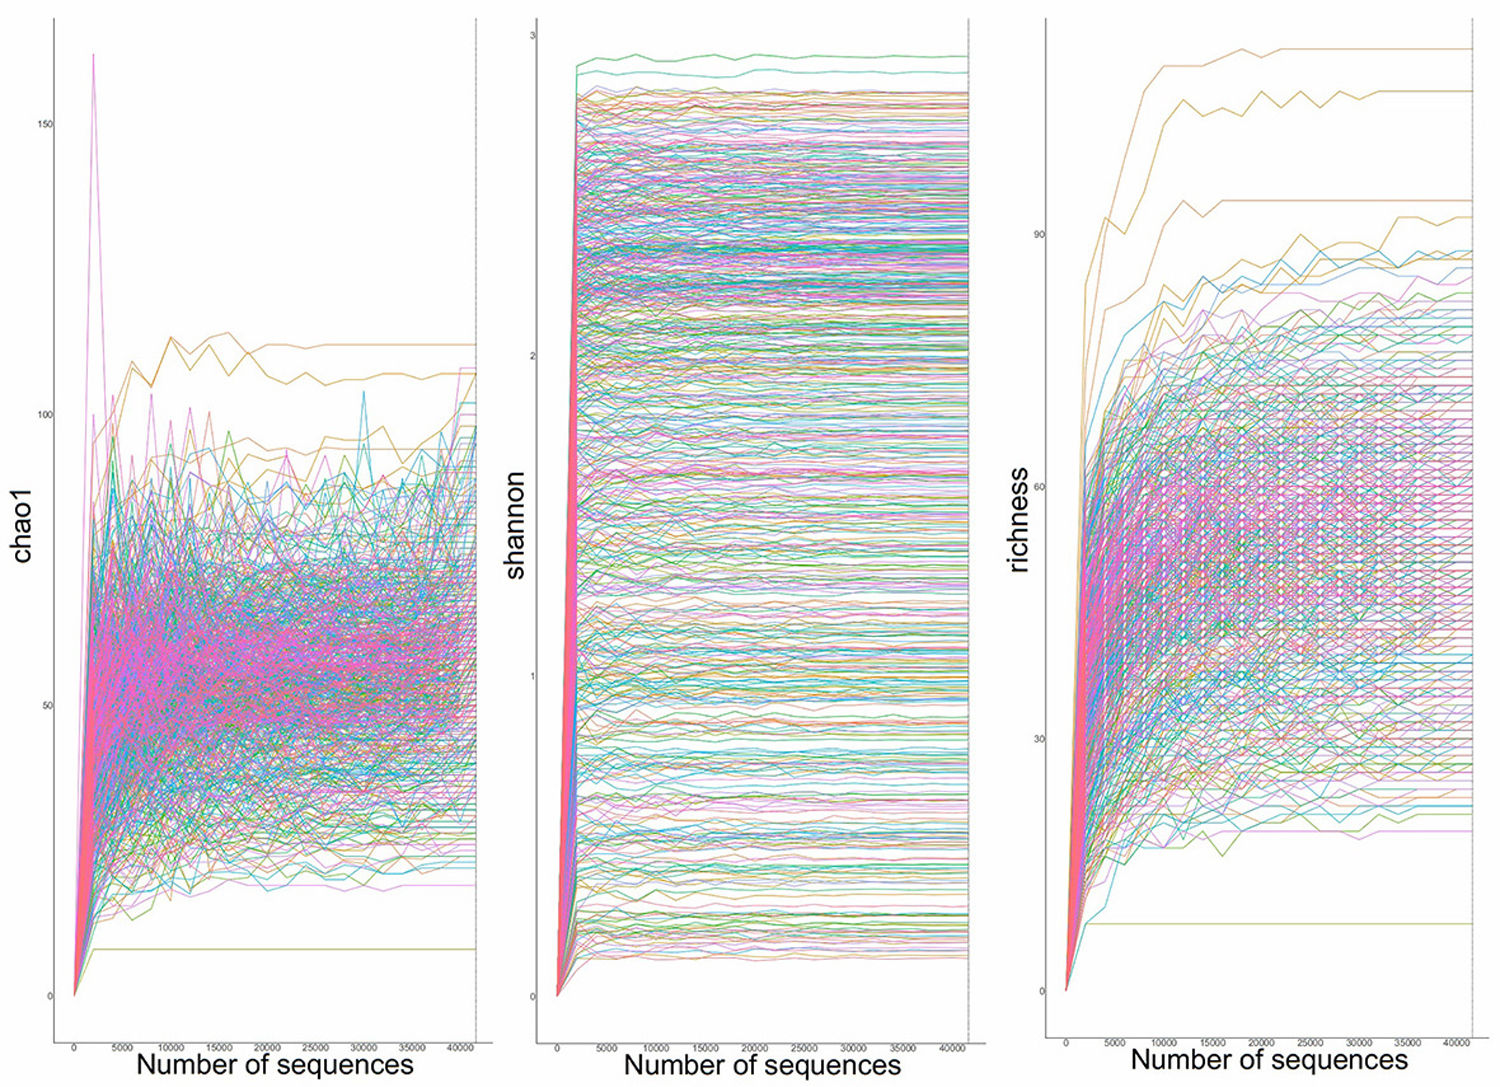
We obtained 81,769,907 high-quality 16S rRNA reads [median: 123,118 (range: 32,137–252,716) per sample]. Four thousand five hundred sixty-four ASVs were identified and 305 ASVs annotated to genus level were used to calculate the relative abundance (Fig. E1).

At phyla level, Proteobacteria, Firmicutes and Bacteroidetes dominated in both ABO (41.4%, 26.0%, 13.0%) and bronchiectasis (51.8%, 18.6%, 14.4%). By contrast, Firmicutes, Proteobacteria and Bacteroidetes dominated in asthma (36.8%, 19.9%, 18.4%). Firmicutes, Proteobacteria and Actinobacteria dominated in Eos-ABO (33.6%, 31.2%,14.2%), while Proteobacteria, Firmicutes and Bacteroidetes dominated in nonEos-ABO (44.8%, 23.6%,13.1%) (Fig. 2a and b). Streptococcus, Pseudomonadaceae and Neisseria dominated in ABO (18.5%, 17.6%, 8.9%), Streptococcus, Neisseria and Prevotella in asthma (25.9%, 14.8%, 9.8%) and Pseudomonas, Pseudomonadaceae and Streptococcus in bronchiectasis (17.1%, 12.8%, 10.7%). Streptococcus, Neisseria and Rothia dominated in Eos-ABO (24.0%, 12.0%, 10.5%), while Pseudomonadaceae, Streptococcus and Haemophilus in nonEos-ABO (20.0%, 16.9%, 8.0%) (Fig. 2c and d). However, the relative abundance of Pseudomonas or Pseudomonadaceae did not correlate with sputum eosinophil count in ABO.

Fig. 2.

Baseline sputum microbiota profiles of asthma, ABO and bronchiectasis. Composition of the major phyla (a and b) and taxa (c and d), and alpha diversity (Shannon-Wiener Diversity Index) (e and f) at baseline for sputum samples. The relative abundance of lung microbiota is shown at the phylum (a and b) and taxa (c and d) level at baseline. Principal coordinate analysis based on the weighted Unifrac dissimilarity for sputum samples (g and h). Linear discriminant analysis (LDA) effect size (LEfSe) showing the microbiota taxa specifically enriched (i and j) in each group (LDA >4.0, FDR P<0.05). ABO: asthma–bronchiectasis overlap; Eos-ABO: eosinophilic asthma–bronchiectasis overlap, nonEos-ABO: non-eosinophilic asthma–bronchiectasis overlap; FDR: false-discovery rate; LDA: linear discriminant analysis; Pseudomonadaceae: the genus in the family Pseudomonas other than Pseudomonas; Neisseriaceae: other genus in the Neisseria family, except for Neisseria, Eisenia, and Ginsenia.

(1.16MB).

At steady-state, the median SWDI was 4.36 (IQR: 2.35) in ABO, which was significantly lower than in asthma [5.26 (0.77), P<0.001], but markedly higher than in bronchiectasis [3.69 (2.35), P=0.008]. Additionally, SWDI did not differ between Eos-ABO and nonEos-ABO. The weighted Unifrac distance were well separated (PERMANOVA R2=0.100, P=0.001) among asthma, ABO and bronchiectasis, as were those between Eos-ABO and nonEos-ABO (PERMANOVA R2=0.033, P=0.012) (Fig. 2e–h).

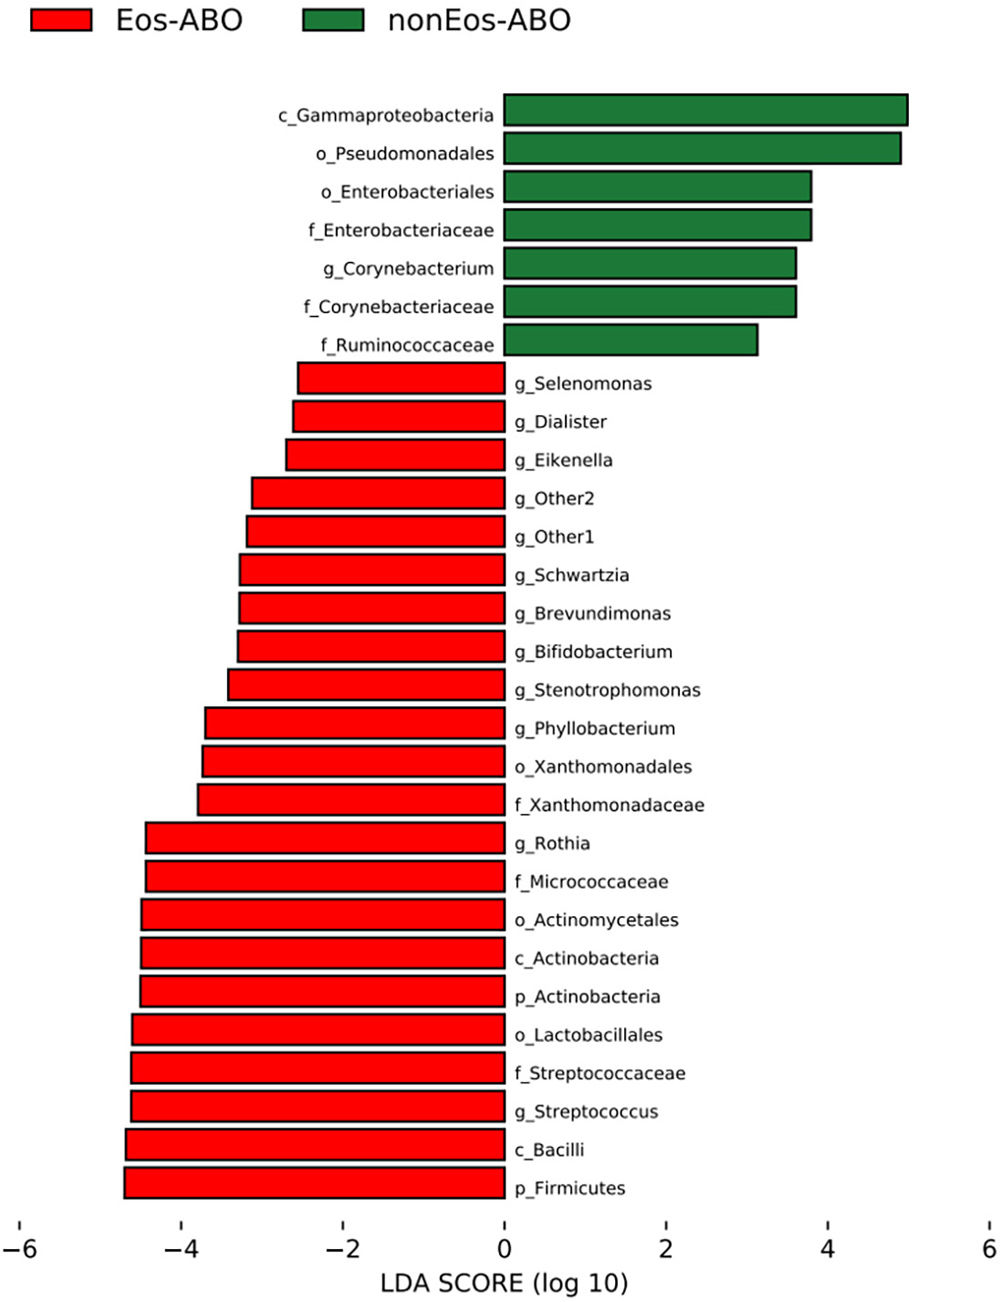
LEfSe analysis showed that Pseudomonadaceae and Rothia were enriched in ABO, while Streptococcus, Neisseria and Prevotella in asthma. Streptococcus, Rothia, and Neisseriaceae were enriched in Eos-ABO, while Corynebacterium in nonEos-ABO (Fig. 2i and j).

In microbiota co-occurrence network (Fig. 3), despite the similar total number of microbes, the microbiota interactions were most pronounced in asthma. Eos-ABO exhibited significantly more microbiota interactions than nonEos-ABO. In addition, the key genera presenting more interactions with other genera were different – Haemophilus/Neisseria in asthma, Actinomyces/Pseudomonas/Hemophilus in ABO, and Streptococcus/Pseudomonas in bronchiectasis. Pseudomonas exhibited more pronounced negative correlations with other taxa in bronchiectasis and ABO, particularly in nonEos-ABO (Table E2).

Fig. 3.

Network co-occurrence analysis of microbiota communities in asthma, ABO and bronchiectasis. Baseline microbiota co-occurrence network of asthma (a), ABO (b), bronchiectasis (c), Eos-ABO (d) and nonEos-ABO (e), and a summary table listing the network characteristics (f). In the network map, each node represents a taxon. The size of the node is proportional to its degree of connectivity. Nodes were colored based on the phylum classification. Each edge represents a significant Spearman's correlation between the pairs of nodes (FDR-P<0.05). The width of the edge is proportional to the absolute correlation coefficient. Edges are colored red for co-exclusion or blue for co-occurrence relationships. The significant inter-taxa Spearman's correlation coefficients being greater than 0.3 (false-discovery rate [FDR]-adjusted P<0.05) are displayed by microbial co-occurrence network graphics. ABO: asthma–bronchiectasis overlap; Eos-ABO: eosinophilic asthma–bronchiectasis overlap; nonEos-ABO: non-eosinophilic asthma–bronchiectasis overlap.

(1.41MB).
Baseline Clinical Correlates of Microbiota Compositions and Longitudinal Outcomes of ABO

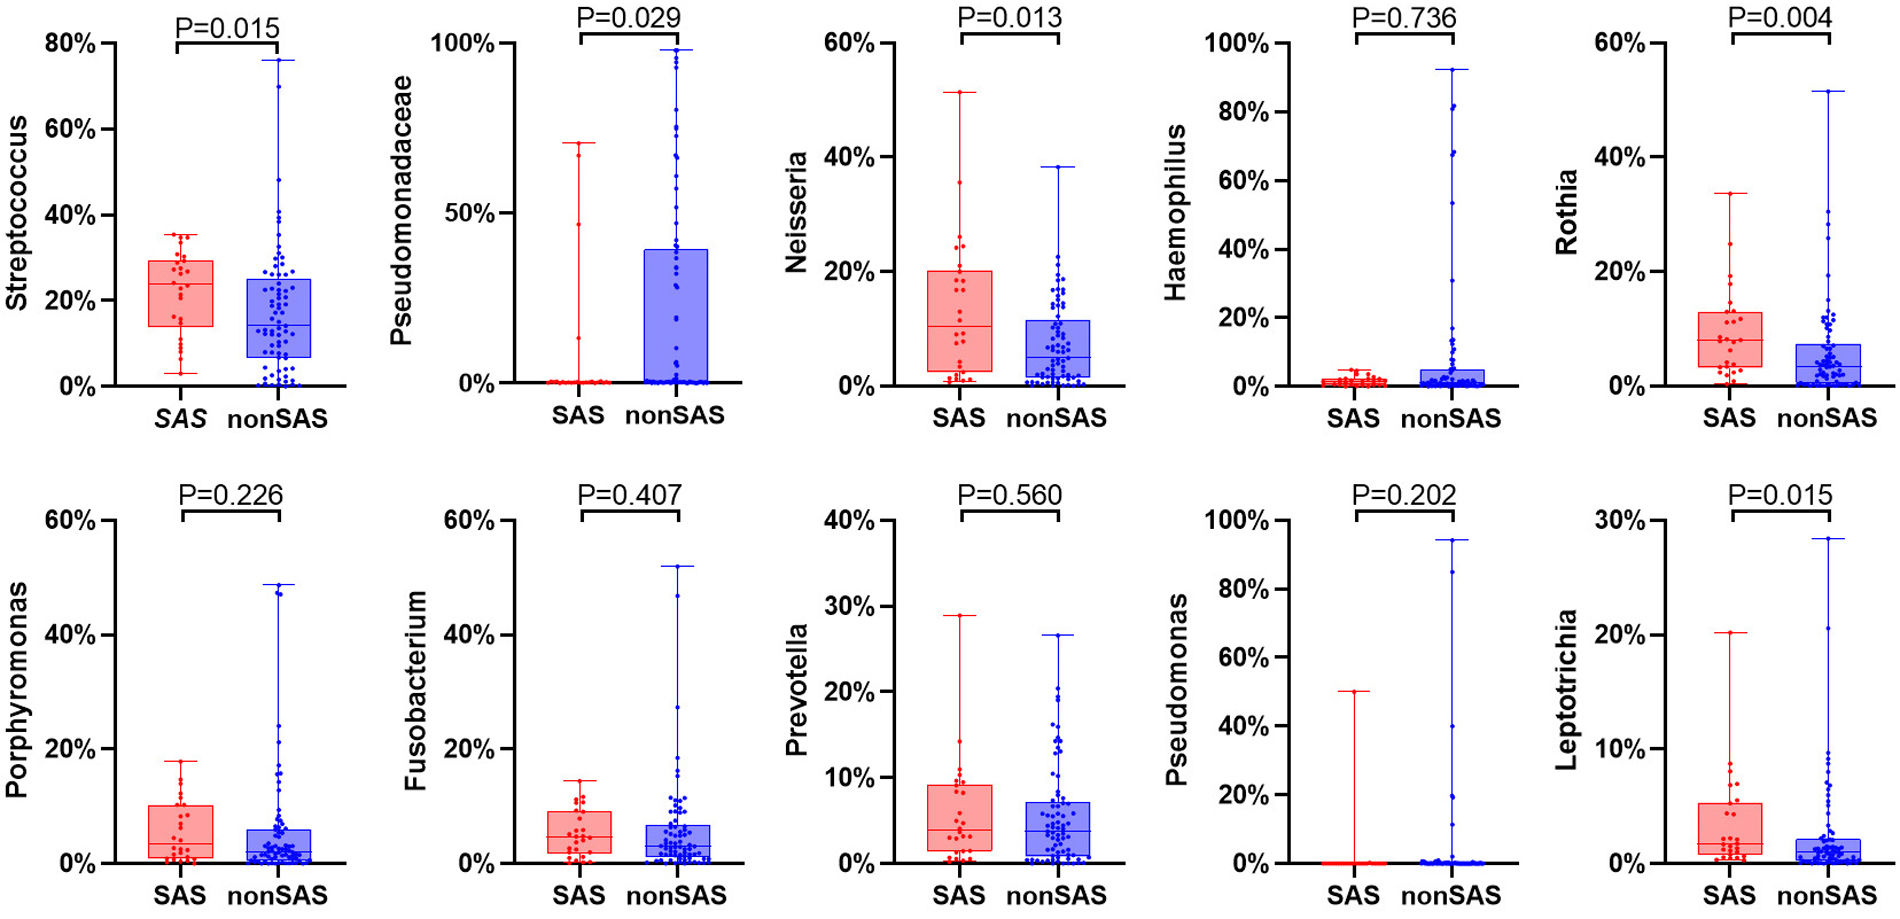
Fig. 4a reveals the microbiota profiles associated with the core clinical characteristics at steady-state of ABO. BSI, E-FACED score, Reiff score and 24-h sputum >10ml were key clinical parameters significantly associated with the taxa via Maaslin algorithm. Among patients with ABO, the median SWDI was significantly higher in patients with severe asthma than those without [5.13 (1.39) vs. 3.86 (2.29), P=0.003] (Fig. 4b). ABO patients with severe asthma had more prominent sputum eosinophilia and atopy (Table E3). The relative abundance of Pseudomonadacea correlated with BSI, E-FACED score, modified Reiff score and FEV1 pred% in ABO, while the relative abundance of Rothia and Streptococcus correlated with modified Reiff score and BSI (Fig. 4a). Furthermore, ABO patients with severe asthma had higher relative abundance of Streptococcus, Neisseria, Rothia and Leptotrichia (Fig. E2).

Fig. 4.

Baseline clinical correlates of sputum microbiota and longitudinal outcomes in ABO. (a) Heatmaps showing associations between the relative abundance of genera and clinical parameters in stable ABO (MaAsLin2 analyses). Strength and direction of the associations are indicated by the color scale of the regression coefficient. FDR was controlled with a P value cut-off <0.05; white indicates non-significant associations. *P<0.05, **P<0.01, ***P<0.001. (b) Shannon-Wiener Diversity Index between SAS and nonSAS. (c–f) Risk of bronchiectasis exacerbations during the 2-year longitudinal follow-up in ABO. (c and d) Annual exacerbation frequency and the risks of bronchiectasis exacerbations between Eos-ABO and nonEos-ABO. (e and f) Annual bronchiectasis exacerbation frequency and the risk of bronchiectasis exacerbations among ABO patients stratified by the median SWDI (<4.36) and sputum eosinophilia. BSI: Bronchiectasis Severity Index; Duration: the duration from first time of diagnosis; CRP: C-reactive protein; Reiff_score: Reiff score of bronchiectasis based chest CT; sputum_10ml: the presence of 24-h sputum volume higher than 10ml; Pseudomonadaceae: the genus in the family Pseudomonas other than Pseudomonas; SAS: severe asthma; nonSAS: non-severe asthma; Eos-ABO: eosinophilic asthma–bronchiectasis overlap; nonEos-ABO: non-eosinophilic asthma–bronchiectasis overlap; SWDILowEos-ABO: the median SWDI <4.36 with sputum eosinophilia; SWDIHighEos-ABO: the median SWDI >4.36 with sputum eosinophilia; SWDILownonEos-ABO: the median SWDI <4.36 without sputum eosinophilia; SWDIHighnonEos-ABO: the median SWDI >4.36 without sputum eosinophilia; HR: hazards ratio.

(0.42MB).

We captured 188 AEs in ABO. However, neither the annualized frequency of AE nor the time to the first AE during follow-up differed between Eos-ABO and nonEos-ABO (Fig. 4c and d).

We next stratified ABO by the median SWDI (cut-off: 4.36) and sputum eosinophilia: SWDILowEos-ABO (n=10), SWDIHighEos-ABO (n=15), SWDILownonEos-ABO (n=38) and SWDIHighnonEos-ABO (n=33). During follow-up, the annualized frequency of AE was highest in SWDILowEos-ABO but lowest in SWDIHighEos-ABO (P<0.05) (Fig. 4e). Pseudomonas was detected in 30.0% (n=3) of patients in SWDILowEos-ABO group. The median time to the first AE cannot be calculated because of the limited episodes of AE in SWDIHighEos-ABO. Compared with SWDIHighEos-ABO, both SWDILowEos-ABO (HR: 8.74, 95% CI: 2.51–30.45, P<0.001) and SWDIHighnonEos-ABO (HR: 4.00, 95% CI: 1.55–10.34, P=0.039) exhibited a significantly shorter time to the first AE. No significant difference was identified among other groups (Fig. 4f).

Bacterial Taxa–Metabolite Interactions in ABO

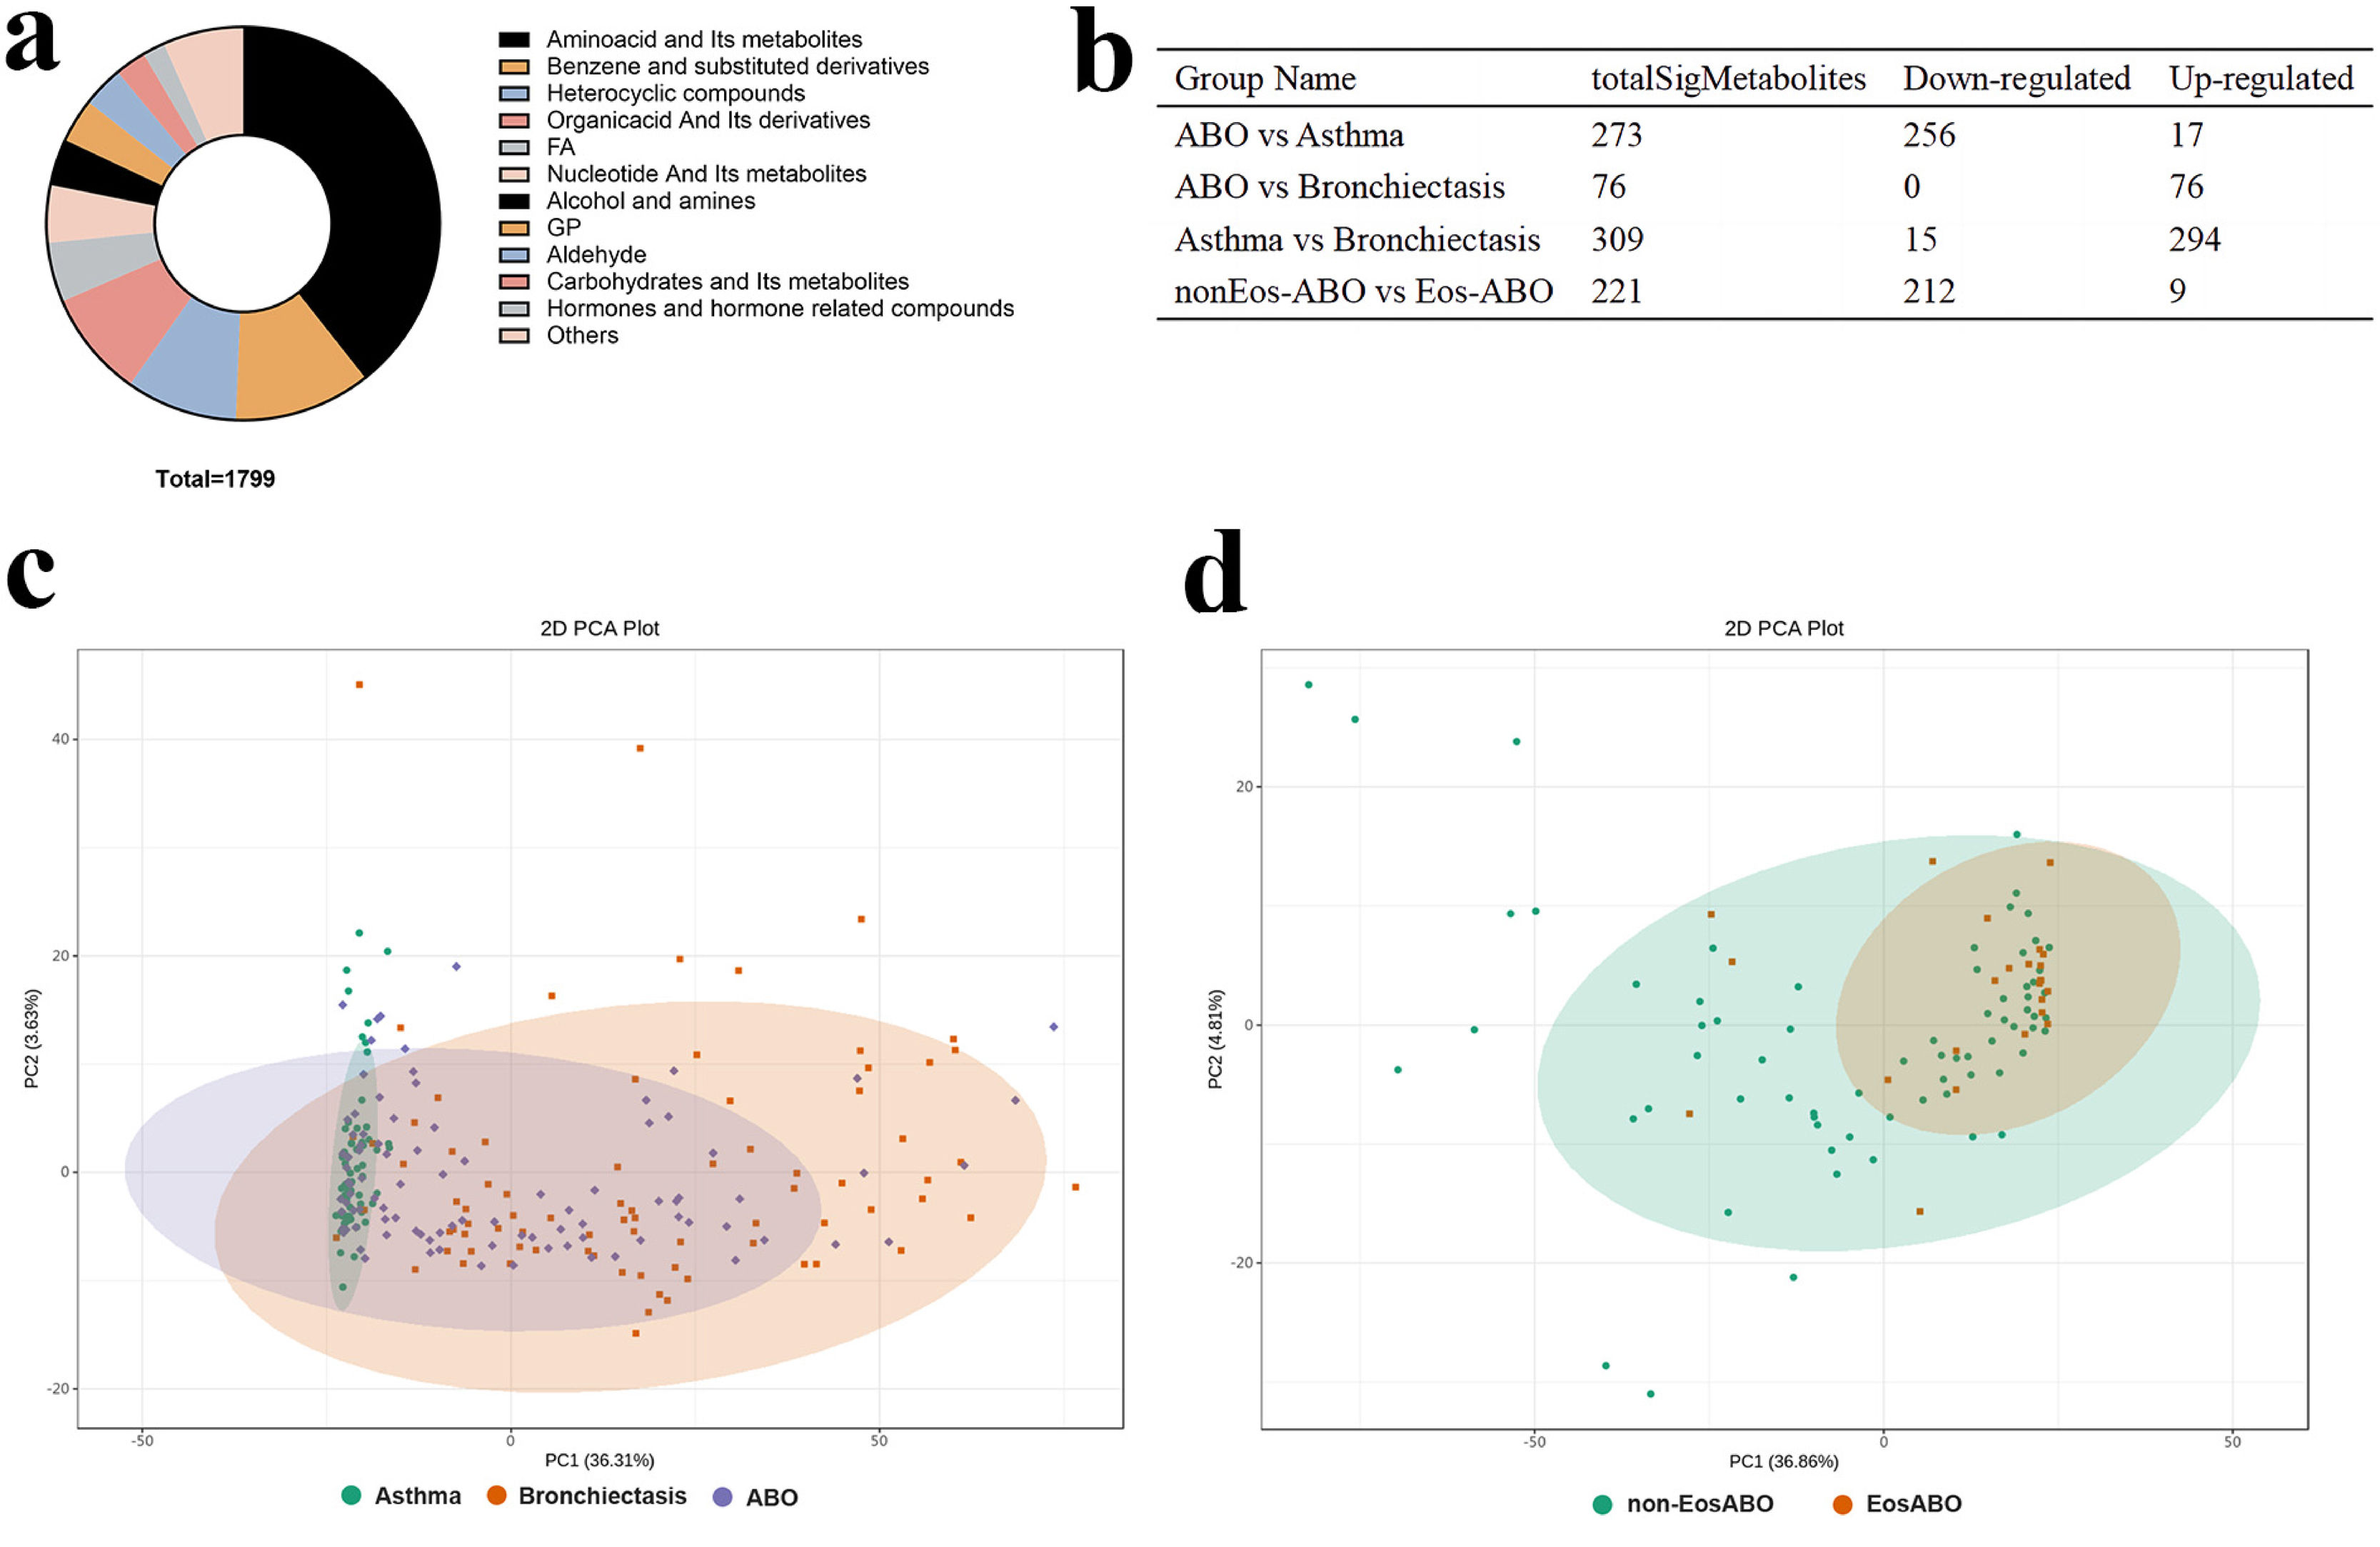
Microbiota metabolites conferred immunomodulatory effects on CRDs.33 We profiled metabolome based on the paired available sputum from 235 patients (61 asthma, 94 ABO and 80 bronchiectasis), totally revealing 1799 metabolites (Fig. E3a). After removal of contaminants (coenzyme, vitamins, carbohydrates and metabolites, heterocyclic compounds and other unannotated metabolites), 719 metabolites were analyzed (Fig. E3b). In PCA plots (Fig. E3c and d), the first (explaining 33.97% of variance) and second principal component (explaining 5.52% of variance) revealed a transition pattern from asthma to ABO and bronchiectasis. Furthermore, metabolomic compositions in Eos-ABO partly separated from nonEos-ABO based on the first (34.19% of variance) and second principal component (5.97% of variance).

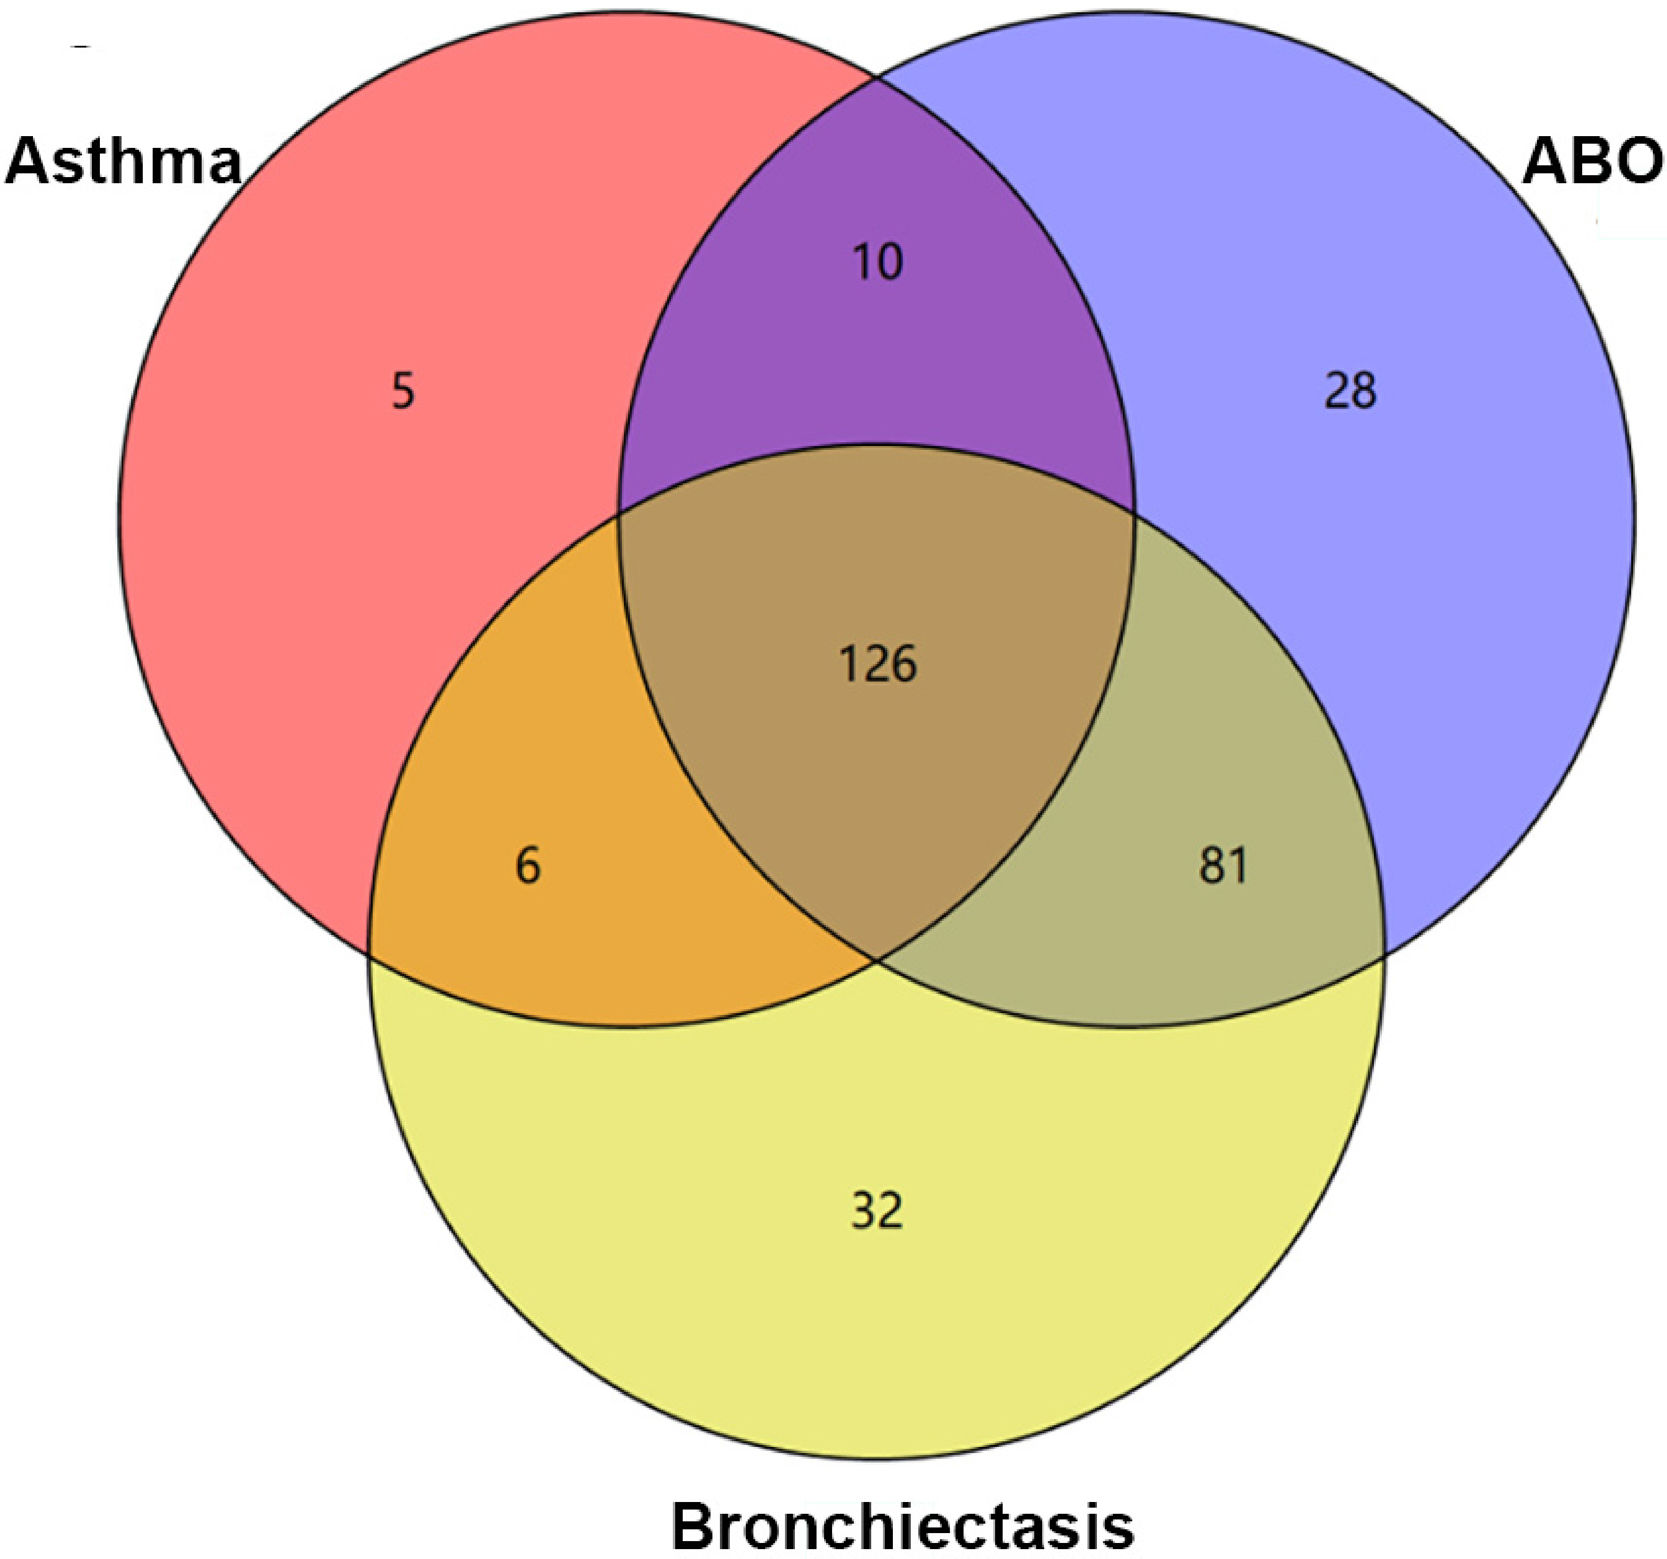
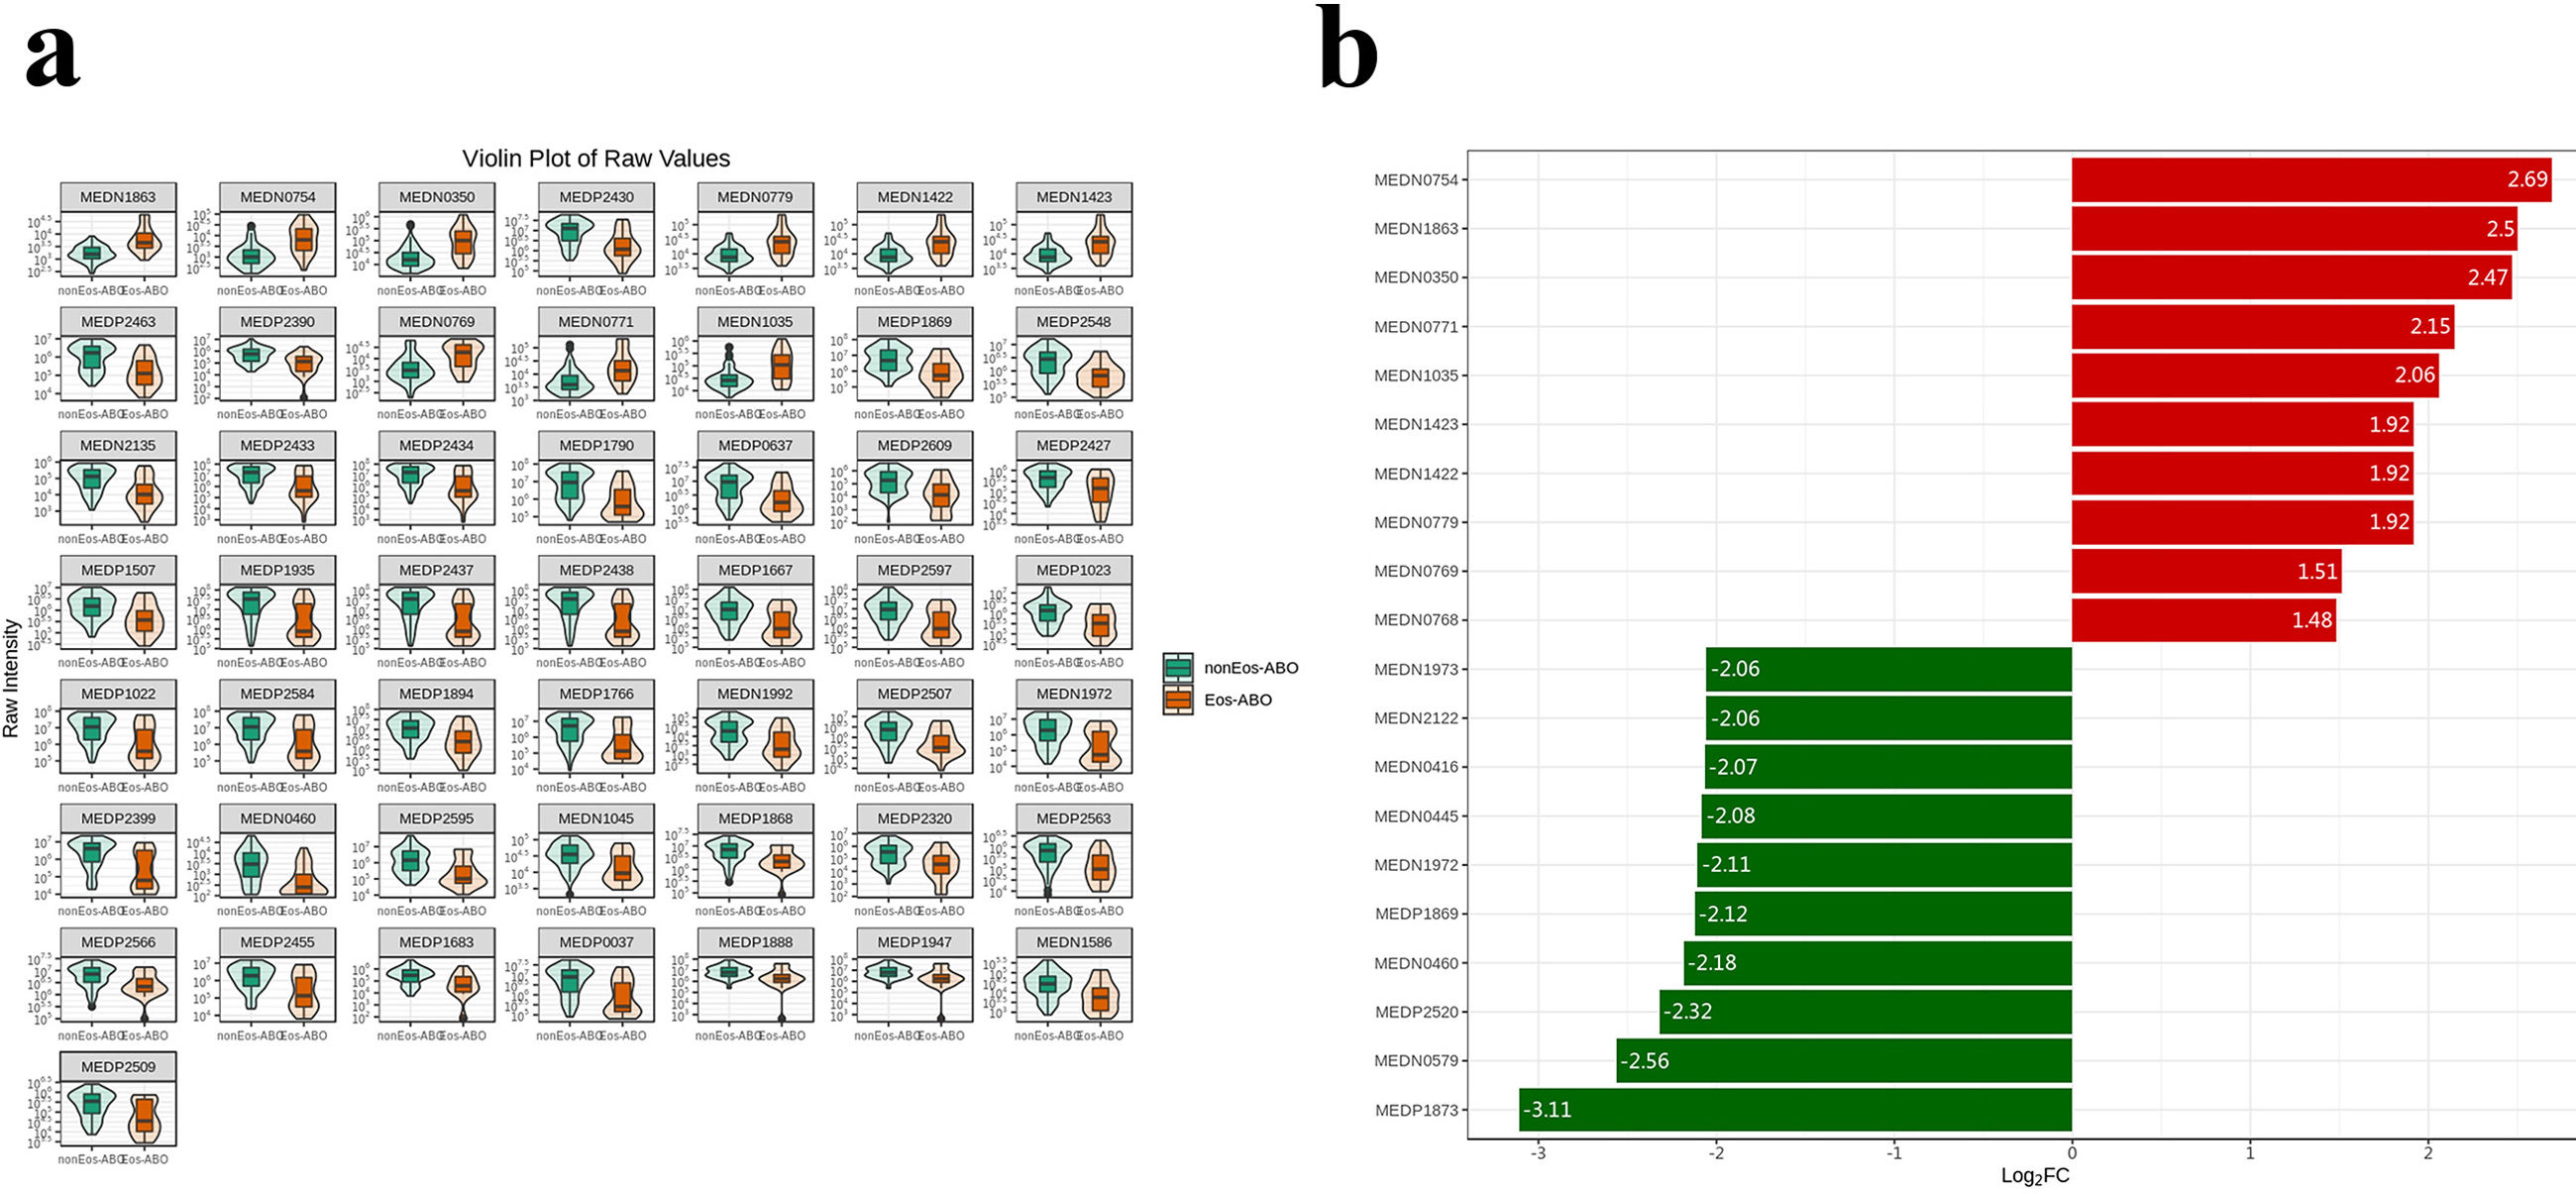
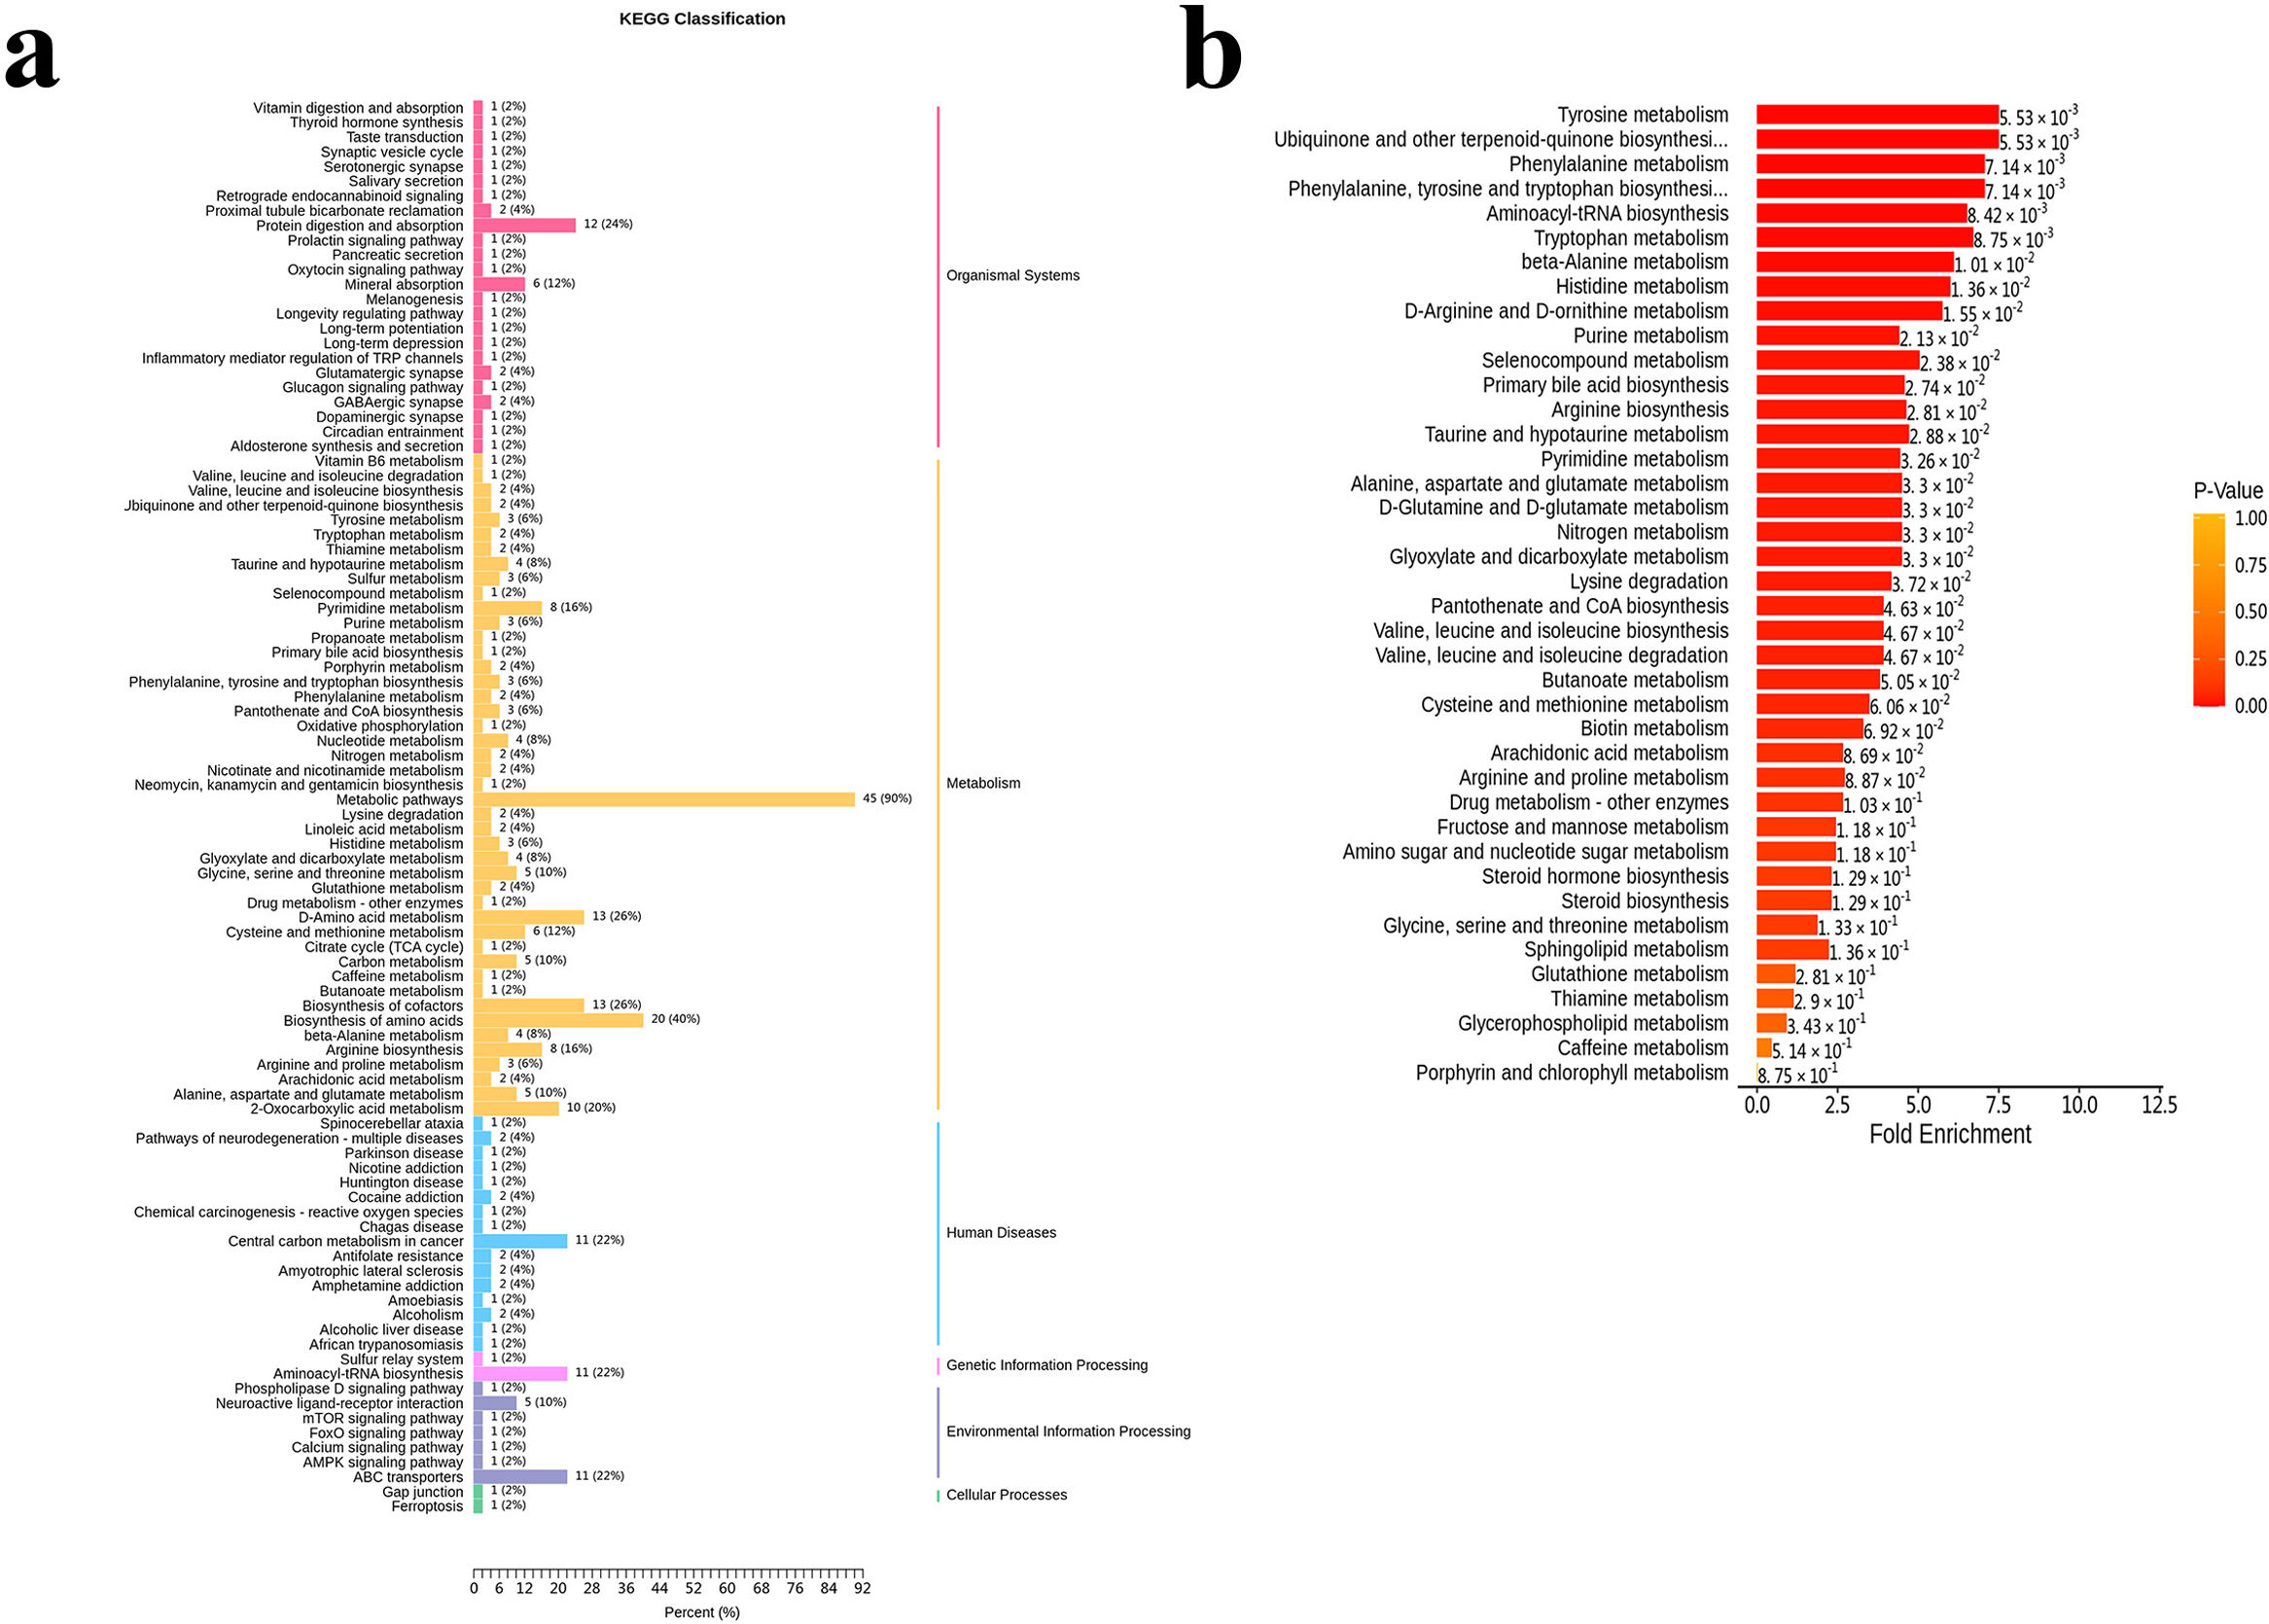
The PCA plot, OPLS-DA plot and violin plot showed some separation in metabolites between Eos-ABO and nonEos-ABO at steady-state (Figs. E3d and E4a and Fig. 5a and b), where 221 differential metabolites (variable importance in projection >1, P<0.05) were identified (9 up-regulated, 212 down-regulated metabolites) (Fig. 5c and Figs. E3b and E4). Differential metabolites were mapped into 96 Kyoto Encyclopedia of Genes and Genomes pathways. These included biosynthesis of amino acids (n=20), cofactors (n=13), D-amino acid metabolism (n=13), protein digestion and absorption (n=12) and ABC transporters (n=11) (Fig. E5). The top 20 significantly enriched pathways are displayed in Fig. 5d. 15-Hydroxylated eicosatetraenoic acid (15-HETE), a precursor of prostaglandin A4, is a pro-inflammatory mediator associated with arachidonic acid metabolism.34–36 The concentration of 15-HETE was highest in asthma, but no significant difference was identified between ABO and bronchiectasis. 15-HETE concentration was higher in Eos-ABO than in nonEos-ABO.

Fig. 5.

Differential sputum metabolomic features in Eos-ABO and nonEos-ABO. (a) OPLS-DA score plot. (b) OPLS-DA validation plot (intercept: Q2=0.128, P=0.010). (c) Volcano plot showing the differentially enriched [log2 (fold-change) on X-axis] and differentially expressed [−log10 (FDR-P) on Y-axis] metabolites in Eos-ABO and nonEos-ABO. Green represents down-regulated metabolites, while red represents up-regulated metabolites in Eos-ABO. (d) Bubble plot of the top 20 enriched metabolic pathways. Rich factor is the ratio of the number of differentially expressed metabolites in the corresponding pathway to the total number of metabolites detected and annotated by the pathway. The higher value of the rich factor, the greater the degree of enrichment. P value is the hypergeometric test P value. The closer to 0, the greater significance of the enrichment. The count represents the number of differentially significant metabolites enriched into the corresponding pathway. (e) Spearman's correlation analysis between the top differential taxa and metabolites. The Spearman's correlation coefficient r is represented by the intensity of the color, with green indicating a positive correlation and red negative correlation. Abbreviations: OPLS-DA: orthogonal partial least-squares discriminant analysis; FDR: false-discovery rate; Eos-ABO: eosinophilic asthma–bronchiectasis overlap; nonEos-ABO: non-eosinophilic asthma–bronchiectasis overlap.

(0.91MB).

Finally, we explored the microbial–metabolic pathways. LEfSe analysis identified the taxa with the greatest differences in relative abundance between Eos-ABO and nonEos-ABO (Fig. E6). Of 29 taxa with log10LDA scores greater than 2.0, 15 taxa at family or genus levels were selected for correlation analysis with the top 50 differential metabolites. Specifically, the relative abundance of Enterobacteriaceae correlated negatively with the concentration of 15-HETE (Fig. 5e and Table E4).

Discussion

Both microbiota and metabolites were well distinguished among asthma, ABO and bronchiectasis, and between Eos-ABO and nonEos-ABO at steady-state. The microbiota correlated with the clinical characteristics, and predicted longitudinal outcomes. Integrating microbiota diversity and eosinophilic endotypes led to the identification of SWDILowEos-ABO, an exacerbation-prone subgroup. More microbiota interactions were identified in nonEos-ABO than in Eos-ABO, and Pseudomonas exhibited more prominent negative correlation with other taxa in nonEos-ABO. These might be partially interpreted by some putative microbiota–metabolite associations (e.g. the Enterobacteriaceae–15-HETE associations).

Compared with asthma and bronchiectasis, ABO exhibited an intermediate SWDI and weighted Unifrac distance, revealing the enrichment of Pseudomonadaceae that correlated with bronchiectasis severity. These echoed published findings that enrichment of Pseudomonas spp. and lower SWDI closely correlated with greater symptom burdens and poorer lung function in bronchiectasis.13 Both Pseudomonadaceae and Rothia that yielded the highest discriminative capacity of ABO. Some genera reportedly discriminated severe from non-severe asthma.37,38 This included the enrichment of Streptococcus37 and Pseudomonas38 in severe asthma. Contrasting with findings from COPD–bronchiectasis association,39 we did not identify a greater similarity of microbiota and metabolomic compositions between ABO and bronchiectasis than asthma.

We identified more microbiota interactions in Eos-ABO than in nonEos-ABO, and more pronounced negative correlation between Pseudomonas and other taxa in Eos-ABO. Microbiota diversity alone was insufficient to explain for exacerbation onset,15 and microbiota interactions were more prominent than the diversity or relative abundance at exacerbation.15 Regarding microbiota compositions, both Rothia and Streptococcus were two most discriminative genera in Eos-ABO. Streptococcus, Rothia, and Porphyromonas were reportedly enriched in eosinophilic asthma17 and Enterobacteriaceae and Actinobacteriaceae were enriched in eosinophilic asthma.38 Our findings echoed those reported in bronchiectasis, which yielded significant correlations between blood eosinophilia and microbiota compositions dominated with Streptococcus and Pseudomonas, and the enrichment of Neisseria, Rothia, and Pseudomonas.18 Collectively, Rothia and Streptococcus might be microbiota signatures of eosinophilic endotype in ABO. Moreover, our study highlighted the complexity of microbiota–metabolite associations. The 15-HETE has been associated with arachidonic acid metabolism, exhibited a more pronounced elevation in Eos-ABO compared with nonEos-ABO. The elevated 15-HETE levels34–36 was indicative of an excessive allergic inflammatory response in Eos-ABO.

ABO reportedly exhibited higher future risks of AE compared with bronchiectasis or asthma.4 However, the risk of AE did not differ between Eos-ABO and nonEos-ABO. A core controversy pertains to the roles of eosinophils: “friend” vs. “foe”. Blood eosinophilia was associated with shorter time to the next AE in bronchiectasis,18 but blood eosinophils <100/μL and chronic bronchial infection were independently associated with the risk of pneumonia in COPD.40 Hence, bacterial infection might confound the association between blood eosinophilia and AE risk. Here, eosinophilia predisposed to increased AE risks in patients with lower SWDI but mitigated the risk of AE among those with higher SWDI. Therefore, anti-inflammatory treatment targeting at T2 inflammation in ABO should be tailored to the microbiota diversity.

Some limitations should be acknowledged. First, selection bias cannot be precluded because we solely enrolled outpatients with predominant features of bronchiectasis (73% of patients with ABO). Second, some AE events might have been underreported despite regular telephone or hospital visits. Third, the existing criteria for defining AE in ABO might preferentially reflect bronchiectasis instead of asthma exacerbations. Fourth, age- and sex-matched healthy controls were not enrolled. Fifth, metagenome sequencing might help identify pathobionts that differentiate asthma from bronchiectasis and ABO. Sixth, the inclusion of induced sputum might have confounded some of microbiota/metabolite findings.

In summary, integration of microbiota and metabolome profiles could identify molecular underpinnings of the heterogeneity of ABO, which in conjunction with inflammatory endotyping, can inform future risk of AE and personalized management of ABO.

CRediT Authorship Contribution Statement

X.X.Z., J.H.H., Z.F.H, C.Z.M and W.J.G. drafted the manuscript; X.X.Z., Z.F.H., and W.J.G. contributed to conception and design; X.X.Z., Z.F.H., Z.M.C., Z.H.L., C.X.P., L.J.C., Y.H., H.M.L., M.X.S. and J.H.H. were responsible for patient recruitment and data collection; X.X.Z., Z.F.H., and J.H.H. performed data analysis; W.J.G. critically revised the manuscript.

Consent for Publication

All patients signed written informed consent.

Declaration of Generative AI and AI-assisted Technologies in the Writing Process

No artificial intelligence was involved.

Funding

This study was supported by the National Natural Science Foundation – Outstanding Youth Foundation [No. 82222001], National Natural Science Foundation [No. 82470040], Major Project of Guangzhou National Laboratory [No. GZNL2024A02003], R&D Program of Guangzhou National Laboratory [SRPG22-021], Guangzhou Science and Technology Plans [No. 2024A04J6495, 2024A03J1206 and 2023B03J0407], Plan on Enhancing Scientific Research in Guangzhou Medical University [grant number not applicable] (one each to Prof. Guan and Dr. He), and Guangzhou Science and Technology Plans [No. 202201020517, to Dr. Zhang].

Conflict of Interests

The authors declare not to have any conflicts of interest that may be considered to influence directly or indirectly the content of the manuscript.

Data Availability

All data generated or analysed during this study are included in this published article [details are provided in Online Supplement or deposited in GitHub under https://github.com/Dr-Hezf/Dr-Zhang-ABO-microbiota.git.].

Acknowledgements

We thank Wei-juan Shi, Xiao-fen Zhang, Ri-lan Zhang, Sheng-zhu Lin and Shu-jun Guo (The First Affiliated Hospital of Guangzhou Medical University) for their valuable contribution on subject recruitment. In addition, graphical abstract created with BioRender.com. Ethics approval was obtained from The First Affiliated Hospital of Guangzhou Medical University (Medical Ethics [2012] the 33th; [2020] the 156th).

Appendix B
Supplementary Data

The following are the supplementary data to this article:

References
[1]
Global Initiative for Asthma.
Global strategy for asthma management and prevention.
(2018),
[2]
Bronchiectasis Expert Consensus Writing Group, Pulmonary Infection Assembly, Chinese Thoracic Society.
Expert consensus on the diagnosis and treatment of adult bronchiectasis in China.
Chin J Tubere Respir Dis, 44 (2021), pp. 311-321
[3]
A. Tiotiu, M.A. Martinez-Garcia, P. Mendez-Brea, I. Roibas-Veiga, F.J. Gonzalez-Barcala.
Does asthma–bronchiectasis overlap syndrome (ABOS) really exist?.
J Asthma, 60 (2023), pp. 1935-1941
[4]
G. Lan, C. Huang, Y. Liu, Y. Feng, Y. Ni, G. Shi.
How does comorbid bronchiectasis affect asthmatic patients? A meta-analysis.
J Asthma, 58 (2021), pp. 1314-1328
[5]
N.Y. Kim, C.H. Lee, K.N. Jin, H.W. Lee, E.Y. Heo, D.K. Kim, et al.
Clinical deterioration and lung function change in patients with concomitant asthma and bronchiectasis.
J Allergy Clin Immunol Pract, 10 (2022),
[6]
S. Ferri, C. Crimi, R. Campisi, G. Cacopardo, G. Paoletti, F. Puggioni, et al.
Impact of asthma on bronchiectasis severity and risk of exacerbations.
J Asthma, 59 (2022), pp. 469-475
[7]
A.T. Hill, A.L. Sullivan, J.D. Chalmers, A. De Soyza, S.J. Elborn, A.R. Floto, et al.
British Thoracic Society Guideline for bronchiectasis in adults.
[8]
X.X. Zhang, J.H. He, C.X. Pan, Z.F. He, H.M. Li, Z.H. Lin, et al.
Bacteria and viruses and clinical outcomes of asthma–bronchiectasis overlap syndrome: a cohort study.
Clin Transl Allergy, 14 (2024), pp. e12331
[9]
S.S. Madapoosi, C. Cruickshank-Quinn, K. Opron, J.R. Erb-Downward, L.A. Begley, G. Li, et al.
Lung microbiota and metabolites collectively associate with clinical outcomes in milder stage chronic obstructive pulmonary disease.
Am J Respir Crit Care Med, 206 (2022), pp. 427-439
[10]
Y.J. Huang, C.E. Nelson, E.L. Brodie, T.Z. Desantis, M.S. Baek, J. Liu, et al.
Airway microbiota and bronchial hyperresponsiveness in patients with suboptimally controlled asthma.
J Allergy Clin Immunol, 127 (2011),
[11]
Y.J. Huang, S. Nariya, J.M. Harris, S.V. Lynch, D.F. Choy, J.R. Arron, et al.
The airway microbiome in patients with severe asthma: associations with disease features and severity.
J Allergy Clin Immunol, 136 (2015), pp. 874-884
[12]
W.J. Guan, J.J. Yuan, H.M. Li, Y.H. Gao, Y. Huang, C.L. Chen, et al.
Proteobacteria community compositions correlate with bronchiectasis severity.
Int J Tuberc Lung Dis, 22 (2018), pp. 1095-1105
[13]
A.J. Dicker, M. Lonergan, H.R. Keir, A.H. Smith, J. Pollock, S. Finch, et al.
The sputum microbiome and clinical outcomes in patients with bronchiectasis: a prospective observational study.
Lancet Respir Med, 9 (2021), pp. 885-896
[14]
T.E. Woo, R. Lim, A.A. Heirali, N. Acosta, H.R. Rabin, C.H. Mody, et al.
A longitudinal characterization of the non-cystic fibrosis bronchiectasis airway microbiome.
[15]
M. Mac Aogáin, J.K. Narayana, P.Y. Tiew, N.A.B.M. Ali, V.F.L. Yong, T.K. Jaggi, et al.
Integrative microbiomics in bronchiectasis exacerbations.
Nat Med, 27 (2021), pp. 688-699
[16]
Z. Yan, B. Chen, Y. Yang, X. Yi, M. Wei, G. Ecklu-Mensah, et al.
Multi-omics analyses of airway host–microbe interactions in chronic obstructive pulmonary disease identify potential therapeutic interventions.
Nat Microbiol, 7 (2022), pp. 1361-1375
[17]
S.L. Taylor, L.E.X. Leong, J.M. Choo, S. Wesselingh, I.A. Yang, J.W. Upham, et al.
Inflammatory phenotypes in patients with severe asthma are associated with distinct airway microbiology.
J Allergy Clin Immunol, 141 (2018),
[18]
A. Shoemark, M. Shteinberg, A. De Soyza, C.S. Haworth, H. Richardson, Y. Gao, et al.
Characterization of eosinophilic bronchiectasis: a European Multicohort Study.
Am J Respir Crit Care Med, 205 (2022), pp. 894-902
[19]
S. Aliberti, P.C. Goeminne, A.E. O’Donnell, T.R. Aksamit, H. Al-Jahdali, A.F. Barker, et al.
Criteria and definitions for the radiological and clinical diagnosis of bronchiectasis in adults for use in clinical trials: international consensus recommendations.
Lancet Respir Med, 10 (2022), pp. 298-306
[20]
D.B. Reiff, A.U. Wells, D.H. Carr, P.J. Cole, D.M. Hansell.
CT findings in bronchiectasis: limited value in distinguishing between idiopathic and specific types.
Am J Roentgenol, 165 (1995), pp. 261-267
[21]
J.D. Chalmers, P. Goeminne, S. Aliberti, M.J. McDonnell, S. Lonni, J. Davidson, et al.
The bronchiectasis severity index: an international derivation and validation study.
Am J Respir Crit Care Med, 189 (2014), pp. 576-585
[22]
M.A. Martinez-Garcia, R.A. Athanazio, R. Girón, L. Máiz-Carro, D. de la Rosa, C. Olveira, et al.
Predicting high risk of exacerbations in bronchiectasis: the E-FACED score.
Int J Chron Obstruct Pulmon Dis, 12 (2017), pp. 275-284
[23]
D. Araújo, M. Shteinberg, S. Aliberti, P.C. Goeminne, A.T. Hill, T. Fardon, et al.
Standardised classification of the aetiology of bronchiectasis using an objective algorithm.
[24]
M.A. Ghebre, M. Bafadhel, D. Desai, S.E. Cohen, P. Newbold, L. Rapley, et al.
Biological clustering supports both “Dutch” and “British” hypotheses of asthma and chronic obstructive pulmonary disease.
J Allergy Clin Immunol, 135 (2015), pp. 63-72
[25]
J.L. Simpson, R. Scott, M.J. Boyle, P.G. Gibson.
Inflammatory subtypes in asthma: assessment and identification using induced sputum.
[26]
Y.H. Gao, W.J. Guan, G. Xu, Z.Y. Lin, Y. Tang, Z.M. Lin, et al.
The role of viral infection in pulmonary exacerbations of bronchiectasis in adults: a prospective study.
Chest, 147 (2015), pp. 1635-1643
[27]
E. Bolyen, J.R. Rideout, M.R. Dillon, N.A. Bokulich, C.C. Abnet, G.A. Al-Ghalith, et al.
Reproducible, interactive, scalable and extensible microbiome data science using QIIME 2.
Nat Biotechnol, 37 (2019), pp. 852-857
[28]
B.J. Callahan, P.J. McMurdie, M.J. Rosen, A.W. Han, A.J. Johnson, S.P. Holmes.
DADA2: high-resolution sample inference from Illumina amplicon data.
Nat Methods, 13 (2016), pp. 581-583
[29]
Z. Wang, N. Locantore, K. Haldar, M.Y. Ramsheh, A.S. Beech, W. Ma, et al.
Inflammatory endotype-associated airway microbiome in chronic obstructive pulmonary disease clinical stability and exacerbations: a multicohort longitudinal analysis.
Am J Respir Crit Care Med, 203 (2021), pp. 1488-1502
[30]
J. Friedman, E.J. Alm.
Inferring correlation networks from genomic survey data.
[31]
G.B. Gloor, J.M. Macklaim, V. Pawlowsky-Glahn, J.J. Egozcue.
Microbiome datasets are compositional: and this is not optional.
Front Microbiol, 8 (2017), pp. 2224
[32]
F. Lyu, F. Han, C. Ge, W. Mao, L. Chen, H. Hu, et al.
OmicStudio: a composable bioinformatics cloud platform with real-time feedback that can generate high-quality graphs for publication.
Imeta, 2 (2023), pp. e85
[33]
K.F. Budden, S.D. Shukla, S.F. Rehman, K.L. Bowerman, S. Keely, P. Hugenholtz, et al.
Functional effects of the microbiota in chronic respiratory disease.
Lancet Respir Med, 7 (2019), pp. 907-920
[34]
P. Bedi, K. Ziegler, P.D. Whitfield, D. Davidson, A.G. Rossi, A.T. Hill.
Dysregulation of prostaglandins, leukotrienes and lipoxin A(4) in bronchiectasis.
[35]
B. Wang, L. Wu, J. Chen, L. Dong, C. Chen, Z. Wen, et al.
Metabolism pathways of arachidonic acids: mechanisms and potential therapeutic targets.
Signal Transduct Target Ther, 6 (2021), pp. 94
[36]
X. Xu, J. Li, Y. Zhang, L. Zhang.
Arachidonic acid 15-lipoxygenase: effects of its expression metabolites, and genetic and epigenetic variations on airway inflammation.
Allergy Asthma Immunol Res, 13 (2021), pp. 684-696
[37]
Q. Zhang, M. Cox, Z. Liang, F. Brinkmann, P.A. Cardenas, R. Duff, et al.
Airway microbiota in severe asthma and relationship to asthma severity and phenotypes.
PLoS One, 11 (2016), pp. e0152724
[38]
N. Li, R. Qiu, Z. Yang, J. Li, K.F. Chung, N. Zhong, et al.
Sputum microbiota in severe asthma patients: relationship to eosinophilic inflammation.
Respir Med, 131 (2017), pp. 192-198
[39]
J.T. Huang, E. Cant, H.R. Keir, A.K. Barton, E. Kuzmanova, M. Shuttleworth, et al.
Endotyping chronic obstructive pulmonary disease bronchiectasis, and the “chronic obstructive pulmonary disease-bronchiectasis association”.
Am J Respir Crit Care Med, 206 (2022), pp. 417-426
[40]
M.A. Martinez-Garcia, R. Faner, G. Oscullo, D. de la Rosa, J.J. Soler-Cataluña, M. Ballester, et al.
Inhaled steroids, circulating eosinophils chronic airway infection, and pneumonia risk in chronic obstructive pulmonary disease. A network analysis.
Am J Respir Crit Care Med, 201 (2020), pp. 1078-1085

These authors contributed equally to the work.

Copyright © 2025. SEPAR
Archivos de Bronconeumología
Article options
Tools

Are you a health professional able to prescribe or dispense drugs?