Journal Information
Visits
528
Original Article
Full text access
Available online 7 March 2025
Pulmonary Rehabilitation in Patients With Post-Tuberculosis Lung Disease: A Prospective Multicentre Study
Visits
528
Denise Rossato Silvaa, Fernanda Carvalho de Queiroz Mellob, Tatiana Senna Galvãoc, Margareth Dalcolmod, Ana Paula Cere dos Santose, Diego de Faria Magalhães Torresf, Larissa Andre de Meirelles Café de Jesusc, Dina Viscag,h, Rosella Centisi, Lia D’Ambrosioj, Anh Tuan Dinh-Xuank, Giovanni Battista Migliorii,
Corresponding author
a Faculdade de Medicina, Universidade Federal do Rio Grande do Sul (UFRGS), Porto Alegre, Brazil
b Instituto de Doenças do Tórax, Universidade Federal do Rio de Janeiro (UFRJ), Rio de Janeiro, Brazil
c Universidade Federal da Bahia, Salvador, Brazil
d Centro de Referência Hélio Fraga, Fiocruz, Rio de Janeiro, Brazil
e Programa de Pós-Graduação em Ciências Pneumológicas da UFRGS, Porto Alegre, Brazil
f Hospital Universitário Clementino Fraga Filho, UFRJ, Rio de Janeiro, Brazil
g Department of Medicine and Cardiopulmonary Rehabilitation, Istituti Clinici Scientifici Maugeri IRCCS, Tradate, Italy
h Department of Medicine and Surgery, University of Insubria, Varese, Italy
i Servizio di Epidemiologia Clinica delle Malattie Respiratorie, Istituti Clinici Scientifici Maugeri, IRCCS, Tradate, Italy
j Public Health Consulting Group, Lugano, Switzerland
k Department of Respiratory and Sleep Medicine, Cochin Hospital, University Paris Cité, 27 rue du faubourg Saint-Jacques, 75014 Paris, France
Ver más
This item has received
Article information
Abstract
Full Text
Bibliography
Download PDF
Statistics
Figures (2)
Tables (5)
Table 1. Characteristics of the Study Population.
Tables
Table 2. Comparison of Pulmonary Function Tests Between Groups 1 (Rehabilitation) and 2 (No Rehabilitation).
Tables
Table 3. Comparison of Pulmonary Function Tests Between COPD and No COPD Patients Who Underwent Rehabilitation.
Tables
Table 4. Comparison of Pulmonary Function Tests Between COPD and No COPD Patients Who Did Not Underwent Rehabilitation.
Tables
Table 5. Comparison of pulmonary function tests according to COPD severity in Groups 1 and 2.
Tables
Show moreShow less
Abstract
Introduction

The majority of the studies on pulmonary rehabilitation (PR) in post-tuberculosis lung disease (PTLD) were from a single center, had a low sample size and/or did not allow a complete functional evaluation before and after PR program (PRP). The objective of this study was to evaluate if PTLD patients had benefits from PR in a large collaborating multicentre study conducted in reference centers in Brazil, Italy and France.
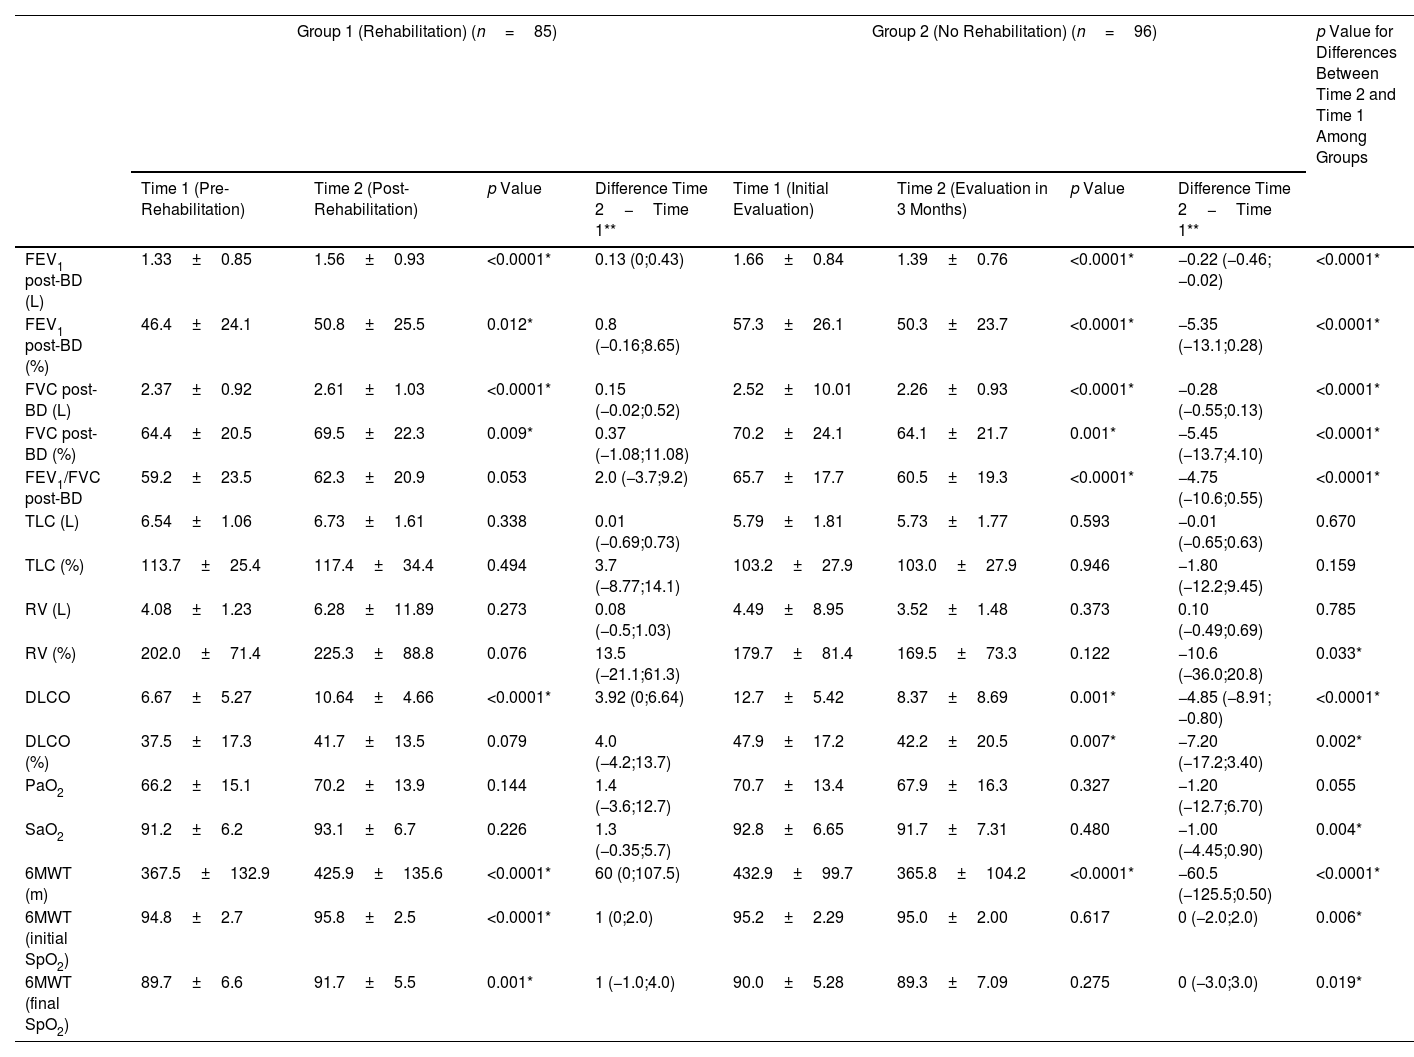
Methods

PTLD patients underwent a comprehensive 5-week PRP (Group 1), and were compared with non-rehabilitated patients (Group 2). Pulmonary function tests, 6-minute walk test (6MWT), and arterial blood gas analysis were measured two times: before and at the end of the PRP (Group 1), and at the beginning of the follow-up and after 3 months (Group 2).
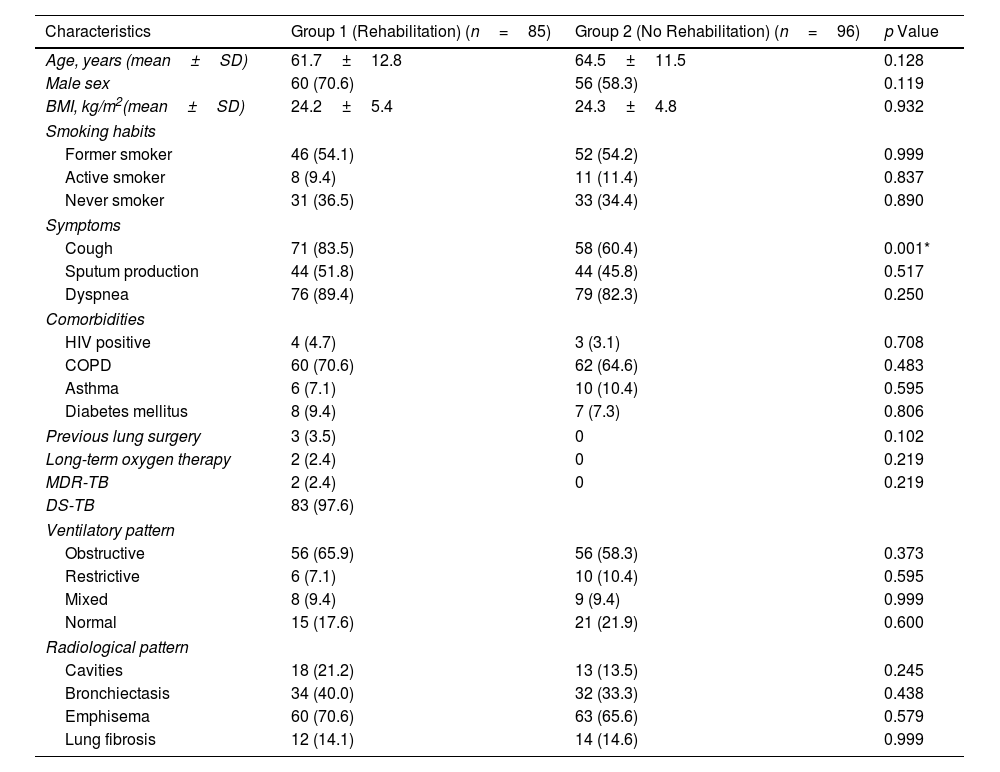
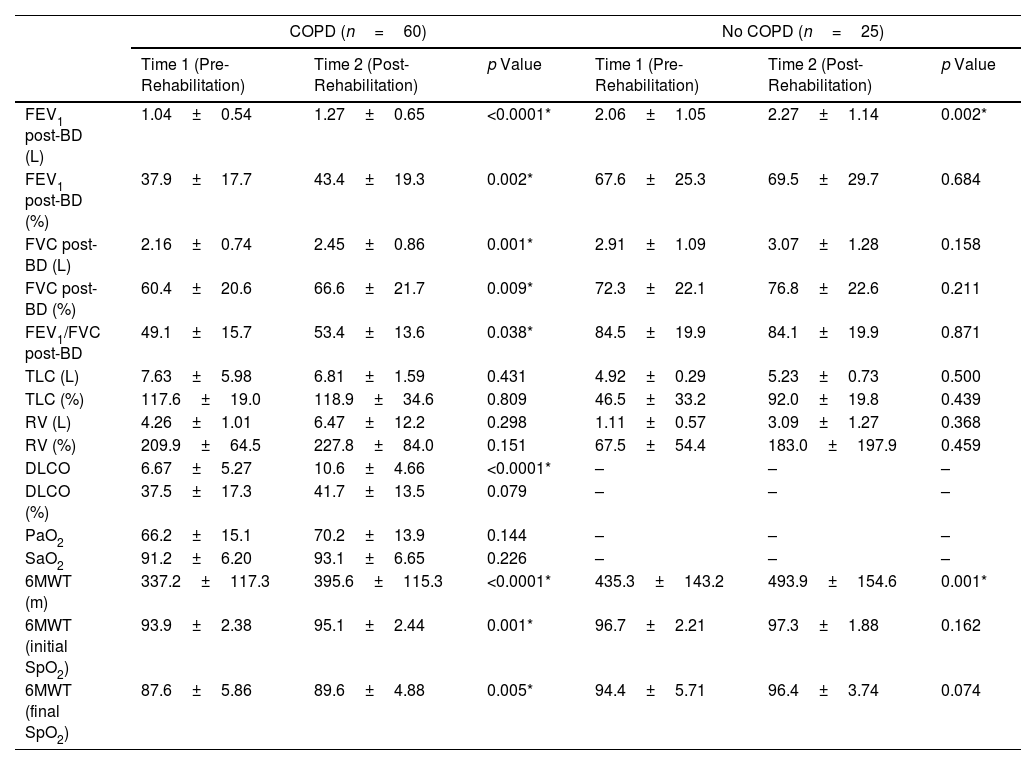
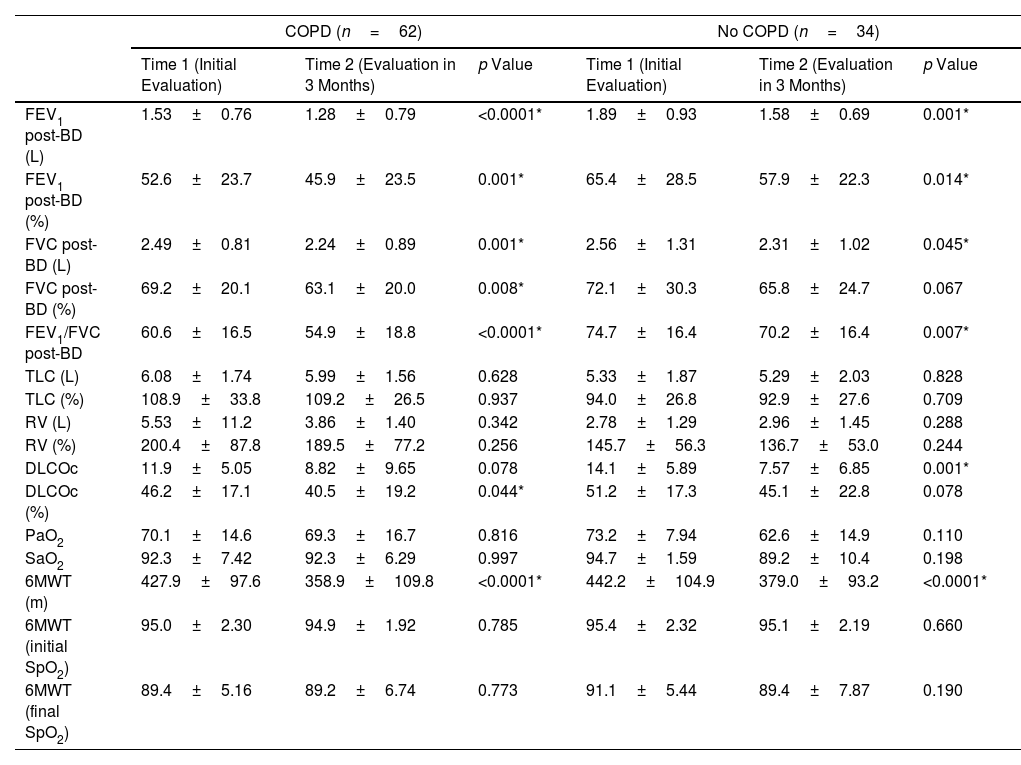
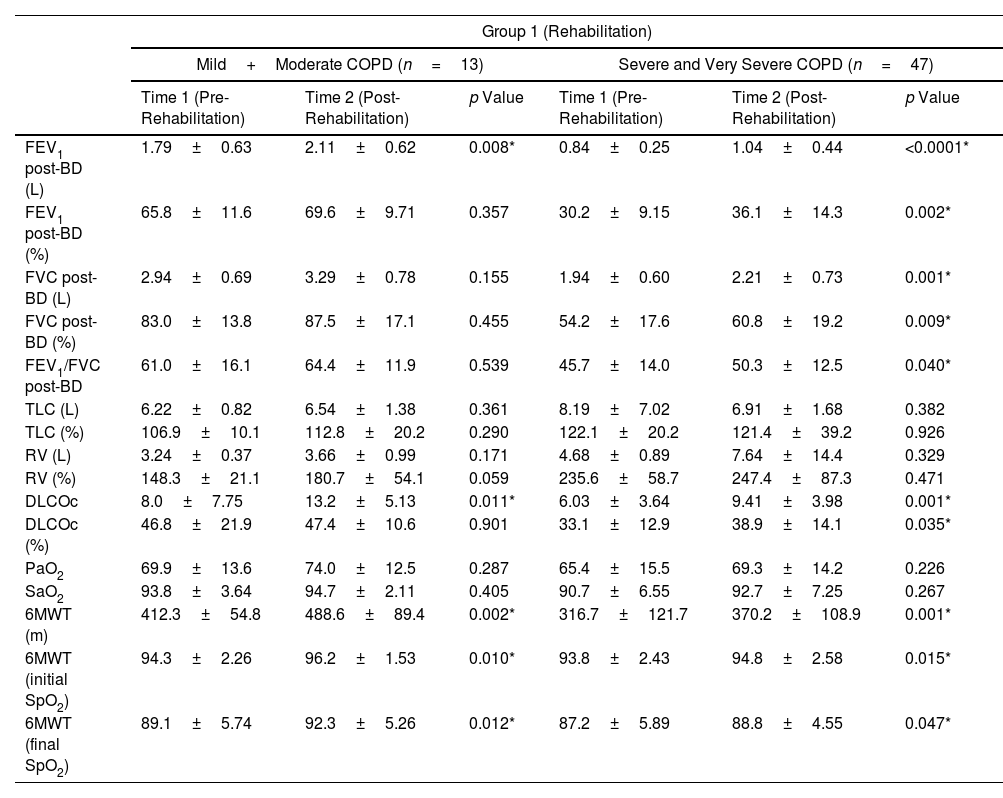
Results

Eighty-five patients were included in Group 1 and 96 patients in Group 2. Several functional parameters improved after rehabilitation, such as forced expiratory volume in one second (FEV1), forced vital capacity (FVC), diffusing capacity of the lung for carbon monoxide (DLCO), distance walked in 6MWT, the initial and final SaO2 at 6MWT. In Group 2, several functional parameters decreased after 3 months.

Conclusions

We demonstrated the benefits from PRP in patients with PTLD, including improvements in lung function and in exercise capacity. National TB programs should ensure the availability of accessible and quality post-treatment PRP for PTLD patients.

Keywords:
Tuberculosis
Mycobacterium tuberculosis
Post-tuberculosis lung disease
Pulmonary rehabilitation
Graphical abstract
Full Text
Introduction

Worldwide, more than 10 million people fell ill with tuberculosis (TB) every year, and a total of 1.25 million people died from TB in 2023. However, TB is preventable and curable; with current recommended treatments, more than 85% of people with TB can be cured. In 2020, it was estimated that there were 155 million TB survivors still alive globally.1

After treatment completion, up to 50% of patients (and more than 70% of those with multidrug resistant TB) develop post-TB lung disease (PTLD), defined as “evidence of chronic respiratory abnormality, with or without symptoms, attributable at least in part to previous (pulmonary) TB.”2,3 The most frequently reported sequelae of pulmonary TB include radiological findings (cavities, bronchiectasis, fibrosis), chronic obstructive pulmonary disease (COPD), spirometry abnormalities (obstruction, restriction, and mixed patterns), in addition to psychosocial challenges, and reduced health-related quality of life.4–6 It has been estimated that substantial patients’ suffering happens after the completion of anti-TB treatment: out of 122 million Disability Adjusted Life Years (DALYs) due to incident TB disease estimated in 2019, 58 million DALYs have been attributed to PTLD, representing 47% of the total burden estimate.7

According to World Health Organization (WHO)’s policy,5 rehabilitation is an essential health service and should be available for people affected by TB-associated disability. Pulmonary rehabilitation (PR) has been proven to be helpful in patients with other chronic respiratory diseases, such as COPD. Although some evidence exists on the effectiveness of rehabilitation in PTLD patients, the present guidance6,8,9 was based on small cohorts from a single center (with a sample size not exceeding 20–30 cases, often not evaluating all recommended variables before and after rehabilitation) and assuming analogies with the efficacy/effectiveness of rehabilitation observed in COPD patients.10–15 Furthermore, no previous study had a control Group of non-rehabilitated patients and was able to analyze the effectiveness of rehabilitation separately for PTLD with and without COPD (and, in COPD patients, by COPD severity), given that COPD is common among these patients.8

Therefore, taking advantage of the recently published national PTLD management guidelines6 and of the availability of both a large cohort of rehabilitated PTLD patients (evaluated for all the recommended variables) and of a comparable control cohort, the objectives of this study were, in a large collaborating multicentre study conducted in reference centers in Brazil, Italy and France, to evaluate if patients with PTLD had benefits from PR in comparison with non-rehabilitated patients, and to evaluate efficiency/effectiveness of rehabilitation in PTLD patients with and without COPD.

MethodsStudy Location and Design

We conducted a multicentre study, in three Brazilian reference centers: Instituto de Doenças do Tórax (IDT) da Universidade Federal do Rio de Janeiro – Rio de Janeiro (RJ), Hospital Especializado Octávio Mangabeira- Salvador (BA), and Hospital de Clínicas de Porto Alegre – Porto Alegre (RS) in collaboration with Istituti Clinici Maugeri, Care and Research Institute, Tradate, Italy and the Department of Respiratory and Sleep Medicine. Cochin Hospital. University Paris Cité, Paris, France.

Study Population and Data Collection

Consecutive adult patients (>18 years) with a history of TB and PTLD enrolled in a PR Program (PRP) were prospectively included in the study between January 2023 and August 2024. The inclusion criteria were patients with pulmonary TB, with bacteriological confirmation, and all were cured or achieved treatment success (cured+treatment completed) as per WHO definition.1 The exclusion criteria were patients unable to attend PRP sessions. Definitions and procedures were derived from the Sociedade Brasileira de Pneumologia e Tisiologia (SBPT) guidelines on PTLD management.6 We compared these patients (Group 1) with a cohort of non-rehabilitated patients, that were followed-up for one year and evaluated at three months for the purposes of this analysis (Group 2). These patients had monthly appointments.

A study protocol (Fig. 1) was approved and pre-tested in 10 patients. Patients underwent a comprehensive outpatient-based 5-week PRP (25 days, not necessarily consecutive within a maximum time of 3 months) including: (1) At least 15 aerobic training sessions (performed on a cycle ergometer) of 30min in total (5min of warm-up, 20min of aerobic training at maximum Watt calculated according to the Hill formula,16 5min of warm-down). The minimum adherence to the training sessions was 80% (20 days); and (2) At least three individual educational meetings for guidance on inhalation therapy, maintenance physical exercises, daily physical activities, bronchial hygiene techniques and home oxygen therapy were conducted. As patients need to travel to the hospital for rehabilitation, and this is done using their own resources, they do not always have the financial means to pay for transportation 3–5 times a week. This is the rationale for the choice to allow patients up to 3 months to complete a 5-week intervention program.

Fig. 1.

Study protocol.

(0.24MB).

All patients were assessed twice (before and at the end of the PRP at month 3 for the Group 1, and at the beginning of the follow-up and after 3 months, for the Group 2),6,8 including: (1) Spirometry, lung volumes/capacities and measurement of the diffusing capacity of the lung for carbon monoxide (DLCO), according to the guidelines of the American Thoracic Society/European Respiratory Society,17–19 using the reference values for the Brazilian population20; (2) 6-minute walk test (6MWT), performed in a 30-m corridor, with continuous monitoring of peripheral oxygen saturation (SpO2) and heart rate. The distance walked in 6min was recorded. The test was performed according to the guidelines and expected values previously described21,22; and (3) Arterial blood gas analysis, to assess arterial oxygen pressure (PaO2) and arterial oxygen saturation (SaO2).

In addition, a form with demographic data (age, sex, race), body mass index (BMI), smoking habits, presence of symptoms and comorbidities was completed for each patient. COPD severity was classified according to GOLD.23

Statistical Analysis

Data analysis was performed using SPSS 18.0 (Statistical Package for the Social Sciences, Chicago, IL). Data were presented as number of cases, mean±standard deviation (SD), or median with first (Q1) and third (Q3) quartiles. Comparative analyses were carried out between the pre-PRP and post-PRP data after 3 months (Group 1), and between initial evaluation and evaluation after 3 months (Group 2). Categorical comparisons were performed by Chi-square test using Yates's correction if indicated or by Fisher's exact test. Continuous variables were compared using the Wilcoxon signed ranks test. A two-sided p value<0.05 was considered significant for all analyses.

The sample size calculation was based on a previous study,10 which demonstrated an increase in the distance walked from 399m to 467m, with a standard deviation of 63m, after a PRP. Thus, considering an alpha error of 5%, a power of 80% and approximately 20% losses, it will be necessary to include at least 17 patients in the study.

Results

Eighty-five patients were included in Group 1 and 96 patients were included in Group 2. No participants were excluded or withdrawn from the study during the PRP. Table 1 shows the patients’ characteristics. The frequency of coughing was higher in Group 1 (83.5%) than in Group 2 (60.4%) (p=0.001). There were no differences between the groups in all the other variables. In Group 1, three patients were unable to perform 6MWT and 5 patients were unable to perform ABG analysis.

Table 1.

Characteristics of the Study Population.

Characteristics  Group 1 (Rehabilitation) (n=85)  Group 2 (No Rehabilitation) (n=96)  p Value 
Age, years (mean±SD)  61.7±12.8  64.5±11.5  0.128 
Male sex  60 (70.6)  56 (58.3)  0.119 
BMI, kg/m2(mean±SD)  24.2±5.4  24.3±4.8  0.932 
Smoking habits
Former smoker  46 (54.1)  52 (54.2)  0.999 
Active smoker  8 (9.4)  11 (11.4)  0.837 
Never smoker  31 (36.5)  33 (34.4)  0.890 
Symptoms
Cough  71 (83.5)  58 (60.4)  0.001* 
Sputum production  44 (51.8)  44 (45.8)  0.517 
Dyspnea  76 (89.4)  79 (82.3)  0.250 
Comorbidities
HIV positive  4 (4.7)  3 (3.1)  0.708 
COPD  60 (70.6)  62 (64.6)  0.483 
Asthma  6 (7.1)  10 (10.4)  0.595 
Diabetes mellitus  8 (9.4)  7 (7.3)  0.806 
Previous lung surgery  3 (3.5)  0.102 
Long-term oxygen therapy  2 (2.4)  0.219 
MDR-TB  2 (2.4)  0.219 
DS-TB  83 (97.6)     
Ventilatory pattern
Obstructive  56 (65.9)  56 (58.3)  0.373 
Restrictive  6 (7.1)  10 (10.4)  0.595 
Mixed  8 (9.4)  9 (9.4)  0.999 
Normal  15 (17.6)  21 (21.9)  0.600 
Radiological pattern
Cavities  18 (21.2)  13 (13.5)  0.245 
Bronchiectasis  34 (40.0)  32 (33.3)  0.438 
Emphisema  60 (70.6)  63 (65.6)  0.579 
Lung fibrosis  12 (14.1)  14 (14.6)  0.999 

SD=standard deviation; BMI=body mass index; HIV=human immunodeficiency virus; COPD=chronic obstructive pulmonary disease; MDR-TB=multidrug resistant tuberculosis; DS-TB=drug sensitive tuberculosis.

*

Statistically significant p-value.

Table 2 shows the comparison of pulmonary function tests between Groups 1 (rehabilitation) and 2 (no rehabilitation), and between initial and final evaluation. Several functional parameters improved after rehabilitation: forced expiratory volume in one second (FEV1) post-bronchodilator (BD), forced vital capacity (FVC) post-BD, DLCO, distance walked in 6MWT, initial SaO2 at 6MWT, and the final SaO2 at 6MWT. The median increase in 6-minute walk distance (6MWD) was 60m (Q1;Q3: 0m; 107.5m); 54/81 (66.7%) had an improvement greater than 25m. There was no statistically significant difference in the increase in 6MWD comparing patients with COPD (52.5m [Q1;Q3: −7.3m; 119.3m]) and without COPD (68.0m [Q1;Q3: 6.5m; 99.5m]) (p=0.963).

Table 2.

Comparison of Pulmonary Function Tests Between Groups 1 (Rehabilitation) and 2 (No Rehabilitation).

  Group 1 (Rehabilitation) (n=85)Group 2 (No Rehabilitation) (n=96)p Value for Differences Between Time 2 and Time 1 Among Groups 
  Time 1 (Pre-Rehabilitation)  Time 2 (Post-Rehabilitation)  p Value  Difference Time 2Time 1**  Time 1 (Initial Evaluation)  Time 2 (Evaluation in 3 Months)  p Value  Difference Time 2Time 1**   
FEV1 post-BD (L)  1.33±0.85  1.56±0.93  <0.0001*  0.13 (0;0.43)  1.66±0.84  1.39±0.76  <0.0001*  −0.22 (−0.46;−0.02)  <0.0001* 
FEV1 post-BD (%)  46.4±24.1  50.8±25.5  0.012*  0.8 (−0.16;8.65)  57.3±26.1  50.3±23.7  <0.0001*  −5.35 (−13.1;0.28)  <0.0001* 
FVC post-BD (L)  2.37±0.92  2.61±1.03  <0.0001*  0.15 (−0.02;0.52)  2.52±10.01  2.26±0.93  <0.0001*  −0.28 (−0.55;0.13)  <0.0001* 
FVC post-BD (%)  64.4±20.5  69.5±22.3  0.009*  0.37 (−1.08;11.08)  70.2±24.1  64.1±21.7  0.001*  −5.45 (−13.7;4.10)  <0.0001* 
FEV1/FVC post-BD  59.2±23.5  62.3±20.9  0.053  2.0 (−3.7;9.2)  65.7±17.7  60.5±19.3  <0.0001*  −4.75 (−10.6;0.55)  <0.0001* 
TLC (L)  6.54±1.06  6.73±1.61  0.338  0.01 (−0.69;0.73)  5.79±1.81  5.73±1.77  0.593  −0.01 (−0.65;0.63)  0.670 
TLC (%)  113.7±25.4  117.4±34.4  0.494  3.7 (−8.77;14.1)  103.2±27.9  103.0±27.9  0.946  −1.80 (−12.2;9.45)  0.159 
RV (L)  4.08±1.23  6.28±11.89  0.273  0.08 (−0.5;1.03)  4.49±8.95  3.52±1.48  0.373  0.10 (−0.49;0.69)  0.785 
RV (%)  202.0±71.4  225.3±88.8  0.076  13.5 (−21.1;61.3)  179.7±81.4  169.5±73.3  0.122  −10.6 (−36.0;20.8)  0.033* 
DLCO  6.67±5.27  10.64±4.66  <0.0001*  3.92 (0;6.64)  12.7±5.42  8.37±8.69  0.001*  −4.85 (−8.91;−0.80)  <0.0001* 
DLCO (%)  37.5±17.3  41.7±13.5  0.079  4.0 (−4.2;13.7)  47.9±17.2  42.2±20.5  0.007*  −7.20 (−17.2;3.40)  0.002* 
PaO2  66.2±15.1  70.2±13.9  0.144  1.4 (−3.6;12.7)  70.7±13.4  67.9±16.3  0.327  −1.20 (−12.7;6.70)  0.055 
SaO2  91.2±6.2  93.1±6.7  0.226  1.3 (−0.35;5.7)  92.8±6.65  91.7±7.31  0.480  −1.00 (−4.45;0.90)  0.004* 
6MWT (m)  367.5±132.9  425.9±135.6  <0.0001*  60 (0;107.5)  432.9±99.7  365.8±104.2  <0.0001*  −60.5 (−125.5;0.50)  <0.0001* 
6MWT (initial SpO294.8±2.7  95.8±2.5  <0.0001*  1 (0;2.0)  95.2±2.29  95.0±2.00  0.617  0 (−2.0;2.0)  0.006* 
6MWT (final SpO289.7±6.6  91.7±5.5  0.001*  1 (−1.0;4.0)  90.0±5.28  89.3±7.09  0.275  0 (−3.0;3.0)  0.019* 

FEV1=forced expiratory volume in first second; BD=bronchodilator; L=liters; FVC=forced vital capacity; TLC=total lung capacity; RV=residual volume; DLCO=diffusing capacity of the lung for carbon monoxide; PaO2=arterial oxygen pressure; SaO2=arterial oxygen saturation; 6MWT=six-minute walking test; m=meters; SpO2=pulse oxygen saturation.

*

Statistically significant p-value.

**

Median (1st quartile; 3rd quartile).

On the other hand, several functional parameters decreased after 3 months in Group 2, including: FEV1 post-BD (L), FEV1 post-BD (%), FVC post-BD (L), FVC post-BD (%), FEV1/FVC post-BD, DLCO, DLCO (%), and distance walked in 6MWT (Table 2).

Table 3 shows the comparison of pulmonary function tests pre- and post-PR, among patients with and without COPD. In COPD patients, several functional parameters increased after rehabilitation, such as FEV1 post-BD (L), FEV1 post-BD (%), FVC post-BD (L), FVC post-BD (%), FEV1/FVC post-BD, DLCO, distance walked in 6MWT, and initial/final SpO2 at 6MWT. In non-COPD patients, only FEV1 post-BD (L) and distance walked in 6MWT improved after rehabilitation.

Table 3.

Comparison of Pulmonary Function Tests Between COPD and No COPD Patients Who Underwent Rehabilitation.

  COPD (n=60)No COPD (n=25)
  Time 1 (Pre-Rehabilitation)  Time 2 (Post-Rehabilitation)  p Value  Time 1 (Pre-Rehabilitation)  Time 2 (Post-Rehabilitation)  p Value 
FEV1 post-BD (L)  1.04±0.54  1.27±0.65  <0.0001*  2.06±1.05  2.27±1.14  0.002* 
FEV1 post-BD (%)  37.9±17.7  43.4±19.3  0.002*  67.6±25.3  69.5±29.7  0.684 
FVC post-BD (L)  2.16±0.74  2.45±0.86  0.001*  2.91±1.09  3.07±1.28  0.158 
FVC post-BD (%)  60.4±20.6  66.6±21.7  0.009*  72.3±22.1  76.8±22.6  0.211 
FEV1/FVC post-BD  49.1±15.7  53.4±13.6  0.038*  84.5±19.9  84.1±19.9  0.871 
TLC (L)  7.63±5.98  6.81±1.59  0.431  4.92±0.29  5.23±0.73  0.500 
TLC (%)  117.6±19.0  118.9±34.6  0.809  46.5±33.2  92.0±19.8  0.439 
RV (L)  4.26±1.01  6.47±12.2  0.298  1.11±0.57  3.09±1.27  0.368 
RV (%)  209.9±64.5  227.8±84.0  0.151  67.5±54.4  183.0±197.9  0.459 
DLCO  6.67±5.27  10.6±4.66  <0.0001*  –  –  – 
DLCO (%)  37.5±17.3  41.7±13.5  0.079  –  –  – 
PaO2  66.2±15.1  70.2±13.9  0.144  –  –  – 
SaO2  91.2±6.20  93.1±6.65  0.226  –  –  – 
6MWT (m)  337.2±117.3  395.6±115.3  <0.0001*  435.3±143.2  493.9±154.6  0.001* 
6MWT (initial SpO293.9±2.38  95.1±2.44  0.001*  96.7±2.21  97.3±1.88  0.162 
6MWT (final SpO287.6±5.86  89.6±4.88  0.005*  94.4±5.71  96.4±3.74  0.074 

COPD=chronic obstructive pulmonary disease; FEV1=forced expiratory volume in first second; BD=bronchodilator; L=liters; FVC=forced vital capacity; TLC=total lung capacity; RV=residual volume; DLCO=diffusing capacity of the lung for carbon monoxide; PaO2=arterial oxygen pressure; SaO2=arterial oxygen saturation; 6MWT=six-minute walking test; m=meters; SpO2=pulse oxygen saturation.

*

Statistically significant p-value.

Table 4 shows the comparison of pulmonary function tests between COPD and no COPD patients who did not underwent rehabilitation. In both COPD and non-COPD patients, there was a decline in several lung function parameters after 3 months.

Table 4.

Comparison of Pulmonary Function Tests Between COPD and No COPD Patients Who Did Not Underwent Rehabilitation.

  COPD (n=62)No COPD (n=34)
  Time 1 (Initial Evaluation)  Time 2 (Evaluation in 3 Months)  p Value  Time 1 (Initial Evaluation)  Time 2 (Evaluation in 3 Months)  p Value 
FEV1 post-BD (L)  1.53±0.76  1.28±0.79  <0.0001*  1.89±0.93  1.58±0.69  0.001* 
FEV1 post-BD (%)  52.6±23.7  45.9±23.5  0.001*  65.4±28.5  57.9±22.3  0.014* 
FVC post-BD (L)  2.49±0.81  2.24±0.89  0.001*  2.56±1.31  2.31±1.02  0.045* 
FVC post-BD (%)  69.2±20.1  63.1±20.0  0.008*  72.1±30.3  65.8±24.7  0.067 
FEV1/FVC post-BD  60.6±16.5  54.9±18.8  <0.0001*  74.7±16.4  70.2±16.4  0.007* 
TLC (L)  6.08±1.74  5.99±1.56  0.628  5.33±1.87  5.29±2.03  0.828 
TLC (%)  108.9±33.8  109.2±26.5  0.937  94.0±26.8  92.9±27.6  0.709 
RV (L)  5.53±11.2  3.86±1.40  0.342  2.78±1.29  2.96±1.45  0.288 
RV (%)  200.4±87.8  189.5±77.2  0.256  145.7±56.3  136.7±53.0  0.244 
DLCOc  11.9±5.05  8.82±9.65  0.078  14.1±5.89  7.57±6.85  0.001* 
DLCOc (%)  46.2±17.1  40.5±19.2  0.044*  51.2±17.3  45.1±22.8  0.078 
PaO2  70.1±14.6  69.3±16.7  0.816  73.2±7.94  62.6±14.9  0.110 
SaO2  92.3±7.42  92.3±6.29  0.997  94.7±1.59  89.2±10.4  0.198 
6MWT (m)  427.9±97.6  358.9±109.8  <0.0001*  442.2±104.9  379.0±93.2  <0.0001* 
6MWT (initial SpO295.0±2.30  94.9±1.92  0.785  95.4±2.32  95.1±2.19  0.660 
6MWT (final SpO289.4±5.16  89.2±6.74  0.773  91.1±5.44  89.4±7.87  0.190 

COPD=chronic obstructive pulmonary disease; FEV1=forced expiratory volume in first second; BD=bronchodilator; L=liters; FVC=forced vital capacity; TLC=total lung capacity; RV=residual volume; DLCO=diffusing capacity of the lung for carbon monoxide; PaO2=arterial oxygen pressure; SaO2=arterial oxygen saturation; 6MWT=six-minute walking test; m=meters; SpO2=pulse oxygen saturation.

*

Statistically significant p-value.

Table 5 shows the comparison of pulmonary function tests according to COPD severity in Groups 1 and 2. Patients with severe and very severe COPD who underwent rehabilitation showed improvements in more lung function parameters, compared with patients with mild and moderate COPD who underwent rehabilitation. Among patients who did not undergo rehabilitation, both patients with mild to moderate COPD and those with severe and very severe COPD showed worsening of some lung function parameters.

Table 5.

Comparison of pulmonary function tests according to COPD severity in Groups 1 and 2.

  Group 1 (Rehabilitation)
  Mild+Moderate COPD (n=13)Severe and Very Severe COPD (n=47)
  Time 1 (Pre-Rehabilitation)  Time 2 (Post-Rehabilitation)  p Value  Time 1 (Pre-Rehabilitation)  Time 2 (Post-Rehabilitation)  p Value 
FEV1 post-BD (L)  1.79±0.63  2.11±0.62  0.008*  0.84±0.25  1.04±0.44  <0.0001* 
FEV1 post-BD (%)  65.8±11.6  69.6±9.71  0.357  30.2±9.15  36.1±14.3  0.002* 
FVC post-BD (L)  2.94±0.69  3.29±0.78  0.155  1.94±0.60  2.21±0.73  0.001* 
FVC post-BD (%)  83.0±13.8  87.5±17.1  0.455  54.2±17.6  60.8±19.2  0.009* 
FEV1/FVC post-BD  61.0±16.1  64.4±11.9  0.539  45.7±14.0  50.3±12.5  0.040* 
TLC (L)  6.22±0.82  6.54±1.38  0.361  8.19±7.02  6.91±1.68  0.382 
TLC (%)  106.9±10.1  112.8±20.2  0.290  122.1±20.2  121.4±39.2  0.926 
RV (L)  3.24±0.37  3.66±0.99  0.171  4.68±0.89  7.64±14.4  0.329 
RV (%)  148.3±21.1  180.7±54.1  0.059  235.6±58.7  247.4±87.3  0.471 
DLCOc  8.0±7.75  13.2±5.13  0.011*  6.03±3.64  9.41±3.98  0.001* 
DLCOc (%)  46.8±21.9  47.4±10.6  0.901  33.1±12.9  38.9±14.1  0.035* 
PaO2  69.9±13.6  74.0±12.5  0.287  65.4±15.5  69.3±14.2  0.226 
SaO2  93.8±3.64  94.7±2.11  0.405  90.7±6.55  92.7±7.25  0.267 
6MWT (m)  412.3±54.8  488.6±89.4  0.002*  316.7±121.7  370.2±108.9  0.001* 
6MWT (initial SpO294.3±2.26  96.2±1.53  0.010*  93.8±2.43  94.8±2.58  0.015* 
6MWT (final SpO289.1±5.74  92.3±5.26  0.012*  87.2±5.89  88.8±4.55  0.047* 
  Group 2 (No Rehabilitation)
  Mild+Moderate COPD (n=32)Severe and Very Severe COPD (n=30)
  Time 1 (Initial Evaluation)  Time 2 (Evaluation in 3 Months)  p Value  Time 1 (Initial Evaluation)  Time 2 (Evaluation in 3 Months)  p Value 
FEV1 post-BD (L)  2.12±0.64  1.79±0.81  0.001*  0.95±0.23  0.79±0.32  0.003* 
FEV1 post-BD (%)  72.3±16.4  63.1±19.9  0.007*  32.9±8.28  28.8±11.2  0.030* 
FVC post-BD (L)  2.90±0.81  2.63±0.99  0.035*  2.08±0.58  1.84±0.55  0.008* 
FVC post-BD (%)  80.3±17.7  73.0±18.9  0.060  58.1±15.9  53.1±15.9  0.053 
FEV1/FVC post-BD  73.4±11.1  67.9±16.7  0.008*  47.9±9.69  41.9±9.51  0.004* 
TLC (L)  5.38±1.79  5.49±1.87  0.630  6.75±1.42  6.47±1.02  0.343 
TLC (%)  94.3±32.9  98.8±27.8  0.547  122.7±29.1  119.1±21.5  0.412 
RV (L)  2.95±1.29  3.00±1.35  0.779  7.98±15.4  4.66±0.88  0.340 
RV (%)  150.9±58.1  142.8±60.4  0.386  247.6±86.1  234.0±64.6  0.421 
DLCOc  13.6±5.14  9.19±7.48  0.002*  10.1±4.43  8.43±11.8  0.616 
DLCOc (%)  51.9±15.7  45.6±21.6  0.148  40.1±16.8  35.2±15.1  0.177 
PaO2  67.3±15.7  65.3±12.3  0.732  70.9±14.5  70.6±17.9  0.925 
SaO2  92.5±5.57  93.2±3.67  0.762  92.3±8.03  92.1±6.97  0.921 
6MWT (m)  461.8±64.9  398.2±90.6  0.001*  399.2±111.8  325.5±115.0  0.002* 
6MWT (initial SpO295.8±1.53  95.3±2.09  0.310  94.4±2.65  94.6±1.75  0.622 
6MWT (final SpO291.4±5.09  90.4±5.94  0.197  87.8±4.69  88.3±7.32  0.700 

COPD=chronic obstructive pulmonary disease; FEV1=forced expiratory volume in first second; BD=bronchodilator; L=liters; FVC=forced vital capacity; TLC=total lung capacity; RV=residual volume; DLCO=diffusing capacity of the lung for carbon monoxide; PaO2=arterial oxygen pressure; SaO2=arterial oxygen saturation; 6MWT=six-minute walking test; m=meters; SpO2=pulse oxygen saturation.

*

Statistically significant p-value.

Discussion

In this study, we demonstrated that PR significantly improved lung volumes and flows measured during forced expiratory maneuvers (specifically FVC and FEV1) and pulmonary gas exchange (DLCO), that might account for improved exercise capacity (measured by the distance walked in the 6MWT) in patients with PTLD in a large multicentre cohort of PTLD patients. TLC, RV, and arterial blood gas analysis (PaO2 and SaO2) were not statistically different before and after PR. On the other hand, patients with PTLD who did not undergo PR worsened their lung function and exercise capacity when assessed 3 months after the initial evaluation (Table 2). In a subgroup analysis, it was observed that the number of lung function parameters which were improved after PR was much higher in COPD patients when compared with patients without COPD. Yet, the increase in post-BD FEV1 (L) and in the distance walked in the 6MWT after PR in non-COPD patients are consistent with preexisting bronchial obstruction and impaired exercise capacity in milder form of lung disease and suggest potential benefit of PR in all PTLD patients.

The first consensus-based set of Clinical Standards for PTLD, published in 2021,8 stated that former TB patients with functional, clinical, and/or radiological findings consistent with PTLD should be evaluated for PR. This important document was followed by the “Brazilian Thoracic Association recommendations for the management of PTLD”6 – the first national society to produce a document on this subject – which also recommended PR for patients with PTLD. A PRP for PTLD patients should take into consideration the local organization of health services, and it is suggested that evaluation of effectiveness of PR be done by comparing the core variables before and after rehabilitation.6,8

In the present study, FEV1, FVC, and DLCO improved significantly after PR. Some authors11,12,14 previously demonstrated similar findings. Visca et al.11 retrospectively investigated if patients with TB sequelae had any benefits from PR in Italy. After a 3-week PRP, 34 subjects with impaired lung function showed a significant improvement in FEV1 and FVC, although several details of their pre-rehabilitation TB history were not available. A group of authors in Japan evaluated the effectiveness of PR for a mean period of 3.9 weeks in 37 in-patients with pulmonary TB sequelae.12 In South Africa, a single-blinded randomized controlled study14 was conducted to assess the effects of a six-week home-based PRP in a group of 34 patients. They found improvements in FEV1 and FVC, although statistical significance was not reached at the end of the program. As expected, the improvement in lung function parameters after PR was greater in patients with PTLD and COPD (especially in those with severe to very severe COPD), in comparison with patients without COPD).

Improvement between pre- and post-rehabilitation moments was remarkably greater (and statistically significant) in more variables among patients with COPD (greater baseline functional impairment) than in patients without COPD or with less severe COPD (lower baseline functional impairment). This suggests that those with greater baseline functional impairment have more room for improvement with PR.

The distance walked in the 6MWT also showed improvement after PR in our study. This is in agreement with previous studies.12,13,15 In a PRP performed in Japan, the distance walked in 6MWT increased from 303m to 339m.12 In Colombia, a study13 including eight participants demonstrated an increase of 63.6m in distance walked in 6MWT, after an eight-week PRP within a public hospital. In addition, a prospective nonrandomized open trial15 conducted over a 9-week period evidenced a statistically significant improvement of 42m in 6-min walking distance. In a study with COPD patients,24 the mean improvement in 6MWD was of 66 meters, similar to our study, that included more than 70% of patients with COPD in addition to PTLD. We also found that almost 70% of patients had an increase in 6MWD greater than 25m, which is considered the minimal important difference for COPD patients.24 However, patients with PTLD and without COPD also demonstrated improvement in distance walked on the 6MWT in our study.

To the best of our knowledge, this study was the first to document significant improvements of DLCO in PTLD patients who underwent PR whilst the control group significantly deteriorated their pulmonary gas exchange during the same period. The fact that only FEV1, FVC and DLCO, and not TLC or RV significantly improved after three months of PR underscore the possibility of PR to improve ventilation, hence pulmonary gas exchange. Such improvement might also account for improved exercise capacity and the 6MWT.

We conducted PR on an outpatient-basis, as feasible in Brazil, and considered 3 months as the most suitable time for the comparisons as the majority of patients needed 3 months to complete the post-PR evaluation (81 of 85–95.3%). Only four patients completed the rehabilitation program in 5 weeks. There was no difference between these patients and those who took 3 months to complete the program. A potential minor bias exists, related to the differences in time patients needed to complete the process (PR and evaluation), we cannot measure nor correct for. Furthermore, a limitation exists given the non-possibility of randomizing patients toward Group 1 or 2. In fact, after publication of the SBPT guidelines, it is considered non-ethical, when the feasibility exists, not to propose PR to PTLD patients. The control group was created the year before the SBPT guidelines’ approval, when creating evidence that non-rehabilitated patients deteriorated their functional status.

Probably, the best evaluation method would have been to use sham-rehabilitation, which is challenging and was not done, as the non-rehabilitated patients would be under supervision like those who were in PRP. Non-rehabilitated patients were yet followed-up on a monthly basis, therefore the possible bias would eventually be minimized. Also, we did not include pre- and post-rehabilitation quality of life assessment and this is an additional limitation of this study. Nevertheless, this is a multicentre study and, as far as we know, the largest evaluating patients with PTLD who underwent PR, and compared them with a cohort of non-rehabilitated patients. Furthermore, this is the first time PTLD patients with and without COPD were compared, with a sub-analysis conducted per COPD severity (severe and very severe vs. mild and moderate). The completeness of the functional evaluation is also a strength of the study. The involvement of three reference centers in Brazil, which applied the recommendations of the above-mentioned SBPT guidelines shows that evaluation of patients at the end of anti-TB treatment and outpatient rehabilitation of those suffering of PTLD is feasible in Brazil and, probably, in many other countries with sufficient resources. This experience offers new hopes for the thousands of patients suffering of PTLD around the globe.7,8 In addition, future studies should explore the potential for PRP to reduce DALY among PTLD patients.

Conclusions

In conclusion, we demonstrated the significant benefits from PR in patients with PTLD, with improvements in lung function and in exercise capacity in all PTLD patients (including those without COPD), although patients with severe and very severe COPD benefited most. Accessible and quality healthcare services should be available not only during TB treatment. National TB programs should ensure the availability of PR for PTLD patients.

Contribution of Each Author

DRS, GBM and RC had full access to all the data in the study and take responsibility for the integrity of the data and the accuracy of the data analysis.

DRS and GBM wrote the first draft of the manuscript. DRS, GBM, FCQM, TSG, MD, RC, DV, LDA defined the study design. ATDX specifically evaluated the lung function tests data and their implications for post-TB lung disease patients. All authors contributed to the interpretation of results and critically reviewed the manuscript. All authors have read and agreed to the published version of the manuscript.

Artificial Intelligence Involvement

None of the material has been partially or totally produced with the help of any artificial intelligence software or tool.

Funding of the Research

This research did not receive any specific grant from funding agencies in the public, commercial, or not-for-profit sectors.

Conflicts of Interest

The authors declare not to have any conflicts of interest that may be considered to influence directly or indirectly the content of the manuscript.

Acknowledgements

The article is part of the scientific activities of the Global Tuberculosis Network (GTN), hosted by the World Association for Infectious Diseases and Immunological Disorders (WAiDID). This work was partially supported for Istituti Clinici Scientifici Maugeri, by the “Ricerca Corrente”, funded by the Italian Ministry of Health

References
[1]
World Health Organization.
Global Tuberculosis Report 2024.
WHO, (2024),
[2]
S.G. Mpagama, K.S. Msaji, O. Kaswaga, L.J. Zurba, P.M. Mbelele, B.W. Allwood, et al.
The burden and determinants of post-TB lung disease.
Int J Tuberc Lung Dis, 25 (2021), pp. 846-853
[3]
S. Hulya, N. Ilknur, G. Karadeniz, S. Erkan.
Clinical effects of TB sequelae in patients with COPD.
Int J Tuberc Lung Dis, 26 (2022), pp. 363-368
[4]
G.B. Migliori, J. Caminero Luna, X. Kurhasani, M. van den Boom, D. Visca, L. D’Ambrosio, et al.
History of prevention, diagnosis, treatment and rehabilitation of pulmonary sequelae of tuberculosis.
Presse Med, 51 (2022), pp. 104112
[5]
World Health Organization. Policy brief on tuberculosis-associated disability. WHO, Geneva, Switzerland 2023. Available from: https://www.who.int/publications/i/item/9789240077799 [accessed 13.1.25].
[6]
D. Rossato Silva, A. Paula Santos, D. Visca, S. Bombarda, M. Maria Pretti Dalcolmo, T. Galvão, et al.
Brazilian Thoracic Association recommendations for the management of post-tuberculosis lung disease.
[7]
N.A. Menzies, M. Quaife, B.W. Allwood, A.L. Byrne, A.K. Coussens, A.D. Harries, et al.
Lifetime burden of disease due to incident tuberculosis: a global reappraisal including post-tuberculosis sequelae.
Lancet Glob Heal, 9 (2021), pp. e1679-e1687
[8]
G.B. Migliori, F.M. Marx, N. Ambrosino, E. Zampogna, H.S. Schaaf, M.M. van der Zalm, et al.
Clinical standards for the assessment, management and rehabilitation of post-TB lung disease.
Int J Tuberc Lung Dis, 25 (2021), pp. 797-813
[9]
S. Janete Inwentarz, G.B. Migliori, L. Lagrutta, F. Bornengo, J.L. Falco, Y. De Sosa Márquez, et al.
Recomendaciones para el manejo de la Enfermedad Pulmonar Post Tuberculosis.
Respirar, 16 (2024), pp. 271-288
[10]
N. Yoshida, T. Yoshiyama, E. Asai, Y. Komatsu, Y. Sugiyama, Y. Mineta.
Exercise training for the improvement of exercise performance of patients with pulmonary tuberculosis sequelae.
Intern Med, 45 (2006), pp. 399-403
[11]
D. Visca, E. Zampogna, G. Sotgiu, R. Centis, L. Saderi, L. D’Ambrosio, et al.
Pulmonary rehabilitation is effective in patients with tuberculosis pulmonary sequelae.
Eur Respir J, 53 (2019), pp. 1802184
[12]
A. Tada, H. Matsumoto, R. Soda, S. Endo, H. Kawai, G. Kimura, et al.
Effects of pulmonary rehabilitation in patients with pulmonary tuberculosis sequelae.
Nihon Kokyuki Gakkai Zasshi, 40 (2002), pp. 275-281
[13]
J.A. Rivera, E.C. Wilches-Luna, R. Mosquera, N.L. Hernandez, O.M. Hernandez Orobio.
Pulmonary rehabilitation on aerobic capacity and health-related quality of life in patients with sequelae of pulmonary TB.
Physiotherapy, 101 (2015), pp. e1288
[14]
D. de Grass, S. Manie, S.L. Amosun.
Effectiveness of a home-based pulmonary rehabilitation programme in pulmonary function and health related quality of life for patients with pulmonary tuberculosis: a pilot study.
Afr Health Sci, 14 (2014), pp. 866-872
[15]
M. Ando, A. Mori, H. Esaki, T. Shiraki, H. Uemura, M. Okazawa, et al.
The effect of pulmonary rehabilitation in patients with post-tuberculosis lung disorder.
Chest, 123 (2003), pp. 1988-1995
[16]
B.E. Fisher, A.D. Wu, G.J. Salem, J.E. Song, C.-H. Lin, J. Yip, et al.
The effect of exercise training in improving motor performance and corticomotor excitability in persons with early Parkinson's disease.
Am Phys Ther Assoc Comb Sect, 89 (2006), pp. 1221-1229
[17]
M.R. Miller, J. Hankinson, V. Brusasco, F. Burgos, R. Casaburi, A. Coates, et al.
Standardisation of spirometry standardisation of spirometry.
Eur Respir J, 26 (2005), pp. 319-338
[18]
N. Macintyre, R.O. Crapo, G. Viegi, D.C. Johnson, C.P.M. Van Der Grinten, V. Brusasco, et al.
Standardisation of the single-breath determination of carbon monoxide uptake in the lung.
Eur Respir J, 26 (2005), pp. 720-735
[19]
J. Wanger, J.L. Clausen, A. Coates, O.F. Pedersen, V. Brusasco, F. Burgos, et al.
Standardisation of the measurement of lung volumes.
Eur Respir J, 26 (2005), pp. 511-522
[20]
C.A. Pereira, C. de, T. Sato, S.C. Rodrigues.
New reference values for forced spirometry in white adults in Brazil.
J Bras Pneumol, 33 (2007), pp. 397-406
[21]
P.L. Enright, D.L. Sherrill.
Reference equations for the six-minute walk in healthy adults.
Am J Respir Crit Care Med, 158 (1998), pp. 1384-1387
[22]
ATS Committee on Proficiency Standards for Clinical Pulmonary Function Laboratories.
ATS statement: guidelines for the six-minute walk test.
Am J Respir Crit Care Med, 166 (2002), pp. 111-117
[23]
Global Initiative for Chronic Obstructive Lung Disease.
Global strategy for the diagnosis management, and prevention of chronic obstructive pulmonary disease (2024 report).
GOLD, (2024),
[24]
A.E. Holland, C.J. Hill, T. Rasekaba, A. Lee, M.T. Naughton, C.F. McDonald.
Updating the minimal important difference for six-minute walk distance in patients with chronic obstructive pulmonary disease.
Arch Phys Med Rehabil, 91 (2010), pp. 221-225
Copyright © 2025. SEPAR
Archivos de Bronconeumología
Article options
Tools

Are you a health professional able to prescribe or dispense drugs?