


Poor muscle quality in COPD patients relates to exercise intolerance and mortality. Muscle quality can be estimated on computed tomography (CT) by estimating psoas density (PsD). We tested the hypothesis that PsD is lower in COPD patients than in controls and relates to all-cause mortality.
MethodsAt baseline, PsD was measured using axial low-dose chest CT images in 220 COPD patients, 80% men, who were 65±8 years old with mild to severe airflow limitation and in a control group of 58 subjects matched by age, sex, body mass index (BMI) and body surface area (BSA). COPD patients were prospectively followed for 76.5 (48–119) months. Anthropometrics, smoking history, BMI, dyspnoea, lung function, exercise capacity, BODE index and exacerbations history were recorded. Cox proportional risk analysis determined the factors more strongly associated with long-term mortality.
ResultsPsD was lower in COPD patients than in controls (40.5 vs 42.5, p=0.045). During the follow-up, 54 (24.5%) deaths occurred in the COPD group. PsD as well as age, sex, pack-year history, FEV1%, 6MWD, mMRC, BODE index, were independently associated with mortality. Multivariate analysis showed that age (HR 1.06; 95% CI 1.02–1.12, p=0.006) and CT-assessed PsD (HR 0.97; 95%CI 0.94–0.99, p=0.023) were the variables independently associated with all-cause mortality.
ConclusionsIn COPD patients with mild to severe airflow limitation, chest CT-assessed psoas muscle density was lower than in matched controls and independently associated with long-term mortality. Muscle quality using the easy to evaluate psoas muscle density from chest CT may provide clinicians with important prognostic information in COPD.
La baja calidad muscular de los pacientes con enfermedad pulmonar obstructiva crónica (EPOC) se relaciona con la intolerancia al ejercicio y la mortalidad. La calidad del músculo puede estimarse mediante tomografía computarizada (TC) evaluando la densidad del psoas (PsD). Consideramos la hipótesis de que la PsD es menor en los pacientes con EPOC que en los controles y que se relaciona con la mortalidad por todas las causas.
MétodosAl inicio se midió la PsD utilizando las imágenes de TC axial de tórax de baja dosis en 220 pacientes con EPOC, el 80% hombres, de 65 ± 8 años con limitación del flujo aéreo leve a grave y en un grupo control de 58 sujetos emparejados por edad, sexo, índice de masa corporal (IMC) y área de superficie corporal (ASC). Realizamos el seguimiento de los pacientes con EPOC de forma prospectiva durante 76,5 (48-119) meses. Se registraron los datos antropométricos, el historial de tabaquismo, el IMC, la disnea, la función pulmonar, la capacidad de ejercicio, el índice BODE y el historial de exacerbaciones. El análisis de riesgos proporcionales de Cox determinó los factores con mayor asociación con la mortalidad a largo plazo.
ResultadosLa PsD fue menor en los pacientes con EPOC que en los controles (40,5 vs. 42,5, p = 0,045). Durante el seguimiento, se dieron 54 (24,5%) fallecimientos en el grupo EPOC. Tanto la PsD como la edad, el sexo, el historial de paquetes por año, el FEV1%, la PC6M, la mMRC y el índice BODE se asociaron de forma independiente con la mortalidad.
El análisis multivariante mostró que la edad (HR 1,06; IC 95% 1,02-1,12, p = 0,006) y la PsD evaluada mediante TC (HR 0,97; IC 95% 0,94-0,99, p = 0,023) fueron variables asociadas de manera independiente con la mortalidad por todas las causas.
ConclusionesEn los pacientes con EPOC y limitación al flujo aéreo leve a grave, la densidad del músculo psoas evaluada mediante TC de tórax fue menor que en los controles emparejados y se asoció de forma independiente con la mortalidad a largo plazo. La calidad muscular, evaluada fácilmente utilizando la densidad muscular del psoas valorada mediante TC torácico, puede proporcionarles a los clínicos información relevante respecto a la prognosis en la EPOC.
Chronic Obstructive Pulmonary Disease (COPD) is a highly prevalent disease and an important cause of morbidity and mortality worldwide.1 In addition to its pulmonary manifestation, this heterogeneous and complex disease has an important number of extra-pulmonary manifestations that provide independent risk for poor outcomes.2,3
Previous studies have proposed that a decrease in lean mass, which is related to exercise intolerance, exacerbations and increased mortality, could be a more reliable predictor of mortality than the low BMI alone in COPD patients.4–7 Indeed, using computed tomography (CT) mid-thigh muscle cross-sectional area is a better predictor of mortality than body weight and BMI in these patients.4,8,9 Fat-free mass estimated from the pectoralis muscle area was also a good predictor of all-cause mortality in large COPD cohorts.9
The psoas is a core muscle which can reflect the status of skeletal muscle of the whole body.10 Muscle quality can be estimated measuring psoas muscle density (PsD) in cross-sectional CT images11,12 because this measurement reflects the degree of fatty muscular infiltration or myosteatosis. There is an increased interest in evaluating the association of CT muscle density with outcomes and prognosis. Indeed, CT imaging measurements have been associated with increased post-operative morbidity and mortality in gastrointestinal oncology and in cardiovascular patients and with poor post-traumatic outcomes.13–15 Recently, cross-sectional area and density of the erector spinae muscles (ESM) at the level of the 12th thoracic vertebra has also been associated with COPD mortality.16
COPD patients frequently undergo chest CT evaluation for clinical purposes, providing a unique opportunity to identify quantifiable CT imaging biomarkers.9,17 We hypothesized that chest CT-assessed PsD is lower in patients with COPD compared to matched controls and that the lower density is independently associated with long-term mortality in those patients.
Methods and materialsCOPD outpatients from three pulmonary clinics from the BODE collaborative group (Pamplona, Las Palmas and Tenerife) constituted the study population. This COPD group was recruited from patients seen in these centers from May 2005 to December 2018. COPD diagnosis was made following the Global Initiative for Chronic Obstructive Lung Disease (GOLD) criteria: post-bronchodilator FEV1/FVC ratio<0.7 on spirometry after the inhalation of 400μg of Salbutamol and the presence of symptoms compatible with the disease.18 Participants were ever smokers with at least 10 pack-years. They had to be clinically stable for at least 8 weeks while receiving therapy according to guidelines.18 None of the patients were receiving chronic oral steroid therapy and only 3 of them received at least one course of acute (5 days) oral steroid therapy for an exacerbation in the past year. Exclusion criteria were; clinical instability due to recent exacerbation (within 8 weeks prior to enrolment), uncontrolled comorbidities such as malignancy or other confounding diseases, malnutrition secondary to gastrointestinal disease o metabolic problems, severe congestive heart failure, obliterative bronchiolitis or diffuse panbronchiolitis. Homogeneity of the inclusion/exclusion criteria was ensured in all centers. Chest CT was performed upon enrolment and regular follow-up visits took place at approximately 12-month intervals following the protocol used by the BODE cohort.19
The control group was identified from an existing database of asymptomatic individuals who were self-referred to the Pamplona hospital for an overall assessment of their health. All these individuals had a chest CT scan performed during similar dates (from March 2007 to July 2012) than the recruitment time of the COPD group. Patients were selected from that large sample matched by sex, age (±1 year), BMI (±1kg/m2) and BSA (m2). The selection was made based on those characteristics and totally blinded to their Psoas density, which was measured subsequently.
Study variablesAt recruitment, trained personnel obtained sociodemographic information and smoking history, including age, gender, current smoking status, and intensity of exposure. BMI and body surface area (BSA) were also calculated. Lung functions were measured following the ATS/ERS standards.20 Patients’ dyspnoea was evaluated using the Modified Medical Research Council (mMRC) scale21 and 6-min walking distance (6MWD) was performed following the ATS recommendations.22 The investigators at each site determined patient's survival status by reviewing medical records or contacting patient's family members. Survival status was determined in all patients. The local ethics committee approved the study protocol and all patients signed the informed consent form.
Chest CT-assessed muscle measurementsAll individuals were imaged on a multidetector CT system at time zero following the same protocol in all centres but with different CT brand/mode. Patients underwent low-dose chest CT examination at end-inspiration in a range extending from the thoracic inlet to upper abdomen. The following parameters were employed: 120kV, 40mAs, 32×0.6mm detector collimation, pitch 1. Images were reconstructed with 5mm and 1mm slice thickness using soft tissue (B31f) and high-resolution (B60f) reconstruction algorithms.
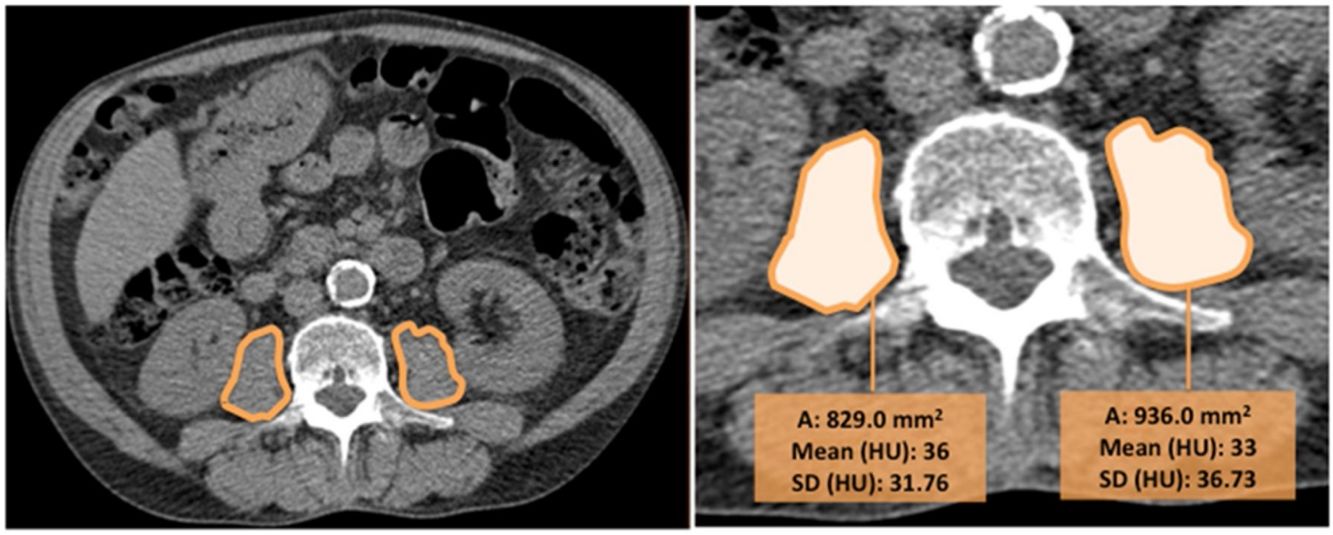
CT images were used to determine the psoas muscle cross-sectional area and density, an indirect estimation of muscle quality. Two independent radiologists blinded to patients’ clinical data and to the outcome, measured the right and left psoas muscles at the level of the third lumbar vertebra on axial CT images (we selected the slice that was in the middle of the vertebra, equidistant from the superior and inferior border). The imaging analysis was performed in one centre to ensure homogeneity in the reading and the interobserver agreement was excellent (k=0.82). Right and left psoas muscle cross-sectional areas (cm2) (RPsA and LPsA, respectively) were employed to obtain the total psoas area (TPsA; TPsA=RPsA+LPsA). In addition, mean attenuation values in Hounsfield unit (HU) and its standard deviations (SD) were also registered (Fig. 1).
 was manually traced involving all the psoas muscle. No special imaging post-processing was required.")
The values obtained were used to measure psoas density.15,17,19 Psoas muscle density, was estimated adding the product of the right mean psoas HU density and RPsA with that of the product of the left mean psoas HU density and LPsA, then dividing by the TPsA19: PsD=[(right psoas attenuation*right PsA)+(left psoas attenuation*left PsA)]/TPsA. Psoas index (PsI) was also calculated computing psoas muscle areas and normalising by the height squared: PsI=TPsA/height2.
We also measured the cross-sectional area and density of the erector spinae muscles (ESM) from a single axial slice at the level of the 12th thoracic vertebra as previously reported.16
Statistical analysisTo explore the normality of the data distribution of the evaluated parameters, we used the Kolmogorov–Smirnov test. Descriptive data for quantitative variables was presented as mean±SD or median±IQR and for qualitative variables, as frequencies (%). Comparison between control and COPD patients were explored with Student t test or Mann–Whitney U test according to the distribution of the variables. Pearson's coefficient or Spearman's correlation coefficient were performed to determine whether CT-assessed PsD correlated with other relevant parameters according to their distribution.
The strength of the association between each of the study variables, including the ES area and density, and all-cause mortality was evaluated using proportional Cox regression analysis. Multivariate Cox proportional hazards analysis including those parameters that were significantly associated with mortality in the univariate analysis and other well-known mortality predictors was performed to determine the best predictors of all-cause mortality. Kaplan–Meier curves were used to represent the cumulative survival for PsD Quartiles. Log Rank test compared the survival curves. Statistical analysis was performed with SPSS software (version 20.0/SPSS Inc., Chicago, IL). A p value <0.05 was considered statistically significant.
ResultsFrom an initial sample of 370 patients, we were able to obtain appropriate radiological imaging of the psoas muscle in 220 patients (Fig. 2). In 150 patients, psoas muscle could not be assessed (baseline chest CT scans were not available, or images did not include the third lumbar vertebra). Erector spinae muscle area and density were also measured in 336 patients, and the results of the patients where both muscles were able to be analyzed were used for outcome comparison. The clinical and physiological characteristics of the patients not included in the final statistical analysis were similar to the ones included in the study (data not shown).

Patients’ demographic characteristics are summarized in Table 1. The final sample included more men than women, with a mean age of 65±8 years old. Most of them were just mildly symptomatic, slightly overweight (27±5kg/m2) and with a good exercise capacity at the time of enrolment. The population had mild to severe COPD, with a low BODE score and less than one exacerbation in the year prior to enrolment. During the follow-up time (76.5; 48–119 months), there were 54 deaths (24.5%). Causes of death included chronic or acute on chronic respiratory failure (10, 18.5%), lung cancer (12, 22.2%), myocardial infarction and other forms of chronic ischemic disease (3, 5.6%), other cancers (14, 25.9%), bronchopneumonia or other lung infections (3, 5.6%) and other/unknown causes (12, 22.2%).
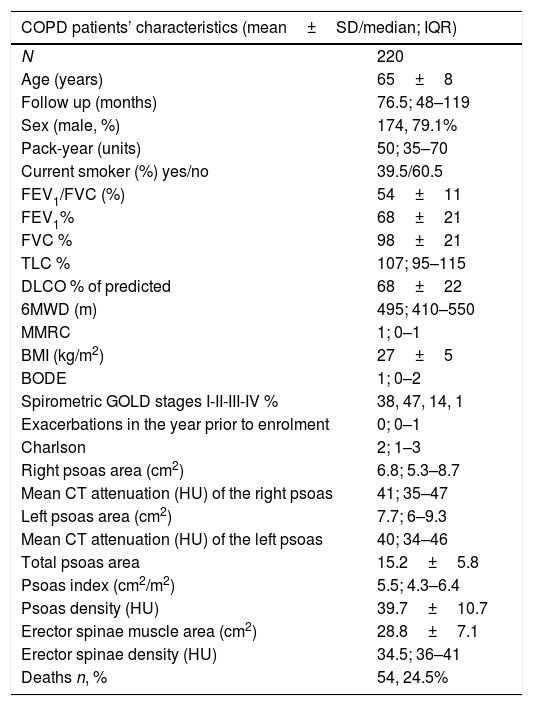
Baseline COPD patients’ characteristics.
| COPD patients’ characteristics (mean±SD/median; IQR) | |
|---|---|
| N | 220 |
| Age (years) | 65±8 |
| Follow up (months) | 76.5; 48–119 |
| Sex (male, %) | 174, 79.1% |
| Pack-year (units) | 50; 35–70 |
| Current smoker (%) yes/no | 39.5/60.5 |
| FEV1/FVC (%) | 54±11 |
| FEV1% | 68±21 |
| FVC % | 98±21 |
| TLC % | 107; 95–115 |
| DLCO % of predicted | 68±22 |
| 6MWD (m) | 495; 410–550 |
| MMRC | 1; 0–1 |
| BMI (kg/m2) | 27±5 |
| BODE | 1; 0–2 |
| Spirometric GOLD stages I-II-III-IV % | 38, 47, 14, 1 |
| Exacerbations in the year prior to enrolment | 0; 0–1 |
| Charlson | 2; 1–3 |
| Right psoas area (cm2) | 6.8; 5.3–8.7 |
| Mean CT attenuation (HU) of the right psoas | 41; 35–47 |
| Left psoas area (cm2) | 7.7; 6–9.3 |
| Mean CT attenuation (HU) of the left psoas | 40; 34–46 |
| Total psoas area | 15.2±5.8 |
| Psoas index (cm2/m2) | 5.5; 4.3–6.4 |
| Psoas density (HU) | 39.7±10.7 |
| Erector spinae muscle area (cm2) | 28.8±7.1 |
| Erector spinae density (HU) | 34.5; 36–41 |
| Deaths n, % | 54, 24.5% |
n=number of participants; FEV1=forced expiratory volume in the first second; FVC=forced vital capacity; TLC=total lung capacity; DLCO=diffusion lung capacity of lung for CO; MMRC=modified medical research council; 6MWD=6 minute walk distance; BMI=body mass index; BODE index: BMI, obstruction, dyspnea, exercise capacity; HU=hounsfield units.
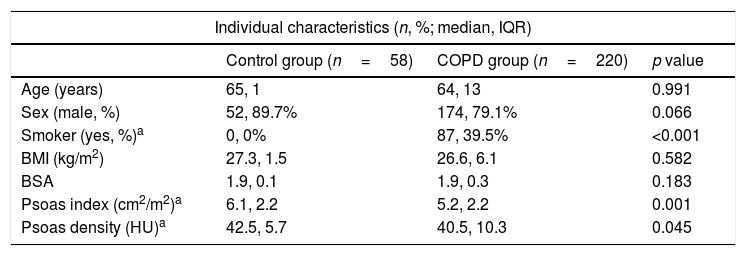
COPD patients had lower PsD than the matched control group (Table 2). In our cohort, there were no sex differences in PsD values (female vs. male: 39.5 vs 40.3HU, p=0.21). In contrast, we did find statistically differences according to sex when studying PsI (5.5, 4.4–6.5cm2/m2 in male vs 4.2, 3.5–5cm2/m2 in women; p=<0.001).
Individual characteristics of the control group and COPD participants.
| Individual characteristics (n, %; median, IQR) | |||
|---|---|---|---|
| Control group (n=58) | COPD group (n=220) | p value | |
| Age (years) | 65, 1 | 64, 13 | 0.991 |
| Sex (male, %) | 52, 89.7% | 174, 79.1% | 0.066 |
| Smoker (yes, %)a | 0, 0% | 87, 39.5% | <0.001 |
| BMI (kg/m2) | 27.3, 1.5 | 26.6, 6.1 | 0.582 |
| BSA | 1.9, 0.1 | 1.9, 0.3 | 0.183 |
| Psoas index (cm2/m2)a | 6.1, 2.2 | 5.2, 2.2 | 0.001 |
| Psoas density (HU)a | 42.5, 5.7 | 40.5, 10.3 | 0.045 |
In our cohort, we found a negative weak association of PsD with BMI (Pearson's r=−0.21, p=0.002). PsD was weakly associated with the number of exacerbations (rho=−0.15, p=0.039) and 6MWD (Spearman's correlation coefficient; rho=0.22, p=0.001).
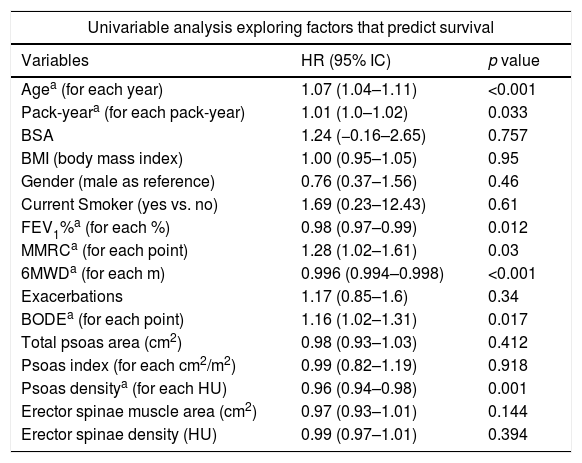
Survival analysisThe univariate analysis confirmed that well recognized survival predictors in COPD patients were also predictors of survival in our population: age, smoking status, airway obstruction (FEV1%), MMRC, 6MWD and BODE index (Table 3).
Univariate Cox analysis showing the independent association of each parameter with all-cause mortality.
| Univariable analysis exploring factors that predict survival | ||
|---|---|---|
| Variables | HR (95% IC) | p value |
| Agea (for each year) | 1.07 (1.04–1.11) | <0.001 |
| Pack-yeara (for each pack-year) | 1.01 (1.0–1.02) | 0.033 |
| BSA | 1.24 (−0.16–2.65) | 0.757 |
| BMI (body mass index) | 1.00 (0.95–1.05) | 0.95 |
| Gender (male as reference) | 0.76 (0.37–1.56) | 0.46 |
| Current Smoker (yes vs. no) | 1.69 (0.23–12.43) | 0.61 |
| FEV1%a (for each %) | 0.98 (0.97–0.99) | 0.012 |
| MMRCa (for each point) | 1.28 (1.02–1.61) | 0.03 |
| 6MWDa (for each m) | 0.996 (0.994–0.998) | <0.001 |
| Exacerbations | 1.17 (0.85–1.6) | 0.34 |
| BODEa (for each point) | 1.16 (1.02–1.31) | 0.017 |
| Total psoas area (cm2) | 0.98 (0.93–1.03) | 0.412 |
| Psoas index (for each cm2/m2) | 0.99 (0.82–1.19) | 0.918 |
| Psoas densitya (for each HU) | 0.96 (0.94–0.98) | 0.001 |
| Erector spinae muscle area (cm2) | 0.97 (0.93–1.01) | 0.144 |
| Erector spinae density (HU) | 0.99 (0.97–1.01) | 0.394 |
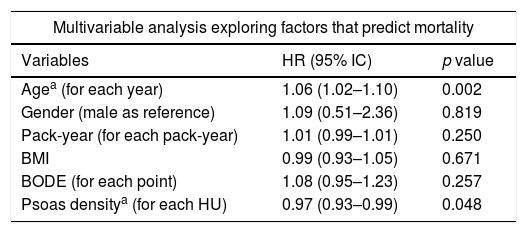
ESM area was independently associated with all-cause mortality (HR: 0.95; 0.91–0.99, p=0.006) in the whole sample (n=336), along with age (HR: 1.07; 1.03–1.11, p=0.001) and the BODE index (HR: 1.11; 1.01–1.24, p=0.041) (Appendix). However, we did not find an association between ESM and mortality in those individuals (n=220), in whom both psoas and erector spinae muscles were measured. In this sample, PsD as a continuous variable (HR: 0.963; CI: 0.941–0.985, p=0.001) was independently associated with all-cause mortality, while this was not observed for the ESM. The multivariate Cox proportional hazard model showed that a higher PsD (better muscle quality) was associated with lower risk for all-cause mortality (Table 4, Fig. 3). There was not a statistically significant association between PsI and all-cause mortality.
Multivariate Cox regression analysis with the variables retained in the final model.
| Multivariable analysis exploring factors that predict mortality | ||
|---|---|---|
| Variables | HR (95% IC) | p value |
| Agea (for each year) | 1.06 (1.02–1.10) | 0.002 |
| Gender (male as reference) | 1.09 (0.51–2.36) | 0.819 |
| Pack-year (for each pack-year) | 1.01 (0.99–1.01) | 0.250 |
| BMI | 0.99 (0.93–1.05) | 0.671 |
| BODE (for each point) | 1.08 (0.95–1.23) | 0.257 |
| Psoas densitya (for each HU) | 0.97 (0.93–0.99) | 0.048 |
 represents the lowest 25th percentile of PsD (<34.6HU). The fourth quartile (Q4) included those patients with PsD values greater than 45HU.")
In this longitudinal observational study, we found an independent association between chest-CT-assessed psoas muscle density and increased all-cause mortality in patients with mild to severe COPD. To our knowledge, this is the first study showing that COPD patients have a lower PsD than a well-matched group of non-smokers’ controls.
The prevalence of muscle atrophy in COPD patients varies across different populations, ranging from 8 to 66% depending on the definition used.5,12,14 Using a validated definition of muscle quality based on the PsD (that reflects the fraction of the muscle infiltrated with fat), we could indirectly estimate the degree of muscle wasting in this high-risk population. Evidence suggests these patients experience a progressive decrease in muscle mass (1–2% per year over 50 years of age) and function (1.5–3% strength reduction per year), after the age of 60 years.8
Although the definition of muscle atrophy and its assessment tools have changed over time, CT is currently considered a “gold standard” to measure muscle quantity.12,23 As a matter of fact, several groups have proposed measuring psoas muscle area on a single slice at the level of L3 due to its accuracy to estimate total body skeletal muscle.13,24
Between the two CT psoas muscle measurements, PsD and PsA, PsD constitutes a surrogate measure of myosteatosis, which may capture information about muscle quality and function that the measurement of muscle area does not provide.11 Myosteatosis is not only an inert fat depot that simply fills the space left by lean mass loss, but also the result of reduced oxidative capacity of muscle fibers.21,25 Increased fatty acid transport, uptake and storage, as well as differentiation of quiescent skeletal muscle precursor “stem” cells into adipocytes have also been described as underlying mechanisms leading to skeletal muscle fat accumulation.26 These mechanisms may explain the identification of poor muscle function in chronic respiratory/cardiac patients who have not yet experienced muscle mass loss.25
Myosteatosis is also associated with the development of insulin resistance and inflammation, leading to an increased risk of developing type-2 diabetes, dyslipidemia and cardiovascular diseases.26–32 All these proinflammatory properties of the intramuscular fatty tissue contribute to the decrease in muscle quality.
In our study, we found that chest-CT measured PsD had a statistically significant (although tenuous) association with BMI, a finding consistent with other studies in patients with and without COPD.6,15 The same happened with the number of exacerbations reported the previous year 6,7,11 and exercise capacity measured by the well-validated 6MWD.33,34 The clinical implications of these associations are unclear.
Poor muscle quality in COPD patients is usually explained by disuse-related muscle atrophy due to activity limitations, malnutrition, side effects of the medications (specially corticosteroids), the persistent elevated levels of inflammatory cytokines or the elevated rate of exacerbations.35,36 We did not evaluate such potential mechanistic explanations to our findings.
The present work also found that the all-cause mortality predictive value of this biomarker is even stronger than the validated multidimensional BODE index, providing independent information about the prognosis of this COPD sample. However, the range of severity as measured by the BODE index was very narrow, decreasing the discriminative power of this measurement related to mortality. Similar to previous studies, ESM area was associated with all-cause mortality in the whole sample we evaluated.16 However, in patients in whom both CT-psoas and ESM measurements were possible, PsD and not ESM was independently associated with mortality. We did not find an association between TPsA/PsI and mortality. Similar to our findings, in a recently published article, muscle area showed weak associations with mortality both in adult men and women followed over a decade. In contrast, greater abdominal muscle density was associated with lower risk of all-cause mortality.37 This, as well as our findings suggests that low muscle density may precede the muscle mass decrease. Possible mechanisms between myosteatosis and mortality may occur through different molecular pathways, likely involving effects on inflammation and oxidative stress and impaired insulin sensitivity.37
Body weight and BMI, classic prognostic factors in COPD patients, have limitations when evaluating muscle wasting.38 Previous data have demonstrated that CT-assessed midthigh muscle cross-sectional area was a stronger predictor of mortality than BMI in COPD patients,4 but this technique has the limitation that a specific lower extremity CT scan needs to be done for the evaluation. Although psoas muscles are less influenced by physical activity and exercise than limb muscles, lifestyle interventions with nutritional support have demonstrated significant improvements in core muscle quality, with beneficial changes in cardiometabolic risk.39 Our findings could allow disease prognostication on CT studies performed for other clinical indications.34,38–40 If appropriately validated, chest CT could also be a useful technique in the longitudinal assessment of changes in skeletal muscle quality before and after the treatment with novel therapies.
One previous study9 conducted in two different cohorts found that pectoralis muscle measurements correlated well with the bioimpedance evaluation of fat free mass and was an independent predictor of all-cause mortality in COPD patients. Unlike our study, which included primarily patients with mild to severe degree of airflow obstruction, that report included mainly moderate to severely obstructed COPD patients, in whom nutritional abnormalities were more common. Furthermore, the study did not compare the predictive power of pectoralis muscle measurements against the multidimensional BODE index, which may be a better prognostic tool in patients with more severe COPD.
Our study has several limitations. Firstly, the results of the present study should be restricted to the type of patients included i.e.: mild to severe COPD patients attending specialty clinics. Further studies should confirm these findings in different COPD populations to validate its use. Secondly, we did not include enough number of females to appropriately validate our finding in this special population where nutritional alterations are more common.23 Although it would be better to provide comparisons with both a non-smoker and smoker control groups, the set of control subjects was chosen to assure that differences in PsD are exclusively due to the presence of airway obstruction and/or emphysema related to COPD and not to the fact of healthy aging. We should also consider that COPD patients frequently have associated comorbidities, especially cardiovascular disease, which may impact both on decrease in PsD (fatty infiltration) and on all-cause mortality (ischemic heart disease).40 Comorbidities as well as the impact of interventions on CT-assessed PsD could be analysed in future research. Lastly, only two thirds of the originally included patients had the appropriate images to evaluate PsD, but those excluded did not differ in their characteristics. However, if our findings are confirmed in other studies, an effort may be made to guarantee that CT's include the psoas as a target to measure in routine CT scans of the chest. Furthermore, new algorithms would allow automatic detection of the L3 slice on whole body CT and determination of psoas and other muscles mass and density.
In conclusion, this study of mild to severe COPD patients shows that chest-CT assessed muscle quality by the density of the psoas muscle at the level of the 3rd lumbar vertebra is lower than in a matched control group and an independent predictor of all-cause mortality. These findings should be validated in other COPD populations and its potential role as a longitudinal biomarker of sarcopenia response to treatment remains to be explored.
Authors’ contributionThe above listed authors attest that they made substantial contributions to the 1) conception and design, acquisition of data, or analysis and interpretation of data; 2) drafting the article or revising it critically for important intellectual content; and 3) final approval of the version to be submitted for revision. All authors had full access to all the data in the study and accept responsibility for the submission of this work.
FundingThis research did not receive any specific grant from funding agencies in the public, commercial, or not-for-profit sectors.
Conflict of interestsThe authors declare that they have no conflict of interest.
The following are the supplementary data to this article:


