


Obstructive sleep apnoea (OSA) has been associated with increased cancer risk and mortality, yet specific biomarkers for patient stratification remain lacking. This study explores the role of immune checkpoint biomarkers, soluble Galectin-9 (sGalectin-9) and TIM-3 (sTIM-3), in identifying OSA patients at higher risk of cancer-related mortality.
MethodsWe conducted a multicohort, prospective observational study including 684 patients, with and without cancer, who underwent sleep studies. Plasma levels of sGalectin-9 and sTIM-3 were assessed using bead-based multiplexed assays. In vitro and ex vivo models were employed to investigate the pathogenic mechanisms underlying biomarker upregulation and their immunological impact.
ResultsIn severe OSA patients with melanoma or lung cancer, sGalectin-9 and sTIM-3 were associated with tumour aggressiveness and with an increased mortality risk. In the three study cohorts, biomarker levels were higher in severe OSA patients than in the other groups. In non-cancer OSA patients’ monocyte intracellular Galectin-9 and T-lymphocyte membrane-bound TIM-3 were upregulated. Experimental data revealed that intermittent hypoxia drove the expression of these biomarkers, which were positively associated with inflammatory mediators and inversely related to T-cell proliferation and infiltration. These findings underscore a mechanistic link between hypoxemia and immune suppression.
InterpretationsGalectin-9 and sTIM-3 are promising prognostic biomarkers for medium- to long-term survival in OSA patients with melanoma or lung cancer. Their upregulation highlights a potential pathophysiological pathway connecting OSA-induced hypoxemia to cancer aggressiveness through immune modulation. Further validation could inform risk stratification and personalised therapeutic strategies.

Obstructive sleep apnoea (OSA) is a heterogeneous disorder characterized by physiological disturbances that increase the risk of severe comorbid conditions, including cardiovascular disease and cancer.1–3 Unfortunately, the apnoea-hypopnea index (AHI), the most commonly used measure of OSA severity, does not reliably capture the variability in prognosis or in the risk of end-organ morbidity. This evidence highlights the need for additional prognostic markers, fueling efforts to identify molecular signatures that could better stratify risk among OSA patients. In fact, recent studies have revealed alterations in biomarkers related to angiogenic and immune surveillance pathways, which may provide biological plausibility to the higher incidence and adverse cancer outcomes observed in OSA patients.4–7 Within this context, circulating biomarkers hold promise as a minimally invasive source for identifying novel risk markers. Notably, plasma biomarkers such as, PSPC-1 (paraspeckle component 1) and midkine have recently been associated with melanoma and lung cancer aggressiveness in OSA patients.4–7 In line, the soluble immune checkpoint biomarker PD-L1 (programmed death-ligand 1) emerged as an immunosuppressive agent related with cancer invasiveness in OSA patients.
Over the past decade, immune checkpoints have emerged as major hallmarks in various cancers, and their inhibition has transformed cancer treatment.8 Among these, TIM-3 (T cell immunoglobulin and mucin-domain containing-3) and its ligand Galectin-9 have been identified as key regulators that suppress anti-cancer immune surveillance.9 sGalectin-9 binds to membrane-bound TIM-3 on T cells, triggering apoptotic signaling and inducing T-cell exhaustion by impairing proliferation and cytokine production (e.g., IL-2, IFN-γ).10 Additionally, Galectin-9/TIM-3 activation promotes the expansion and suppressive function of regulatory T cells (Tregs), leading to immune suppression and tolerance.11 Furthermore, TIM-3 engagement by sGalectin-9 suppresses NK cell degranulation and IFN-γ production, impairing their cytotoxic activity against tumor and virus-infected cells.12 Interestingly, both Galectin-9 and TIM-3 are released in soluble forms that can be readily detected using standard laboratory techniques.9 Although elevated levels of soluble Galectin-9 and TIM-3 have been found in multiple tumour types, studies have not consistently linked these biomarkers to clinical outcomes or overall survival.13 In this multicohort study, we aimed to determine whether plasma concentrations of soluble Galectin-9 and TIM-3 could stratify OSA patients by medium- to long-term cancer mortality risk. Our findings were subsequently validated through cellular phenotyping by flow cytometry and qPCR, supported by in vitro and ex vivo models.
MethodsStudy Design and ParticipantsFig. 1 provides a schematic overview of our analyses. In short, this study included a total of 684 participants from three independent cohorts of patients with and without cancer who underwent an overnight sleep study and completed a sleep questionnaire, as previously described.3 Participants were classified into three groups according to OSA severity: no OSA (AHI< 5events/h); mild OSA (AHI 5–15events/h); and moderate-to-severe OSA (AHI ≥15events/h).

Analysis overview. Detailed information of the three study cohorts including the number of samples of each OSA subgroup, data modality used for measuring biomarker levels and overview of main discovery and validation analyses. OSA: obstructive sleep apnea; SAIL: sleep apnea in lung cancer; SAILS: sleep apnea in lung cancer screening; qPCR: quantitative polymerase chain reaction.
These patients derive from a multicentre, observational cross-sectional study performed at 29 teaching hospitals in Spain, in which they were consecutively recruited from the dermatology or oncology units of each participating centre if they had a diagnosis of invasive cutaneous melanoma and were aged >18 years. Patients were evaluated by a dermatologist, tumours were surgically removed and the following pathologic features were determined: tumour mitotic index, Breslow tumour thickness, Clark level, ulceration and mitotic rate. All patients underwent overnight respiratory polygraphy within a maximum of 6 months after melanoma diagnosis, recording oronasal flow and pressure, thoracic and abdominal respiratory movements, heart rate and arterial oxygen saturation. Exclusion criteria were extra-cutaneous location of melanoma, daytime respiratory or heart failure, and current or previous use of home oxygen therapy, continuous positive airway pressure (CPAP) or non-invasive mechanical ventilation. The study was approved by the local ethics committees (Table S1), and all participants signed an informed consent form.
SAIL-SAILS CohortThis cohort included patients from two prospectively recruited studies investigating the prevalence of OSA in patients at risk for lung cancer included in a lung cancer screening program (SAILS study; NCT02764866) and in patients with newly diagnosed lung cancer (SAIL study; NCT02764866). Briefly, patients included in the SAILS study met the National Lung Screening Trial age and smoking criteria (55–75 years of age and tobacco consumption ≥30 pack-years) and had at least one additional risk factor for lung cancer: chronic obstructive pulmonary disease (COPD) or radiological signs of emphysema. Screened individuals had no evidence or obvious symptoms of lung cancer, concurrent severe disease, unexplained weight loss, or haemoptysis. Testing includes periodic low-dose computed tomography scanning and pulmonary function studies. Details of the screening protocol are available at www.ielcap.org. Patients with newly diagnosed lung cancer were recruited for the SAIL study prior to initiating oncologic or surgical treatment. Among the patients with lung cancer, tumour histology, tumour, node, metastasis (TNM) and stage at diagnosis were collected. Within 6 months after diagnosis, all patients underwent respiratory polygraphy included continuous monitoring of oronasal airflow, pressure, heart rate, chest and abdominal breathing patterns, and oxygen saturation. In both studies, exclusion criteria included current or previous use of home oxygen therapy, known OSA, continuous positive airway pressure (CPAP) treatment or non-invasive mechanical ventilation. All participants signed an informed consent and both studies were approved by the local ethics committee (Fundación Jiménez Díaz University Hospital; EO98/2015 and EO99/2015).
Non-cancer CohortThis cohort included newly diagnosed severe OSA patients and non-apnoeic matched control subjects. Patients aged between 40 and 65 years with an apnoea-hypopnea index (AHI) >30events/h were consecutively recruited from the Pneumology Services of La Paz and Ramon y Cajal University Hospitals, Madrid, Spain. Respiratory polygraphy included continuous monitoring of oronasal airflow, pressure, heart rate, chest and abdominal breathing patterns, and oxygen saturation. Additionally, control subjects (CS), matched for sex, age, and smoking habits with OSA patients, were selected from the census register of the Madrid, Spain metropolitan area. Exclusion criteria were the following: previous or current treatment with oxygen, CPAP or mechanical ventilation; underweight patients (body mass index [BMI] <18.5kg/m2) or those with morbid obesity (BMI >40kg/m2); history of respiratory disease, including chronic obstructive pulmonary disease, asthma or respiratory failure; any infectious disease in the previous 3 months; and the use of inhaled or systemic corticosteroids or other anti-inflammatory drugs. All the participants signed informed consent and the study was approved by the Hospital Universitario La Paz Ethics Committee (PI-3643) and extended to Ramón y Cajal University Hospital.
Further details are available in the supplementary methods. Decisions regarding treatment and treatment modalities for cutaneous melanoma, lung cancer, and OSA, if present, were made by multidisciplinary teams at each participating center, in accordance with current clinical guidelines.14
Blood Collection, Assessment of Circulating Biomarkers and Peripheral Blood Mononuclear Cells AnalysesBlood samples were collected after an overnight fast between 7:00 and 8:00 AM on the morning following respiratory polygraphy. Plasma sample were aliquoted and stored at −80°C. sGalectin-9 and sTIM-3 concentration was measured using a customized bead-based multiplex assay panel (LEGENDplex™ HU Immune Checkpoint Panel 1, from Biolegend, Inc., San Diego, CA, USA), following the standard protocol as indicated by manufacturer. Briefly, bead-based assays consist of microspheres with distinct sizes and fluorescence intensities, each coated with a specific capture antibody. Target analytes bind to their respective beads, followed by biotinylated detection antibodies, forming a bead–analyte–antibody sandwich, as in ELISA assays. Streptavidin–phycoerythrin is then added to generate a fluorescence signal proportional to analyte concentration. Flow cytometry differentiates bead populations and quantifies fluorescence, enabling simultaneous analyte concentration determination using a standard curve. The detection limits for each bead were: 4.73pg/mL for sTIM-3 and 41.20pg/mL for sGalectin-9. For the Pure OSA cohort inflammatory cytokines were also assessed using customized a bead-based multiplex assay panel (BD™ Human Inflammatory Cytokine Cytometric Bead Array (CBA) – I Kit from BD Bioscience, Belgium), following the manufacturer's protocol. The detection limits for each bead were: 7.2pg/mL for IL-1β, 2.5pg/mL for IL-6, 3.7pg/mL for TNF-α. The intraassay and interassay variations were <20% in the various assays.
Peripheral blood mononuclear cells (PBMCs) were separated through centrifugation, employing a Ficoll-Paque Plus (Amersham Bioscience, Uppsala, Sweden) density gradient. Subsequently, 5×10⁶ PBMCs were seeded into each well of 6-well plates. These cells were then cultured in Roswell Park Memorial Institute (RPMI) 1640 medium supplemented with 100U/mL penicillin and 100μg/mL streptomycin, along with 10% foetal bovine serum (FBS).15 Cells were incubated for 16h at 37°C in a 5% CO2 environment. Following a 16-h incubation, the cells were collected and stained for 30min at 4°C in darkness, using the anti-human antibodies listed in Table S2. Subsequently, they were washed with PBS (phosphate buffered saline) containing 1% FBS. For intracellular staining cells were permeabilized using the transcription factor buffer set (BD Bioscience, Belgium). Appropriate isotype controls were used for each experiment. Finally, cells were acquired using BD FACS-Celesta flow cytometer (Becton-Dickinson Biosciences, Belgium), and data were analysed using FlowJo vX.0.7 software (FlowJo, USA). Gating strategy is shown in Supplemental Fig. 1.
RNA was obtained from PBMCs using the High Pure RNA Isolation Kit (Roche Diagnostics, Rotkreuz, Switzerland). In both cohorts, RNA was quantified and complementary DNA (cDNA) was obtained by reverse transcription of 1μg RNA using the High-Capacity cDNA Reverse Transcription kit (Applied Biosystems, Waltham, MA, USA). cDNA levels were measured using CFX96 Touch Real-Time PCR Detection System (Bio-Rad Laboratories, Hercules, CA, USA), NZYSupreme qPCR Green Master Mix (2x) (NZYTech, Portugal), and specific primers (Table S3). The results were normalized to the expression of 18S, and the cDNA copy number of each gene of interest was determined using a 6-point standard curve.
In Vitro and Ex Vivo ModelsIntermittent Hypoxia In Vitro ModelIn order to generate the intermittent hypoxia (IH) conditions, we cultured healthy PBMCs in an incubation chamber linked to an external computer-controlled oxygen/nitrogen controller, using the BioSpherix OxyCycler C42 system (Redfield, NY, USA). This system produces cyclical alterations in oxygen levels while maintaining CO2 levels, regulating the air gas composition within each chamber.16,17 In Supplemental Fig. 2 we show typical recording of O2 and CO2 levels during a set of cycles and a schematic representation of a single cycle. In addition, to inhibit Hypoxia Inducible Factor (HIF-1α), PBMCs were treated with 30μM PX-478 (MedKoo Biosciences, Morrisville, NC, USA) for 16h.18 Effective inhibition of HIF-1α pathway upon PX-478 treatment is shown in Supplemental Fig. 3.
Proliferation Ex Vivo AssaysFor the proliferation assays 2×10⁵ PBMCs were labelled with Carboxy Fluorescein Succinimidyl Ester (CFSE, ThermoFisher, Darmstadt, Germany). Then, PBMCs were stimulated or not with 2.5μg/mL lectin from Phytolacca americana pokeweed mitogen (Merck Life Science, Bayswater, Victoria, Australia). The cells were cultured for 4 days and then stained with specific human antibodies for CD4 (APC) or CD8 (APC) (4A-100T, 8A-100T respectively, Inmunostep, Salamanca Spain). Cells were acquired by flow cytometry with the FACS-Calibur flow cytometer (BD-Biosciences, Eysins, Switzerland) and data were analysed using FlowJo vX.0.7 software (FlowJo, USA).
Statistical AnalysisDemographic and clinical characteristics are presented as mean (standard deviation) for continuous variables and as absolute values with percentages for categorical variables. Comparisons among participant groups were performed using one-way ANOVA with Holm–Sidak correction for multiple comparisons, the χ2 test, or two-sided Student's t-test, as appropriate. Correlations between continuous variables were assessed using Spearman's correlation. Survival curves comparing patients with low and high biomarker levels were generated using unadjusted Kaplan–Meier estimates, with all-cause mortality as the event. Cut-off points for high and low biomarker groups were established using the maximally selected rank statistics from the ‘maxstat’ R package. Associations between biomarkers levels and mortality risk were evaluated using Cox proportional hazards regression models, with hazard ratios (HRs) adjusted for age at diagnosis, sex, and cancer presence. Data distributions were assessed with the Anderson–Darling and D’Agostino–Pearson tests. All statistical tests employed a two-sided 5% significance level. Statistical analyses were conducted using GraphPad Prism (version 8.2.0) and the R statistical programming language (version 4.3.1) with the survival (version 3.5.7), rmeta (3.0) and forestplot (3.1.3) packages.
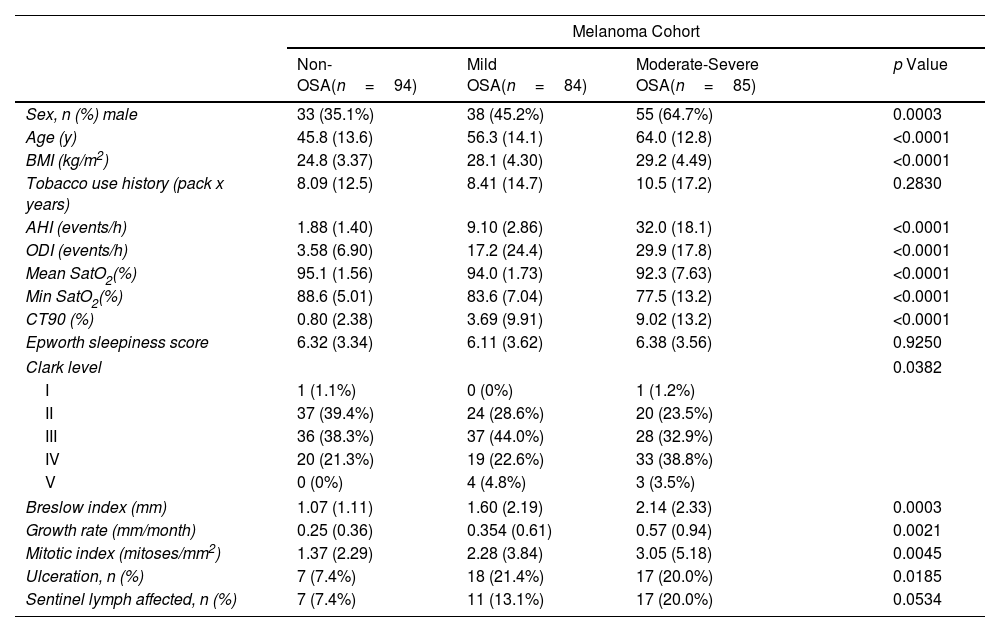
ResultsThe clinical cohorts and primary objectives of this study are outlined in Fig. 1. Table 1 presents the main demographic and clinical characteristics of the cohorts.
General Characteristics of the Study Groups.
| Melanoma Cohort | ||||
|---|---|---|---|---|
| Non-OSA(n=94) | Mild OSA(n=84) | Moderate-Severe OSA(n=85) | p Value | |
| Sex, n (%) male | 33 (35.1%) | 38 (45.2%) | 55 (64.7%) | 0.0003 |
| Age (y) | 45.8 (13.6) | 56.3 (14.1) | 64.0 (12.8) | <0.0001 |
| BMI (kg/m2) | 24.8 (3.37) | 28.1 (4.30) | 29.2 (4.49) | <0.0001 |
| Tobacco use history (pack x years) | 8.09 (12.5) | 8.41 (14.7) | 10.5 (17.2) | 0.2830 |
| AHI (events/h) | 1.88 (1.40) | 9.10 (2.86) | 32.0 (18.1) | <0.0001 |
| ODI (events/h) | 3.58 (6.90) | 17.2 (24.4) | 29.9 (17.8) | <0.0001 |
| Mean SatO2(%) | 95.1 (1.56) | 94.0 (1.73) | 92.3 (7.63) | <0.0001 |
| Min SatO2(%) | 88.6 (5.01) | 83.6 (7.04) | 77.5 (13.2) | <0.0001 |
| CT90 (%) | 0.80 (2.38) | 3.69 (9.91) | 9.02 (13.2) | <0.0001 |
| Epworth sleepiness score | 6.32 (3.34) | 6.11 (3.62) | 6.38 (3.56) | 0.9250 |
| Clark level | 0.0382 | |||
| I | 1 (1.1%) | 0 (0%) | 1 (1.2%) | |
| II | 37 (39.4%) | 24 (28.6%) | 20 (23.5%) | |
| III | 36 (38.3%) | 37 (44.0%) | 28 (32.9%) | |
| IV | 20 (21.3%) | 19 (22.6%) | 33 (38.8%) | |
| V | 0 (0%) | 4 (4.8%) | 3 (3.5%) | |
| Breslow index (mm) | 1.07 (1.11) | 1.60 (2.19) | 2.14 (2.33) | 0.0003 |
| Growth rate (mm/month) | 0.25 (0.36) | 0.354 (0.61) | 0.57 (0.94) | 0.0021 |
| Mitotic index (mitoses/mm2) | 1.37 (2.29) | 2.28 (3.84) | 3.05 (5.18) | 0.0045 |
| Ulceration, n (%) | 7 (7.4%) | 18 (21.4%) | 17 (20.0%) | 0.0185 |
| Sentinel lymph affected, n (%) | 7 (7.4%) | 11 (13.1%) | 17 (20.0%) | 0.0534 |
| SAIL-SAILS Cohort | ||||
|---|---|---|---|---|
| Non-OSA(n=44) | Mild OSA(n=57) | Moderate-Severe OSA(n=65) | p Value | |
| Sex, n (%) male | 17 (38.6%) | 29 (50.9%) | 43 (66.2%) | 0.0161 |
| Age (y) | 62.1 (7.21) | 62.9 (6.70) | 65.5 (7.99) | 0.0162 |
| BMI (kg/m2) | 25.8 (4.70) | 28.3 (3.97) | 29.4 (4.95) | 0.0001 |
| Tobacco use history (pack x years) | 43 (13) | 51 (21) | 49 (18) | 0.173 |
| AHI (events/h) | 2.61 (1.48) | 9.14 (2.81) | 34.2 (17.6) | <0.0001 |
| ODI (events/h) | 2.78 (2.14) | 8.82 (3.26) | 33.8 (18.9) | <0.0001 |
| Mean SatO2(%) | 91.5 (2.06) | 90.8 (2.71) | 90.7 (2.33) | 0.1070 |
| Min SatO2(%) | 86.0 (3.44) | 82.3 (5.89) | 78.5 (7.00) | <0.0001 |
| CT90 (%) | 15.2 (26.2) | 26·1 (34.7) | 27.0 (25.8) | 0.0511 |
| Epworth sleepiness score | – | – | – | – |
| Tumour stage | 0.3429 | |||
| 0 | 34 (77.3%) | 48 (84.2%) | 43 (66.2%) | |
| I | 2 (4.5%) | 3 (5.3%) | 7 (10.8%) | |
| II | 0 (0%) | 1 (1.8%) | 1 (1.5%) | |
| III | 2 (4.5%) | 3 (5.3%) | 7 (10.8%) | |
| IV | 6 (13.6%) | 2 (3.5%) | 7 (10.8%) | |
| Non-cancer Cohort | |||
|---|---|---|---|
| Non-OSA(n=85) | Severe OSA(n=170) | p Value | |
| Sex, n (%) male | 59 (69.4%) | 126 (74.1%) | 0.4479 |
| Age (y) | 59.6 (6.80) | 59.4 (12.1) | 0.8420 |
| BMI (kg/m2) | 25.3 (2.12) | 34.6 (9.27) | <0.0001 |
| Smoking habit | 0.3945 | ||
| Never | 68 (80%) | 116 (68.2%) | |
| Current | 10 (11.8%) | 28 (16.5%) | |
| Former | 7 (8.2%) | 26 (15.3%) | |
| AHI (events/h) | 2.38 (1.51) | 53.2 (16.7) | <0.0001 |
| ODI (events/h) | 3.91 (4.85) | 50.7 (18.6) | <0.0001 |
| Mean SatO2(%) | 95.8 (1.96) | 89.7 (3.12) | 0.2941 |
| Min SatO2(%) | 87.3 (4.57) | 72.1 (8.93) | 0.0090 |
| CT90 (%) | 9.83 (19.4) | 38.2 (29.1) | <0.0001 |
| Epworth sleepiness score | 7.84 (5.32) | 9.25 (5.07) | 0.8083 |
BMI: body mass index; AHI: apnea-hypopnea index; ODI: oxygen desaturation index; CT90: time recorded with SaO2 <90%; SaO2: oxyhemoglobin saturation.
We began by analysing plasma concentrations of sGalectin-9 and sTIM-3 in the melanoma cohort (n=263). Our results demonstrated a noteworthy increase in both biomarkers among patients manifesting advanced stages of melanoma, as assessed by Clark levels (Fig. 2A and B). Correspondingly, the biomarker levels also exhibited a positive correlation with the Breslow index and tumour growth rate (Fig. 2C–F). Consistently, biomarker levels were elevated in patients displaying a higher mitotic index (Fig. 2G and H), corroborating a direct association between circulating levels of sGalectin-9 and sTIM-3 and the progression of tumour growth. Furthermore, we evaluated these associations, stratifying by the presence and severity of OSA. Notably, in patients without OSA, sGalectin-9 and sTIM-3 were not related to clinical indicators of melanoma aggressiveness. In contrast, sGalectin-9 and sTIM-3 levels were consistently associated with markers of melanoma severity in patients with mild and moderate-to-severe OSA, respectively. In order to corroborate this association and investigate its potential relevance in other types of cancer, we analysed the SAIL cohort comprising lung cancer patients. As with melanoma patients, lung cancer patients showed elevated levels of both biomarkers in individuals with larger tumour sizes (Fig. 3A and B).
 Violin plots showing sGalectin-9 (A) and sTIM-3 (B) expression distribution along Clark levels in the melanoma cohort, right panels show expression distribution in the different cohort subgroups: no OSA (upper panels, blue), mild OSA (middle panels, orange), moderate-severe OSA (lower panels, red). Comparisons were assessed by one-way ANOVA test corrected for multiple testing by means of Holm–Sidak")
Association of sGalectin-9 and sTIM-3 with melanoma severity indices. (A and B) Violin plots showing sGalectin-9 (A) and sTIM-3 (B) expression distribution along Clark levels in the melanoma cohort, right panels show expression distribution in the different cohort subgroups: no OSA (upper panels, blue), mild OSA (middle panels, orange), moderate-severe OSA (lower panels, red). Comparisons were assessed by one-way ANOVA test corrected for multiple testing by means of Holm–Sidak's method. (C and D) Spearman rank correlation between sGalectin-9 (C) or sTIM-3 (D) and the corresponding Breslow index, in the melanoma cohort, right panels show expression distribution in the different cohort subgroups: no OSA (upper panels, blue), mild OSA (middle panels, orange), moderate-severe OSA (lower panels, red). (E and F) Spearman rank correlation between sGalectin-9 (E) or sTIM-3 (F) and the corresponding tumour growth rate, in the melanoma cohort, right panels show expression distribution in the different cohort subgroups: no OSA (upper panels, blue), mild OSA (middle panels, orange), moderate-severe OSA (lower panels, red). The line represents the regression line, and the shading represents the 95% CI. (G and H) sGalectin-9 (G) and sTIM-3 (H) expression distribution along mitotic index in the melanoma cohort, right panels show expression distribution in the different cohort subgroups: no OSA (upper panels, blue), mild OSA (middle panels, orange), moderate-severe OSA (lower panels, red). Comparisons were assessed by one-way ANOVA test corrected for multiple testing by means of the Holm–Sidak's method.
 Violin plots showing sGalectin-9 (A) and sTIM-3 (B) expression distribution among tumour size in the patients with lung cancer from the SAIL-SAILS cohort (SAIL cohort). Right panels show expression distribution in the different cohort subgroups: no OSA (upper panels, blue), mild OSA (middle panels, orange), moderate-severe OSA (lower panels, red). Comparisons were assessed by one-way ANOVA test corrected for multiple testing by use of the Holm–Sidak")
Association of sGalectin-9 and sTIM-3 with lung tumour size. (A and B) Violin plots showing sGalectin-9 (A) and sTIM-3 (B) expression distribution among tumour size in the patients with lung cancer from the SAIL-SAILS cohort (SAIL cohort). Right panels show expression distribution in the different cohort subgroups: no OSA (upper panels, blue), mild OSA (middle panels, orange), moderate-severe OSA (lower panels, red). Comparisons were assessed by one-way ANOVA test corrected for multiple testing by use of the Holm–Sidak's method.
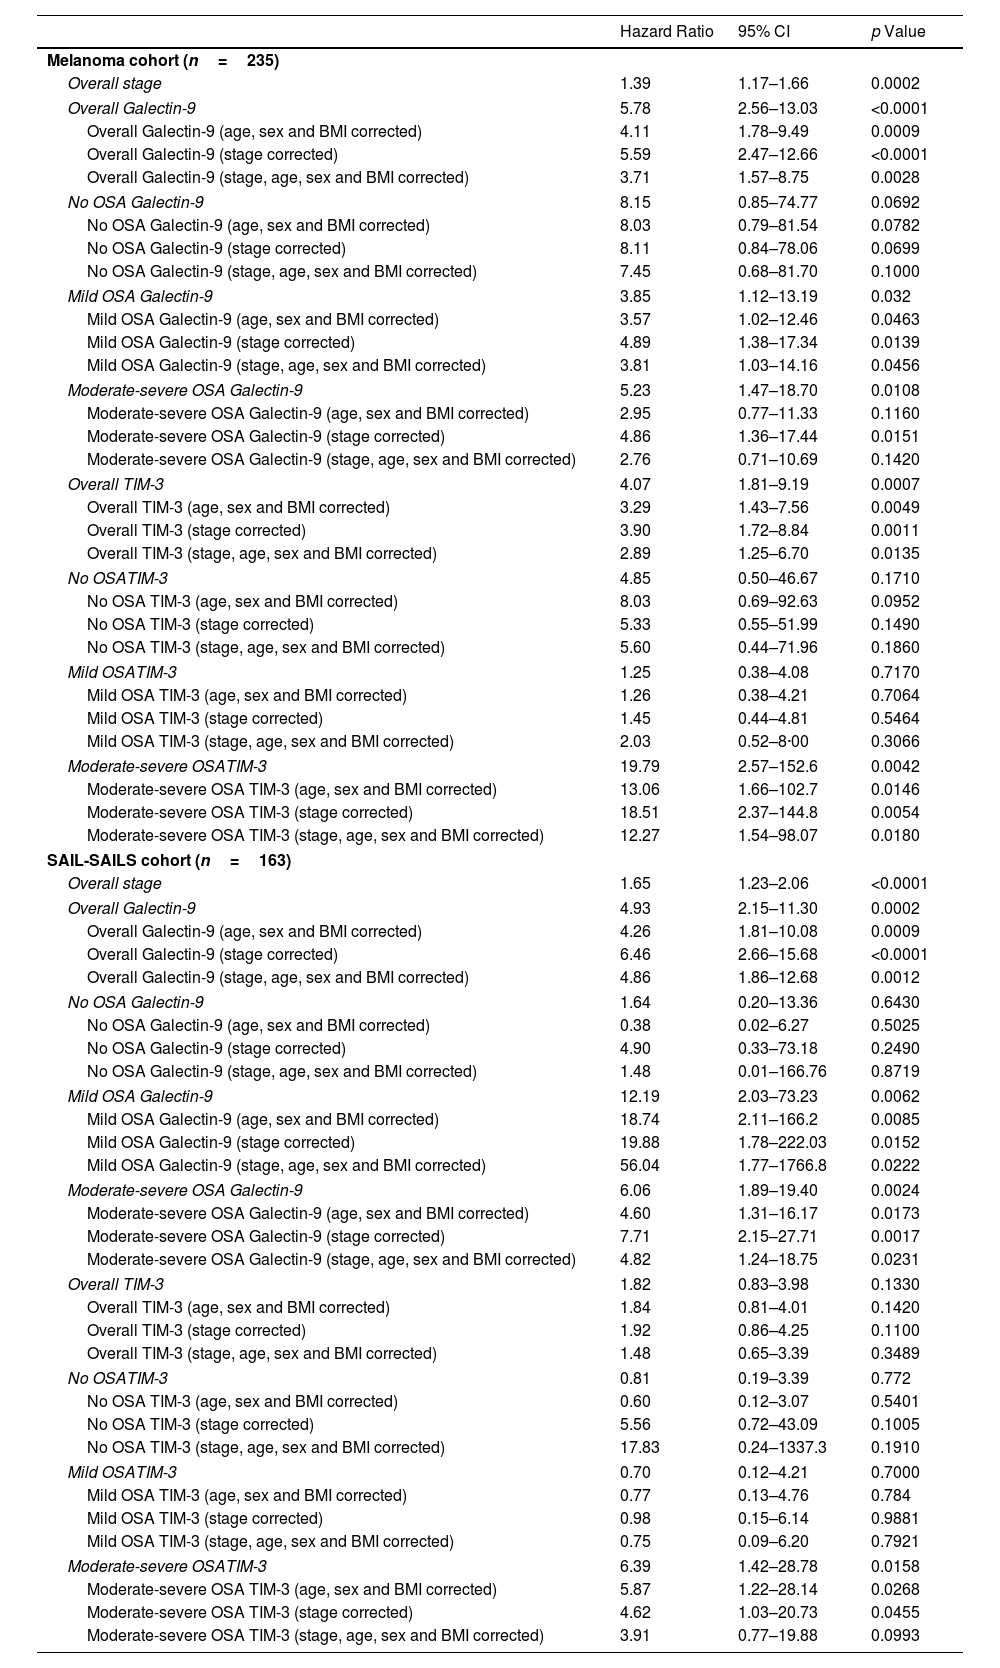
Interestingly, our observations revealed heightened levels of both biomarkers in deceased patients, evident in both the melanoma and SAIL cohorts (Supplemental Fig. 4). Kaplan–Meier curves demonstrated that elevated levels of sGalectin-9 or sTIM-3 were linked to an increased mortality risk in patients with moderate-to-severe OSA, whereas this association was absent in patients with mild or no OSA (Fig. 4A–D). Further analysis examined the role of biomarker concentration as an independent risk factor for mortality, adjusting for tumour stage. Elevated levels of sGalectin-9 and sTIM-3 were indeed associated with an increased risk of all-cause mortality in melanoma patients with moderate-to-severe OSA (Fig. 4E and F and Table 2).
 Survival curves for melanoma patients stratified by sGalectin-9 plasma levels (high: ≥3.7×10⁴pg/mL; low: <3.7×10⁴pg/mL), and by OSA severity group (no OSA: AHI <5; mild OSA: AHI 5–15; moderate-severe OSA: AHI >15). (B) Survival curves for melanoma patients stratified by sTIM-3 plasma levels (high: ≥1.17×10³pg/mL; low: <1.17×10³pg/mL), and by OSA severity group (no OSA: AHI <5; mild OSA: AHI 5–15; moderate-severe OSA: AHI >15). (C) Survival curves for SAIL-SAILS patients stratified by sGalectin-9 plasma levels (high: >1×10⁵pg/mL; low: ≤1×10⁵pg/mL), and by OSA severity group (no OSA: AHI <5; mild OSA: AHI 5–15; moderate-severe OSA: AHI >15). (D) Survival curves for melanoma patients stratified by sTIM-3 plasma levels (High: >1.33×10³pg/mL; low: ≤1.33×10³pg/mL), and by OSA severity group (no OSA: AHI <5; mild OSA: AHI 5–15; moderate-severe OSA: AHI >15). HR (95% CI) and p-values adjusted for sex and age at diagnosis are shown. (E and F) Forests plots showing hazard ratios (HR) for all-cause mortality in melanoma and SAIL-SAILS cancer patients stratified by sGalectin-9 (E), sTIM-3 (F) and adjusted for tumour stage.")
sGalectin-9 and sTIM-3 association with survival of patients with melanoma and lung cancer. (A) Survival curves for melanoma patients stratified by sGalectin-9 plasma levels (high: ≥3.7×10⁴pg/mL; low: <3.7×10⁴pg/mL), and by OSA severity group (no OSA: AHI <5; mild OSA: AHI 5–15; moderate-severe OSA: AHI >15). (B) Survival curves for melanoma patients stratified by sTIM-3 plasma levels (high: ≥1.17×10³pg/mL; low: <1.17×10³pg/mL), and by OSA severity group (no OSA: AHI <5; mild OSA: AHI 5–15; moderate-severe OSA: AHI >15). (C) Survival curves for SAIL-SAILS patients stratified by sGalectin-9 plasma levels (high: >1×10⁵pg/mL; low: ≤1×10⁵pg/mL), and by OSA severity group (no OSA: AHI <5; mild OSA: AHI 5–15; moderate-severe OSA: AHI >15). (D) Survival curves for melanoma patients stratified by sTIM-3 plasma levels (High: >1.33×10³pg/mL; low: ≤1.33×10³pg/mL), and by OSA severity group (no OSA: AHI <5; mild OSA: AHI 5–15; moderate-severe OSA: AHI >15). HR (95% CI) and p-values adjusted for sex and age at diagnosis are shown. (E and F) Forests plots showing hazard ratios (HR) for all-cause mortality in melanoma and SAIL-SAILS cancer patients stratified by sGalectin-9 (E), sTIM-3 (F) and adjusted for tumour stage.
Hazard Ratios (HRs) Adjusted for Relevant Covariates, Presented With 95% Confidence Intervals (CI). The Table Summarizes the Associations Between Biomarker Levels and Risk of Mortality, Adjusted for Factors Such as Age, Sex, Body Mass Index (BMI) and Tumour Stage.
| Hazard Ratio | 95% CI | p Value | |
|---|---|---|---|
| Melanoma cohort (n=235) | |||
| Overall stage | 1.39 | 1.17–1.66 | 0.0002 |
| Overall Galectin-9 | 5.78 | 2.56–13.03 | <0.0001 |
| Overall Galectin-9 (age, sex and BMI corrected) | 4.11 | 1.78–9.49 | 0.0009 |
| Overall Galectin-9 (stage corrected) | 5.59 | 2.47–12.66 | <0.0001 |
| Overall Galectin-9 (stage, age, sex and BMI corrected) | 3.71 | 1.57–8.75 | 0.0028 |
| No OSA Galectin-9 | 8.15 | 0.85–74.77 | 0.0692 |
| No OSA Galectin-9 (age, sex and BMI corrected) | 8.03 | 0.79–81.54 | 0.0782 |
| No OSA Galectin-9 (stage corrected) | 8.11 | 0.84–78.06 | 0.0699 |
| No OSA Galectin-9 (stage, age, sex and BMI corrected) | 7.45 | 0.68–81.70 | 0.1000 |
| Mild OSA Galectin-9 | 3.85 | 1.12–13.19 | 0.032 |
| Mild OSA Galectin-9 (age, sex and BMI corrected) | 3.57 | 1.02–12.46 | 0.0463 |
| Mild OSA Galectin-9 (stage corrected) | 4.89 | 1.38–17.34 | 0.0139 |
| Mild OSA Galectin-9 (stage, age, sex and BMI corrected) | 3.81 | 1.03–14.16 | 0.0456 |
| Moderate-severe OSA Galectin-9 | 5.23 | 1.47–18.70 | 0.0108 |
| Moderate-severe OSA Galectin-9 (age, sex and BMI corrected) | 2.95 | 0.77–11.33 | 0.1160 |
| Moderate-severe OSA Galectin-9 (stage corrected) | 4.86 | 1.36–17.44 | 0.0151 |
| Moderate-severe OSA Galectin-9 (stage, age, sex and BMI corrected) | 2.76 | 0.71–10.69 | 0.1420 |
| Overall TIM-3 | 4.07 | 1.81–9.19 | 0.0007 |
| Overall TIM-3 (age, sex and BMI corrected) | 3.29 | 1.43–7.56 | 0.0049 |
| Overall TIM-3 (stage corrected) | 3.90 | 1.72–8.84 | 0.0011 |
| Overall TIM-3 (stage, age, sex and BMI corrected) | 2.89 | 1.25–6.70 | 0.0135 |
| No OSATIM-3 | 4.85 | 0.50–46.67 | 0.1710 |
| No OSA TIM-3 (age, sex and BMI corrected) | 8.03 | 0.69–92.63 | 0.0952 |
| No OSA TIM-3 (stage corrected) | 5.33 | 0.55–51.99 | 0.1490 |
| No OSA TIM-3 (stage, age, sex and BMI corrected) | 5.60 | 0.44–71.96 | 0.1860 |
| Mild OSATIM-3 | 1.25 | 0.38–4.08 | 0.7170 |
| Mild OSA TIM-3 (age, sex and BMI corrected) | 1.26 | 0.38–4.21 | 0.7064 |
| Mild OSA TIM-3 (stage corrected) | 1.45 | 0.44–4.81 | 0.5464 |
| Mild OSA TIM-3 (stage, age, sex and BMI corrected) | 2.03 | 0.52–8·00 | 0.3066 |
| Moderate-severe OSATIM-3 | 19.79 | 2.57–152.6 | 0.0042 |
| Moderate-severe OSA TIM-3 (age, sex and BMI corrected) | 13.06 | 1.66–102.7 | 0.0146 |
| Moderate-severe OSA TIM-3 (stage corrected) | 18.51 | 2.37–144.8 | 0.0054 |
| Moderate-severe OSA TIM-3 (stage, age, sex and BMI corrected) | 12.27 | 1.54–98.07 | 0.0180 |
| SAIL-SAILS cohort (n=163) | |||
| Overall stage | 1.65 | 1.23–2.06 | <0.0001 |
| Overall Galectin-9 | 4.93 | 2.15–11.30 | 0.0002 |
| Overall Galectin-9 (age, sex and BMI corrected) | 4.26 | 1.81–10.08 | 0.0009 |
| Overall Galectin-9 (stage corrected) | 6.46 | 2.66–15.68 | <0.0001 |
| Overall Galectin-9 (stage, age, sex and BMI corrected) | 4.86 | 1.86–12.68 | 0.0012 |
| No OSA Galectin-9 | 1.64 | 0.20–13.36 | 0.6430 |
| No OSA Galectin-9 (age, sex and BMI corrected) | 0.38 | 0.02–6.27 | 0.5025 |
| No OSA Galectin-9 (stage corrected) | 4.90 | 0.33–73.18 | 0.2490 |
| No OSA Galectin-9 (stage, age, sex and BMI corrected) | 1.48 | 0.01–166.76 | 0.8719 |
| Mild OSA Galectin-9 | 12.19 | 2.03–73.23 | 0.0062 |
| Mild OSA Galectin-9 (age, sex and BMI corrected) | 18.74 | 2.11–166.2 | 0.0085 |
| Mild OSA Galectin-9 (stage corrected) | 19.88 | 1.78–222.03 | 0.0152 |
| Mild OSA Galectin-9 (stage, age, sex and BMI corrected) | 56.04 | 1.77–1766.8 | 0.0222 |
| Moderate-severe OSA Galectin-9 | 6.06 | 1.89–19.40 | 0.0024 |
| Moderate-severe OSA Galectin-9 (age, sex and BMI corrected) | 4.60 | 1.31–16.17 | 0.0173 |
| Moderate-severe OSA Galectin-9 (stage corrected) | 7.71 | 2.15–27.71 | 0.0017 |
| Moderate-severe OSA Galectin-9 (stage, age, sex and BMI corrected) | 4.82 | 1.24–18.75 | 0.0231 |
| Overall TIM-3 | 1.82 | 0.83–3.98 | 0.1330 |
| Overall TIM-3 (age, sex and BMI corrected) | 1.84 | 0.81–4.01 | 0.1420 |
| Overall TIM-3 (stage corrected) | 1.92 | 0.86–4.25 | 0.1100 |
| Overall TIM-3 (stage, age, sex and BMI corrected) | 1.48 | 0.65–3.39 | 0.3489 |
| No OSATIM-3 | 0.81 | 0.19–3.39 | 0.772 |
| No OSA TIM-3 (age, sex and BMI corrected) | 0.60 | 0.12–3.07 | 0.5401 |
| No OSA TIM-3 (stage corrected) | 5.56 | 0.72–43.09 | 0.1005 |
| No OSA TIM-3 (stage, age, sex and BMI corrected) | 17.83 | 0.24–1337.3 | 0.1910 |
| Mild OSATIM-3 | 0.70 | 0.12–4.21 | 0.7000 |
| Mild OSA TIM-3 (age, sex and BMI corrected) | 0.77 | 0.13–4.76 | 0.784 |
| Mild OSA TIM-3 (stage corrected) | 0.98 | 0.15–6.14 | 0.9881 |
| Mild OSA TIM-3 (stage, age, sex and BMI corrected) | 0.75 | 0.09–6.20 | 0.7921 |
| Moderate-severe OSATIM-3 | 6.39 | 1.42–28.78 | 0.0158 |
| Moderate-severe OSA TIM-3 (age, sex and BMI corrected) | 5.87 | 1.22–28.14 | 0.0268 |
| Moderate-severe OSA TIM-3 (stage corrected) | 4.62 | 1.03–20.73 | 0.0455 |
| Moderate-severe OSA TIM-3 (stage, age, sex and BMI corrected) | 3.91 | 0.77–19.88 | 0.0993 |
We next examined the impact of OSA severity on sGalectin-9 and sTIM-3 expression. Among melanoma patients, sGalectin-9 levels were significantly elevated in those with mild or moderate-to-severe OSA compared to those without OSA (Fig. 5A). Accordingly, levels of sGalectin-9 were also correlated with key indicators of OSA severity, including the AHI, oxygen desaturation index (ODI), and percentage of time with oxygen saturation <90% (CT90) (Fig. 5B–D). Similarly, sTIM-3 levels were elevated in melanoma patients with moderate-to-severe OSA and correlated significantly with AHI and ODI, though not with CT90 (Fig. 5E–H). These findings were confirmed in the combined SAIL-SAILS cohort, where both biomarkers showed higher levels in moderate-to-severe OSA patients compared to those without OSA (Fig. 5I and J). Moreover, in this cohort, sGalectin-9 levels correlated with AHI, ODI, and CT90 (Fig. 5K–M), while sTIM-3 levels correlated with AHI and ODI (Fig. 5N–P).
 Violin plots showing sGalectin-9 expression distribution along sleep apnea severity groups in the melanoma cohort. Comparisons were assessed by one-way ANOVA test corrected for multiple testing by use of the Holm–Sidak")
sGalectin-9 and sTIM-3 association with sleep apnea severity. (A) Violin plots showing sGalectin-9 expression distribution along sleep apnea severity groups in the melanoma cohort. Comparisons were assessed by one-way ANOVA test corrected for multiple testing by use of the Holm–Sidak's method. (B–D) Spearman rank correlation between sGalectin-9 and the corresponding (B) apnea-hypopnoea index (AHI), (C) oxygen desaturation index (ODI) and (D) percentage of time with an oxygen saturation <90% (CT90), in the melanoma cohort. The line represents the regression line, and the shading represents the 95% CI. (E) sTIM-3 expression distribution along sleep apnea severity groups. Comparisons were assessed by one-way ANOVA test corrected for multiple testing by use of the Holm–Sidak's method. (F–H) Spearman rank correlation between sTIM-3 and the corresponding (F) apnea hypopnoea index (AHI), (G) oxygen desaturation index (ODI) and (H) percentage of time with oxygen saturation <90% (CT90), in the melanoma cohort. The line represents the regression line, and the shading represents the 95% CI. (I and J) Violin plots showing (I) sGalectin-9 and (J) sTIM-3 expression distribution along sleep apnea severity groups in the SAIL-SAILS combined cohort. Comparisons were assessed by one-way ANOVA test corrected for multiple testing by use of the Holm–Sidak's method. (K–M) Spearman rank correlation between sGalectin-9 and the corresponding (K) apnea-hypopnoea index (AHI), (L) oxygen desaturation index (ODI) and (M) percentage of time with oxygen saturation <90% (CT90), in the SAIL-SAILS combined cohort. (N–P) Spearman rank correlation between sTIM-3 and the corresponding (N) apnea hypopnoea index (AHI), (O) oxygen desaturation index (ODI) and (P) percentage of time with an oxygen saturation <90% (CT90), in the SAIL-SAILS combined cohort. The line represents the regression line, and the shading represents the 95% CI.
To explore the source and functionality of these biomarkers, we assessed Galectin-9 and TIM-3 expression in plasma and PBMC of severe OSA patients within the non-cancer cohort. Patients with severe OSA exhibited significantly elevated plasma levels of sGalectin-9 and sTIM-3 compared to non-apneic subjects (Fig. 6A and B). Moreover, flow cytometry analysis showed increased Galectin-9 overexpression on CD14+ monocytes, as well as TIM-3 expression on CD4+ and CD8+ T-lymphocytes from severe OSA patients (Fig. 6C–E, Supplemental Fig. 1). mRNA expression analysis by qPCR revealed upregulation of the genes encoding these biomarkers in PBMCs from severe OSA patients (Fig. 6F and G). Furthermore, plasma sGalectin-9 levels correlated positively with Galectin-9+ monocyte numbers, while plasma sTIM-3 levels correlated with TIM-3+CD8+ T-lymphocytes (Fig. 6H). These findings suggest that PBMCs may contribute to elevated plasma levels of sGalectin-9 and sTIM-3 in severe OSA patients without cancer. Supporting this, supernatants from PBMC cultures of severe OSA patients showed higher levels of sGalectin-9 and sTIM-3 compared to non-OSA subjects (Fig. 6I and J).
 Violin plots showing (A) sGalectin-9 and (B) sTIM-3 expression distribution in non-apnoeic subjects (CS or control subjects) and severe OSA patients without cancer evidence from the non-cancer cohort. (C) Violin plots showing percentage of monocytes (CD14+) that express Galectin-9 (Galectin-9+) determined by flow cytometry in randomly selected CS (n=63) and OSA (n=125) patients from the non-cancer cohort. (D and E) Percentage of (D) CD4+ (E) CD8+ T-lymphocytes that expressed high levels of TIM-3 (TIM-3+) determined by flow cytometry in randomly selected CS (n=63) and OSA patients (n=125) from the non-cancer cohort. Comparisons were assessed by used two-sided Student")
Galectin and TIM-3 expression in OSA patient PBMC. (A and B) Violin plots showing (A) sGalectin-9 and (B) sTIM-3 expression distribution in non-apnoeic subjects (CS or control subjects) and severe OSA patients without cancer evidence from the non-cancer cohort. (C) Violin plots showing percentage of monocytes (CD14+) that express Galectin-9 (Galectin-9+) determined by flow cytometry in randomly selected CS (n=63) and OSA (n=125) patients from the non-cancer cohort. (D and E) Percentage of (D) CD4+ (E) CD8+ T-lymphocytes that expressed high levels of TIM-3 (TIM-3+) determined by flow cytometry in randomly selected CS (n=63) and OSA patients (n=125) from the non-cancer cohort. Comparisons were assessed by used two-sided Student's t test with Welch's correction. (F and G) mRNA relative expression of the genes encoding for (F) Galectin-9 [LGALS9] and (G) TIM-3 [HAVCR2] determined by qPCR in randomly selected CS (n=63) and OSA patients (n=125) from the non-cancer cohort. (H) Correlogram showing the correlations between the expression of the soluble and leukocyte forms of Galectin-9 and TIM-3 and the apnea-hypopnoea index (AHI) and several immune related biomarkers assessed in the non-cancer cohort. (I and J) Box and whiskers plots showing (I) sGalectin-9 and (J) sTIM-3 supernatant concentration from PBMC culture of randomly selected controls subjects CS (n=25) and OSA patients (n=50) from the non-cancer cohort. (K and L) Healthy volunteer's (n=8) peripheral blood mononuclear cells (PBMCs) were cultured under normoxia (N) or intermittent hypoxia (IH) conditions and treated or not with a specific inhibitor for HIF-1α (PX-478, 30μM) for 16h, the percentage of (K) monocytes that express Galectin-9, (L) CD4+ or (M) CD8+ T-lymphocytes that expressed high levels of (TIM-3+) determined by flow cytometry and the supernatant concentration of the soluble forms (N) sGalectin-9 and (O) sTIM-3 is shown. Comparisons between groups were performed by two-way ANOVA with Tukey's correction for multiple comparison tests.
Considering intermittent hypoxia as a hallmark of OSA, we investigated its effect on biomarker upregulation using an in vitro intermittent hypoxia model that mimics OSA by cycling oxygen levels while maintaining stable CO2 levels. Under intermittent hypoxia, healthy monocytes showed increased Galectin-9 levels (Fig. 6K), and T-lymphocytes upregulated TIM-3 expression (Fig. 6L and M). Additionally, culture supernatant under intermittent hypoxia conditions showed elevated concentrations of both biomarkers (Fig. 6N and O). To confirm the role of hypoxemia, we inhibited HIF-1α, a master regulator of hypoxic response, using PX-478, which reduced biomarker levels under hypoxic conditions (Supplemental Fig. S3), supporting the involvement of hypoxia in the activation of the TIM-3/Galectin-9 pathway in OSA.
Galectin-9 and TIM-3 in OSA Immune ContextFinally, we explored the immune functionality of the TIM-3/Galectin-9 pathway in severe OSA subjects by evaluating plasma inflammatory cytokines and immune markers related to T-cell function. Our results indicated a positive correlation between TIM-3/Galectin-9 levels and inflammatory cytokines, while T-cell proliferation and certain infiltration markers showed a negative correlation. Notably, TIM-3 expression on T cells correlated positively with perforin, a cytolytic protein located in the granules of cytotoxic T-lymphocytes and natural killer (NK) cells (Fig. 6H).19
DiscussionIn the present study, soluble Galectin-9 and TIM-3 emerge as sensitive prognostic biomarkers for individuals with obstructive sleep apnoea and melanoma or lung cancer. Our findings indicate that elevated plasma concentrations of Galectin-9 and TIM-3 in melanoma patients with moderate-to-severe OSA are associated with increased tumour aggressiveness, while in lung cancer patients, these biomarkers correlate with larger tumour sizes. Notably, the association of moderate-to-severe OSA plasma levels of Galectin-9 and TIM-3 with patient survival was observed in both cancer types after adjusting for tumour stage. These insights highlight the complex interplay between immune response, hypoxemia, and tumour progression in these patients. Importantly, this study underscores that plasma biomarkers associated with OSA may serve as discriminative tools for the medium- to long-term prognosis of patients with two frequently occurring tumours.
While substantial efforts have focused on identifying cancer-specific prognostic biomarkers at diagnosis, many currently available options require multigene panels, biopsies, or extensive clinical examinations, which are costly, invasive, and labour-intensive. In contrast, measuring plasma levels of Galectin-9 and TIM-3 provides a feasible, cost-effective, and easily implementable test in clinical settings.
Impairment of immunosurveillance involves a diverse array of soluble proteins, ligands, receptors, and molecular pathways integrated into an intricate immunosuppressive molecular network, posing a significant challenge to restoring immune function in anti-cancer therapy. A recent review identified the accumulation of 14 immune checkpoints on tumor-infiltrating lymphocytes and tumor cells in lung cancer.20 The expression profile of inhibitory co-receptors on tumor-infiltrating T cells from lung cancer patients reveals a strong correlation between PD-1, TIM-3, CTLA-4, VISTA, LAG-3, and BTLA expression on intratumoral CD8+ T cells.21,22 The co-expression of these inhibitory receptors is associated with progressive T-cell dysfunction, reduced responsiveness to polyclonal activation, and disease progression.23 In this context, recent findings suggest that VISTA interacts intracellularly with Galectin-9, facilitating its release into the extracellular milieu, where it subsequently binds to TIM-3, underscoring the intricate crosstalk within the immunosuppressive molecular network.24 This evidence underscores the potential for developing bispecific and multi-targeted antibodies designed to exploit distinct molecular pathways. Going forward, a deeper understanding of the tumor microenvironment immunosuppressive machinery, along with the identification of refined biomarkers for patient selection, is essential for optimizing these approaches.
sGalectin-9 and sTIM-3 are secreted in small amounts from non-tumor cells via proteolytic cleavage of the membrane receptor by two ADAM metalloproteases.9 In cancer patients, Galectin-9 is abundantly secreted by tumour cells, which is evidenced by high expression levels of Galectin-9 and TIM-3 in common malignancies, such as pancreatic ductal adenocarcinoma or breast cancer.25,26 Studies suggest that Galectin-9 and TIM-3 play a key role in immune evasion, promoting cancer cell progression.9,27 Our findings provide compelling evidence for sGalectin-9 and sTIM-3 as biomarkers of cancer prognosis. Furthermore, our data reveal that both Galectin-9 and TIM-3 levels are elevated in OSA patients – whether or not they have cancer – suggesting that OSA itself contributes to increased biomarker levels, independent of cancer status. Notably, OSA patients experience intermittent hypoxemia, and levels of Galectin-9 and TIM-3 correlated with hypoxemic indicators across all three study cohorts. Consistent with these observations, our intermittent hypoxia model showed significant upregulation of soluble and membrane-bound Galectin-9 and TIM-3.
Previous studies have linked Galectin-9/TIM-3 to pro-tumour activity through the NF-κB/IL-6/STAT3 axis activation, promoting adhesion, migration, tumour growth, invasion, and metastasis.28 In addition, sGalectin-9-dependent TIM-3 activation promotes vascular endothelial growth in breast cancer.29 Moreover, the immunological impact of elevated plasma levels of sGalectin-9 is well characterized, inhibiting T-lymphocyte and NK-cell function by binding to TIM-3.30 However, the functional role of circulating sTIM-3 remains less defined. It has been postulated that it may act as a decoy receptor and as a ‘molecular sink’ for TIM3 ligands, thereby interfering with the inhibitory function of TIM3.9 By contrast, in vitro studies revealed sTim-3 inhibited T-cell function independent of membrane Tim-3, suggesting that sTim-3 could serve as a ligand rather than a membrane Tim-3 blocker.27 In this line, Gen et al. suggest that sTIM-3 inhibits IL-2 secretion, a key cytokine required for cytotoxic lymphocyte activation.31 Moreover, chronic exposure to high levels of sTIM-3 and sGalectin-9 contributes to NK cell dysfunction further compromising immune responses. Additionally, a recent report highlights the significance of sTim-3 in mediating tumor immune escape and resistance to PD-1 blockade.9 Furthermore, Galectin-9 and TIM-3 can have both autocrine and paracrine functions.32 This evidence, along with our data from OSA patients without cancer, suggests that impaired immune responses, potentially exacerbated by OSA, may facilitate tumor progression.
The robust association between elevated soluble Galectin-9 and TIM-3 levels and tumour severity in two distinct cohorts with cancer and OSA underscores the possible influence of OSA-related hypoxemia on tumor severity. This is further supported by the prognostic value of both biomarkers in patients with two different types of cancer and OSA. These observations align with previous findings that hypoxemia contributes to immune deregulation in tumor progression.33 To investigate immune dysfunction associated with hypoxia-induced increases in Galectin-9 and TIM-3 levels, we studied a third cohort comprising OSA patients without cancer. In these subjects, elevated Galectin-9 and TIM-3 levels, induced by intermittent hypoxia, were associated with heightened basal inflammation, increased cytotoxicity, and reduced T-cell proliferation capacity. These findings are congruent with the known effects of hypoxemia on immune function and chronic inflammation,34 which, in turn, can promote tumor aggressiveness in the local tumour microenvironment.35 The interplay between hypoxia and immune checkpoint pathways, particularly TIM-3, has emerged as a focal point in cancer immunotherapy research. Although the inhibitory role of TIM-3 was initially demonstrated in the context of autoimmunity, TIM-3 gained prominence with the discovery that combined blockade of TIM-3 and PD-1 enhance tumor immunity beyond PD-1 pathway blockade alone.30,36–38 This led to the clinical development of TIM-3-targeting agents, with sabatolimab and cobolimab being the most advanced. Sabatolimab, investigated for myelodysplastic syndromes and acute myeloid leukemia, received FDA Fast-Track designation.39 Besides, cobolimab, in combination with anti-PD-1 therapy, showed a 42.9% response rate in lung cancer and is in phase 2 and 3 trials for various malignancies.40 Despite ongoing trials, the mechanisms underlying TIM-3 blockade remain unclear, given its effects on T cells, myeloid cells, and tumor cells. Bi-specific antibodies targeting TIM-3 could refine therapeutic strategies but require a deeper understanding of its in vivo role. Notably, there is a lack of clinical studies directly investigating TIM-3 targeting strategies in cancer patients with concurrent OSA. Further research is needed to elucidate the impact of OSA-induced hypoxia on TIM-3 pathways and to assess the efficacy of TIM-3-targeted therapies in this unique patient population.
We acknowledge certain limitations inherent in this study. First, the findings pertain to two specific tumour types, albeit those most commonly associated with OSA, which limits the generalizability of Galectin-9 and TIM-3 as prognostic biomarkers to other cancers. Second, OSA diagnosis was established through validated respiratory polygraphy, which is a conventional method in clinical practice. However, this diagnostic test fails to adequately assess the contribution of sleep fragmentation to the expression of the Galectin-9/TIM-3 pathway. Thirdly, all patients in the cancer cohorts received treatment according to conventional clinical practice adapted to current international recommendations, without their treating physicians being informed of their sleep study results. Different treatment modalities in patients with advanced cancer can significantly impact both clinical outcomes, including mortality, and the levels of soluble immune checkpoint proteins in the blood. Therefore, further research is essential to validate these biomarkers, particularly in patients with advanced cancer and OSA, incorporating detailed clinical parameters such as LDH levels and the presence of organ metastases. Although sample size and treatment variability limited the ability to adjust analyses by treatment modality, our findings strongly suggest that these biomarkers have prognostic value at the time of diagnosis, before initiation of treatment. Additionally, while patients with moderate-to-severe OSA were treated with CPAP in accordance with current guidelines, the SAIL-SAILS cohort did not include CPAP adherence monitoring, preventing us from assessing its impact on survival outcomes.
In conclusion, this study demonstrates that plasma levels of soluble Galectin-9 and TIM-3 are valuable prognostic markers for survival in patients with melanoma or lung cancer. Plasma levels of these biomarkers are elevated in cancer patients with moderate-to-severe OSA and correlate with the degree of nocturnal hypoxemia. In a cohort of patients with severe OSA but no cancer, we found that expression of these biomarkers is regulated by intermittent hypoxia. These findings suggest a potential role of Galectin-9 and TIM-3 in the pathophysiology linking OSA to cancer aggressiveness via immune suppression. Our study supports the clinical utility of these two easily measurable biomarkers in routine practice as prognostic indicators.
FundingThis study was supported by Instituto de Salud Carlos III (ISCIII), Spain, through the projects PI13/01512, PI16/00201 and PI19/01612, and PI22/01262 to F. García-Río and CP18/00028, PI19/01363 and PI22/01257 to C. Cubillos-Zapata; Consejería de Educación, Comunidad de Madrid, Spain, P2022/BMD-7224 to F. García-Río; and co-funded by the European Union. Ayudas Luis Álvarez 2021. C. López-Fernández was supported by Investigo technician fellowship, Comunidad de Madrid, Spain.
CRediT Authorship Contribution StatementEDG, EA, PPM, FGR and CCZ contributed to study conceptualization and methodology. EDG, EA, PPM, CLF, AGS, MAMG, EM, ICP, FCR, MST, EN, AMC, LHB, EP, JAC, JMM, VCN, JCP, EA, OM, MSG, JDA, IA, FTA, CGR, TPW, GPB, LMS, DG, FGR and CCZ contributed to investigation. EDG, EA, PPM, AGS, FGR and CCZ contributed to formal analysis. EDG, EA CCZ and FGR wrote the original draft of the manuscript. DG and MAMG reviewed and edited the manuscript. EDG, EA, AGS make the figures. FGR and CCZ supervised. FGR and CCZ acquired the founding. All authors had full access to all the data in the study and had final responsibility for the decision to submit for publication.
Declaration of Generative AI and AI-assisted Technologies in the Writing ProcessAuthors declare this manuscript has not been partially or totally produced with the help of any artificial intelligence software or tool.
Conflicts of InterestAuthors declare no conflicts of interest.
English Audio
Spanish Audio


