


To determine if adding performance on the five-repetition sit-to-stand test (5-STS) to chronic obstructive pulmonary disease (COPD) high-risk criteria, proposed by the Spanish COPD guidelines (GesEPOC), affects mortality prognosis.
MethodsObservational study of COPD outpatients involved prospective follow-up for 5 years. Patients were classified based on 5-STS performance and risk criteria proposed by GesEPOC version 2021. Outcome measures were 5-year mortality timing and rate. Kaplan–Meier curves and univariate and multivariate Cox proportional-hazard analyses, analysis of variance, and univariate and multivariate linear and logistic regression models were used.
ResultsOne hundred and thirty-seven patients were included. Mean age was 66±8.3 years, and 87.6% were men. Of them, 115 (83.9%) were classified as high risk, 43 (34.4%) of whom had poor performance on the 5-STS. Overall mortality at 5 years was 27% and was significantly higher in the high-risk (29.6%) compared with the low-risk (13.6%) group. Among high-risk patients, mortality at 5 years was significantly worse with poor 5-STS performance (60.5%) compared with non-poor performance (11.1%). Poor performance on the 5-STS was independently associated with increased 5-year mortality risk (HR 4.70; 95% CI: 1.96–11.27) in a model adjusted for history of heart disease and dyspnea.
ConclusionAmong high-risk COPD patients, those with poor performance on the 5-STS have a significantly higher mortality at 5 years than those with non-poor 5-STS performance.

Chronic obstructive pulmonary disease (COPD) is a common cause of death worldwide, with ongoing increases in morbidity and mortality.1 COPD is a heterogeneous disease in which patients with the same forced expiratory volume in the first second (FEV1) differ considerably in disease characteristics.2,3 As a consequence, in recent years, there has been a tendency to classified patients with similar attributes into clusters called phenotypes that are associated with prognosis and important clinical outcomes.2 The Spanish COPD guidelines (GesEPOC) were first published in 2012 and have since undergone a series of updates, incorporating new evidence on the diagnosis and treatment of COPD.4,5 GesEPOC was the first COPD clinical guideline to propose treatment guided by clinical phenotypes and the determination of risk level after diagnosis.4 Three factors are considered in classifying patients into one of two risk levels (low/high). The percentage of reference FEV1 post-bronchodilator lower than 50%, 2 or higher grade of dyspnea (measured using the modified British Medical Research Council [mMRC] scale), and two or more number of moderate or one single hospitalization in the previous year were considered high-risk criteria. If the patient met any of the later 3 criteria, then was classified as high-risk patient.4–6 After publication of this stratification, various studies have described prognosis with these risk groups and validated the GesEPOC classifications, although more studies are needed to verify these findings.7 Interest is now growing in identifying other risk factors to enhance the average prognosis for these risk groups. Figueira et al.8 have shown that inclusion of other variables, such as peripheral oxygen saturation, in the conventional criteria for high-risk patients yields a more precise mortality risk classification. In addition, Figueira et al.9 also showed correlation between GesEPOC risk factors (dyspnea and severe exacerbations) and the presence of cardiovascular disease.9
A previous study has showed that low physical performance on the five-repetition sit-to-stand test (5-STS) correctly discriminates individual 5-year mortality in patients with COPD.10 However, no studies have examined the joint influence of this performance and the risk stratification proposed by GesEPOC (low/high) on mortality. Therefore, whether adding 5-STS to the GesEPOC high-risk criteria better predicts mortality risk for COPD patients is unclear. We hypothesized that high-risk patients with a poor level of functional physical performance on the 5-STS have a higher risk of mortality in the long term than those with non-poor performance, as this functional capacity test reflects both lower-limb muscle strength and aerobic capacity.11,12 Therefore, our main objective was to determine if adding 5-STS performance to the high-risk criteria proposed for GesEPOC would refine mortality prognosis in outpatients with COPD.
Materials and MethodsParticipants and Study DesignFor this observational prospective study, eligible patients with stable COPD were consecutively recruited from an outpatient pulmonary service. This recruitment and patient cohort have been previously described.12 All study participants provided written informed consent, and the study protocol was approved by the hospital institutional review board. The initial protocol included a follow-up period of 2 years (approval number: EST-35/13), but a subsequent version encompassed 5 years overall (approval number: EST-66/20). Results are reported following “Strengthening the Reporting of Observational Studies in Epidemiology” (STROBE) guidelines.13 Patient data were processed and protected in accordance with current legislation and data protection regulations. Inclusion criteria were a diagnosis of COPD according to the Global Initiative for COPD (GOLD) recommendations (i.e., FEV1/forced vital capacity, post-bronchodilator ratio<70% and tobacco history more than 10 pack-year),14 stable stage (without exacerbations in the previous 3 months), and aged 40–80 years. Exclusion criteria were unstable cardiac condition within 4 months of the start of the study, cognitive deterioration, inability to walk, and frail phenotype.
All patients participated in an annual follow-up program consisting of medical consultations, including updates of their medical treatments, and no participants were involved in rehabilitation programs.
MeasuresPatients participated in the baseline data collection and were followed up for 5 years (2014–2019) to evaluate all-cause mortality. The moderate and severe exacerbations were captured from the patients’ electronic files and checked by physicians to ensure the exact date of exacerbation.
Patients’ CharacteristicsAt baseline, we obtained data regarding sociodemographic, clinical, and pulmonary variables. Briefly, demographic characteristics included age and sex. Clinical and pulmonary measures were smoking status (active/former smoker), body mass index (calculated as mass [kg]/height [m2]), number of comorbidities (measured with a functional comorbidity index),15 history of heart disease (heart failure, ischemic heart disease or atrial fibrillation), history of vascular disease (including stroke or peripheral vascular disease), perceived health status assessed by the COPD Assessment Test (CAT categorized as ≥10 or <10),16 total number of exacerbations in the previous year (moderate, defined as use of corticosteroids and/or antibiotics; severe, defined as requiring hospitalization), grade of dyspnea (measured using mMRC scale),6 and FEV1% reference value (using post-bronchodilator spirometry with a Master Scope Spirometer, version 4.6, Jaeger, Würzburg, Germany) according to American Thoracic Society guidelines.17 FEV1% and dyspnea were dichotomized according to GesEPOC cut-offs: FEV1 post-bronchodilator<50% and mMRC dyspnea scale≥2.5
Finally, patients were classified according to their GOLD stage14 and risk level based on GesEPOC guideline criteria as high risk (FEV1 post-bronchodilator<50% or dyspnea ≥2 or ≥2 moderate outpatient exacerbations or at least 1 exacerbation requiring hospitalization during the previous year) or as low risk (none of these criteria).5
Exposure Variable: Performance in the 5-STSThe functional test was the 5-STS, reported as seconds taken to stand five times from a sitting position as rapidly as possible, according to the National Institute on Aging protocol for the Short Physical Performance Battery.18 Time for the 5-STS was dichotomized according to a cut-off of 16seconds (s), with ≥16s indicating poor performance and <16s indicating non-poor performance. This cut-off was established in a previous study as the best to identify patients with higher mortality risk at 5 years.10 Finally, these two to performance levels were combined with the two risk-groups to generate four subgroups of exposure (i.e., high-risk with poor and non-poor performance, and again with low-risk).
Outcome MeasureThe outcome measures were timing and rate of all-cause mortality at 5 years. Mortality was defined as all-cause mortality because determination of cause of death is prone to misclassification and difficult to perform, even if centrally adjudicated.19 Nevertheless, we could identify cancer-specific mortality. Deaths were annually captured from the patients’ electronic files and checked by doctors to ensure the exact date and cause of death.
Sample SizeSample size was based on providing results with sufficient precision in the adjusted Cox regression model planned in the statistical analysis for patients with high-risk. We anticipated an event rate of 30% in that high-risk group.7 According the rule of thumb of 10 events (deaths) per variable (EPV), a sample size of 100 patients was selected to achieve a sufficient precision using Cox regression analysis with a maximum of 3 variables. According the study of Cabrera et al.7 and our preliminary study,10 we estimated that more than 70% of the sample would be high-risk patients, therefore, we recruited a minimum of 130 patients with low or high risk at the beginning of the study.
Statistical AnalysesBaseline participants’ characteristics across the subgroups based on the exposure variable were summarized and examined. Categorical variables were expressed as counts (%) and continuous variables as mean (±standard deviation) or median (interquartile range [IQR]), as appropriate. One-way analysis of variance with Bonferroni correction was applied for a post hoc pairwise comparison, and chi-squared tests were used to compare characteristics between all those subgroups. In addition, and only for GesEPOC classification, the two high-risk subgroups (poor/non-poor performance) were examined using chi-squared tests. Survival analysis using Kaplan–Meier curves and log-rank tests were used for time-to-event comparisons between high- and low-risk groups, and again between high-risk subgroups with poor versus non-poor 5-STS performance.
To determine the risk of 5-year all-cause mortality in the two high-risk subgroups, unadjusted and adjusted Cox proportional-hazards regression analyses were used, hazard ratios (HRs) and 95% confidence intervals (CIs) were estimated. Only relevant clinical variables with a p value<0.220 in the unadjusted analysis were considered as potential variables to be included in a forward adjusted model. However, only the significant variables (p value<0.05) were retained in the adjusted model.
Finally, we used Kaplan–Meier curves and log-rank tests again to explore a possible interaction between the variables, which yielded significant results in the adjusted model and similar associations for time to death (5-STS and history of heart disease) in patients with high risk. All analyses were performed using the Statistical Package for the Social Sciences version 24.0 (IBM, Chicago, IL, USA).
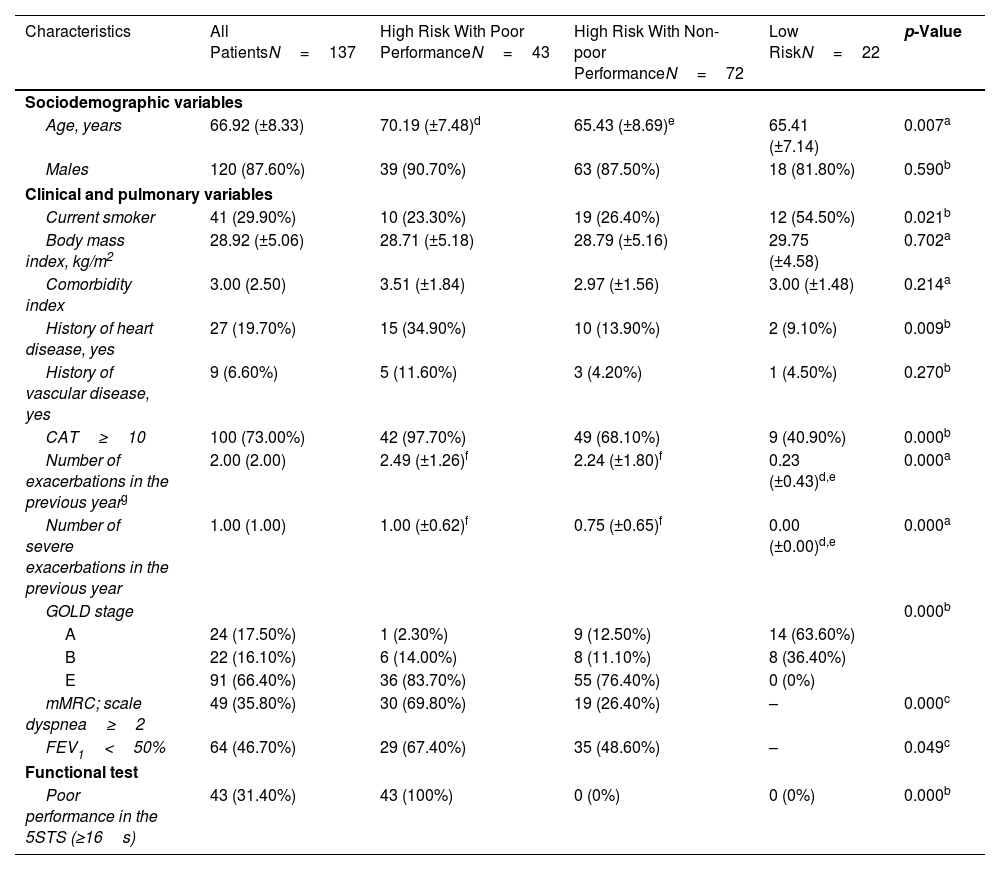
ResultsParticipantsA total of 147 participants were initially enrolled as potentially eligible, but 10 failed to meet our inclusion criteria (5 with unstable cardiac condition, 3 with cognitive deterioration, and 2 unable to walk). Therefore, 137 patients were included at baseline (Fig. 1). The mean age was 66.9±8 years, and most participants were men (87.6%). A total of 115 (83.9%) patients were classified as high risk, and 42.6% of this high-risk group had dyspnea≥2 on the mMRC scale, 46.7% had post-bronchodilator FEV1<50%, and 91.0% were exacerbators in the last year (were classified as E in GOLD stage). In the high-risk group, 43 patients (31.4%) had poor performance on the 5-STS. In the low-risk group, all patients had non-poor performance in the 5-STS. Participant characteristics and comparisons between subgroups are provided in Table 1.

Baseline Characteristics of the 137 Patients With COPD and by Groups of Risk and Performance.
| Characteristics | All PatientsN=137 | High Risk With Poor PerformanceN=43 | High Risk With Non-poor PerformanceN=72 | Low RiskN=22 | p-Value |
|---|---|---|---|---|---|
| Sociodemographic variables | |||||
| Age, years | 66.92 (±8.33) | 70.19 (±7.48)d | 65.43 (±8.69)e | 65.41 (±7.14) | 0.007a |
| Males | 120 (87.60%) | 39 (90.70%) | 63 (87.50%) | 18 (81.80%) | 0.590b |
| Clinical and pulmonary variables | |||||
| Current smoker | 41 (29.90%) | 10 (23.30%) | 19 (26.40%) | 12 (54.50%) | 0.021b |
| Body mass index, kg/m2 | 28.92 (±5.06) | 28.71 (±5.18) | 28.79 (±5.16) | 29.75 (±4.58) | 0.702a |
| Comorbidity index | 3.00 (2.50) | 3.51 (±1.84) | 2.97 (±1.56) | 3.00 (±1.48) | 0.214a |
| History of heart disease, yes | 27 (19.70%) | 15 (34.90%) | 10 (13.90%) | 2 (9.10%) | 0.009b |
| History of vascular disease, yes | 9 (6.60%) | 5 (11.60%) | 3 (4.20%) | 1 (4.50%) | 0.270b |
| CAT≥10 | 100 (73.00%) | 42 (97.70%) | 49 (68.10%) | 9 (40.90%) | 0.000b |
| Number of exacerbations in the previous yearg | 2.00 (2.00) | 2.49 (±1.26)f | 2.24 (±1.80)f | 0.23 (±0.43)d,e | 0.000a |
| Number of severe exacerbations in the previous year | 1.00 (1.00) | 1.00 (±0.62)f | 0.75 (±0.65)f | 0.00 (±0.00)d,e | 0.000a |
| GOLD stage | 0.000b | ||||
| A | 24 (17.50%) | 1 (2.30%) | 9 (12.50%) | 14 (63.60%) | |
| B | 22 (16.10%) | 6 (14.00%) | 8 (11.10%) | 8 (36.40%) | |
| E | 91 (66.40%) | 36 (83.70%) | 55 (76.40%) | 0 (0%) | |
| mMRC; scale dyspnea≥2 | 49 (35.80%) | 30 (69.80%) | 19 (26.40%) | – | 0.000c |
| FEV1<50% | 64 (46.70%) | 29 (67.40%) | 35 (48.60%) | – | 0.049c |
| Functional test | |||||
| Poor performance in the 5STS (≥16s) | 43 (31.40%) | 43 (100%) | 0 (0%) | 0 (0%) | 0.000b |
Note: Data are reported as mean (±standard deviation), median (IQR), or n (%).
The two high-risk subgroups (poor and non-poor 5-STS performance) and the low-risk group were significantly different in age, smoking status, history of heart disease, perceived health status, n° total and n° of severe exacerbations in the previous year, GOLD stage, and 5-STS results. Additionally, the two high-risk subgroups differed on the GesEPOC criteria.
Timing and Mortality Rate Overall and by SubgroupOverall mortality at 5 years was 27% (37 patients of whom a third had cancer-mortality), and mortality was significantly higher in the high-risk compared with the low-risk group (29.6% vs. 13.6%). Based on the Kaplan–Meier plot (Fig. 2a), however, the groups did not differ in time to death (χ2(2)=2.23; log rank, p=0.135). In contrast, the Kaplan–Meier plot comparing the two high-risk subgroups based on poor versus non-poor 5-STS performance (Fig. 2b) shows a clear association of poor performance with time to death (χ2(2)=41.71; log rank, p<0.001). Mortality at 5 years in the high-risk subgroup with poor 5-STS performance was significantly higher than in the high-risk subgroup with non-poor performance (60.5% vs. 11.1%, p<0.001). The median and 25 percentile overall survival of that subgroup with the worst prognosis were 55 and 32 months, respectively.
 and with (b) adding physical performance.")
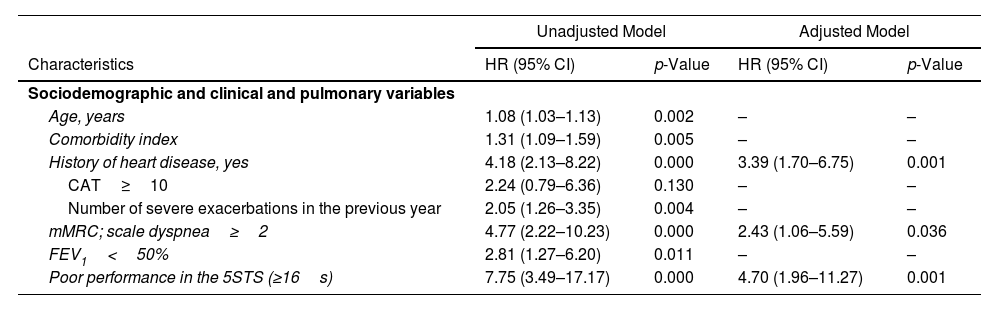
In the adjusted Cox regression analysis (Table 2), poor performance on the 5-STS was independently associated with increased 5-year mortality risk (HR 4.70; 95% CI: 1.96–11.27), even after adjustment for history of heart disease (HR 3.39; 95% CI: 1.70–6.75) and dyspnea (HR 2.43; 95% CI: 1.06–5.59), which also were independent factors associated with time to death. Unadjusted Cox regression analysis (Table 2) revealed that potential prognostic factors for 5-year all-cause mortality included 5-STS performance, age, comorbidity index, history of heart disease, dyspnea, FEV1 and severe exacerbations in the previous year.
Mortality Cox Proportional Hazards Regression Analysis (n=115).
| Unadjusted Model | Adjusted Model | |||
|---|---|---|---|---|
| Characteristics | HR (95% CI) | p-Value | HR (95% CI) | p-Value |
| Sociodemographic and clinical and pulmonary variables | ||||
| Age, years | 1.08 (1.03–1.13) | 0.002 | – | – |
| Comorbidity index | 1.31 (1.09–1.59) | 0.005 | – | – |
| History of heart disease, yes | 4.18 (2.13–8.22) | 0.000 | 3.39 (1.70–6.75) | 0.001 |
| CAT≥10 | 2.24 (0.79–6.36) | 0.130 | – | – |
| Number of severe exacerbations in the previous year | 2.05 (1.26–3.35) | 0.004 | – | – |
| mMRC; scale dyspnea≥2 | 4.77 (2.22–10.23) | 0.000 | 2.43 (1.06–5.59) | 0.036 |
| FEV1<50% | 2.81 (1.27–6.20) | 0.011 | – | – |
| Poor performance in the 5STS (≥16s) | 7.75 (3.49–17.17) | 0.000 | 4.70 (1.96–11.27) | 0.001 |
Abbreviations: HR, hazard ratio; CI, confidence interval; mMRC, modified British Medical Research Council; FEV1, forced expiratory volume in 1s; 5-STS, five-repetition sit-to-stand test; s, seconds.
Unadjusted Model: only significant variables and the exacerbation in the previous year are shown.
Multivariate adjusted model included 5-STS performance, age, comorbidity index, history of heart disease, dyspnea, FEV1 and severe exacerbations in the previous year: only significant variables are showed.
Because both 5-STS and history of heart disease were similarly associated with time to death (HRs 4.70 and 3.39, respectively), we used Kaplan–Meier plots to explore a possible interaction between these two factors in high-risk patients. As the plot shows (Fig. 3a), a history of heart disease affected the impact of poor 5-STS performance on the survival curve (χ2(2)=16.97; log rank, p<0.001) and was associated with higher 5-year mortality (100% vs. 39.3% with no history). In contrast, non-poor 5-STS performance did not differ by history of heart disease (Fig. 3b; χ2(2)=0.03; log rank, p=0.857) as a factor in 5-year mortality (12.9% with vs. 10% without heart disease history).
Discussion and non-poor performance (b) in the 5-STS.")
To our knowledge, this study is the first to compare mortality in patients defined as high risk by GesEPOC criteria according to poor and non-poor functional performance on the 5-STS. Our data confirm the power of 5-STS to identify high-risk COPD patients with an increased mortality risk. Among high-risk patients, those with poor 5-STS performance increase 4.7 five-times the risk of mortality after adjusting for other confunding variables.
The prognostic value of poor functional performance has been widely demonstrated,21–23 but this measure has not previously been applied for understanding variations in prognosis among stratification risk levels based on GesEPOC criteria. One common functional measure is the 6-minute walk test,24,25 but pulmonologists do not typically apply this test in clinic because of time constraints, equipment, and space requirements.12 In addition, previous studies have shown that simple measures of physical function and muscle strength in COPD,26,27 including a poor 5-STS performance, are predictors of re-hospitalization28 and survival in COPD patients.10,29
Two groups have previously compared mortality between high-risk and low-risk COPD patients over the long-term.7,8 In the current work, overall mortality at 5 years in high-risk patients (29.6%) was similar to that described by Cabrera et al.7 and Figueira et al.8 In all three studies, mortality in high-risk patients was significantly higher than in the low-risk group. Of interest, our study could not find significant differences in mortality between the low-risk group and high-risk patients with non-poor 5-STS performance.
Cabrera et al.7 found that FEV1%<50% and dyspnea≥2 were independent predictors of mortality, whereas we identified dyspnea but not FEV1%<50% as an independent predictor, along with history of heart disease and poor 5-STS performance. Our study had a proportion of patients with dyspnea≥2 similar to that of Cabrera et al. (35.8% vs. 38.1%), but the participants with FEV1<50% and exacerbations were very different. Figueira et al.8 reported that a higher degree of dyspnea and more frequent severe exacerbations were associated with a higher co-occurrence of cardiovascular diseases. We found that in the high-risk group with poor 5-STS performance, a history of concomitant heart disease was linked to significantly increased mortality compared with patients without such a history (100% vs. 39.3%). This factor did not appear to increase risk in high-risk patients with non-poor 5-STS performance. A caveat is that we had relatively few patients with a history of heart disease in this subgroup, so that this factor warrants further exploration in this patient subset.
Implications for Practice and ResearchIn recent years, various studies on COPD have focused on describing patients based on different risk populations.2 Recognition of such levels of risk enables clinical screening of a unique population at risk and enables personalization of medical regimens. Here, we have shown that a simpler and faster test like the 5-STS can be used to define possible sub-phenotypes within the subgroup of high-risk patients defined by the GesEPOC criteria.
Our results could allow for refinement of classification criteria for patients who were previously grouped together but may differ in terms of mortality risk. Furthermore, the evidence suggests that poor performance is strongly associated with mortality risk and should be routinely assessed as a method to track the effectiveness of interventions. Evidence of the prognostic value of 5-STS performance also may be used to inform further treatment choices. For example, some interventions (e.g., pulmonary rehabilitation programs) could be added for patients with poor 5-STS performance. We found that patients with poor performance had a worse prognosis, indicating that they also may have greater potential than patients with non-poor 5-STS performance to benefit from interventions. Poor performance is hypothesized to be a modifiable characteristic, and future clinical trials should evaluate whether pulmonary rehabilitation or other interventions that modify poor performance also might modify prognosis.
Further research also should assess whether the combination of high-risk classification with physical performance as measured using the 5-STS could support monitoring of disease progression and prediction of differential responses to interventions.30 In addition, studies are needed to replicate and confirm the current findings.
Strengths and LimitationsThis study has two main strengths. First, we explored the prognostic value of physical performance in high-risk patients classified using the GesEPOC criteria, which to our knowledge has not been previously described. Second, we included an exhaustive selection of variables in adjusted analyses to ensure comprehensive control of potential confounding.
This study also has limitations. First, the absence of low-risk patients with poor 5-STS performance prevented comparison of their prognosis with that of high-risk patients with poor performance. Second, despite our inclusion of a wide number of factors to control for confounding, some important factors may have been omitted (e.g., physical activity). Finally, our study was single center and included only a small number of women, so that generalizations should be made with caution.
ConclusionsIn this study, high-risk COPD patients with poor performance on the 5-STS have significantly higher mortality at 5 years than high-risk patients with non-poor 5-STS performance. It remains to be verified whether a classification that takes into account different cut-offs for the 5-STS in high-risk patients could support identification of patients with different mortality risks.
Ethics Statements and Consent StatementAll study participants provided written informed consent, and the study protocol was approved by the hospital institutional review board (approval number: EST-35/13-66/20).
Funding StatementThe study was supported by FAES FARMA, S.A. The sponsors had no role in the study design, the data collection and analysis, or the manuscript preparation.
Conflict of InterestsThe authors state that they have no conflict of interests.
The authors wish to thank their patients and the personnel of the hospital unit for their cooperation during this study.
The followings are the supplementary data to this article:
Takehome: Among high-risk patients, those with poor 5-STS performance increase 4.7 five-times the risk of mortality after adjusting for other confunding variables.


