

Cystic fibrosis causes exercise limitation due to impaired lung function and other complications, which in turn increases the chance of mortality. CFTR modulators, particularly the elexacaftor/tezacaftor/ivacaftor (ETI) combination, improve lung function in children older than 6 years in real-life studies.
ObjectiveThis study aimed to assess the impact of ETI on aerobic capacity in children with CF aged 6–11 years under real-life conditions and to evaluate whether prior CFTR modulator treatment affects these outcomes.
MethodsA multicenter, prospective cohort study was conducted with pediatric CF patients. Participants underwent evaluations 6–8 months before ETI (T1), at the start of ETI (T2), and 6–8 months post-treatment (T3). Primary outcomes included cardiorespiratory fitness assessed via peak oxygen consumption (VO2peak) during a cardiopulmonary exercise test (CPET), and secondary outcomes encompassed lung function, quality of life, physical activity, and functional mobility.
ResultsOf the 28 patients (mean age 9.02±1.59 years), 19 were ETI-naive, and 9 had prior CFTR modulator treatment. Significant improvements were observed in FEV1 (p<0.001), and several functional mobility tests (30CST, Stair Climb Test, 10MWT). However, VO2peak showed no significant changes between T1 and T3. Quality of life scores improved notably in emotional, eating, and respiratory domains, and a slight improvement was noted in physical activity levels (p=0.037).
ConclusionsETI treatment significantly enhances lung function and certain aspects of quality of life and physical fitness in pediatric CF patients. However, it does not significantly alter aerobic capacity (VO2peak) within the observed period.

Cystic fibrosis (CF) is an autosomal recessive disease most found in Caucasian populations.1 The most prevalent mutation is F508del, of which 88% of patients have at least one copy.2 F508del is classified as a class II mutation, which are characterized by a misfolding of the CFTR protein making it unable to reach the cell surface.3 During the last decade, research has been focusing on the underlying dysfunction of the CFTR gene using new drugs, so called CFTR modulators. The highly effective modulator combination elexacaftor/tezacaftor/ivacaftor (ETI) was approved in Spain for people with CF (pwCF)>12 years in 2020, and the age of use was reduced to over 6 years old from September 2022.4
The meta-analysis done by Kapuni et al. highlights a substantial increase in forced expiratory volume (FEV1) in both children and adults in multiple studies.3 It was also found to increase quality of life of patients, reduce pulmonary exacerbations and increase weight gain.3 Although FEV1 has been considered as the best predictor of mortality in both CF children and adults, it should not be forgotten that CF is a multisystemic disease affecting other systems such as the cardiovascular system as well as the peripheral muscles.5,6 Adding a test for aerobic fitness would enable to have a complete picture for the prognosis. Peak oxygen consumption (VO2 peak), which is measured during a cardiopulmonary exercise test (CPET), is the main parameter in the evaluation of aerobic capacity and has been found to be a good predictor of survival in pwCF.7,8 Patients with lower VO2 peak rates showed a 4.9-fold increased risk for a fatal outcome.8
As of today, only a few studies have measured aerobic fitness with CPET in patients under ETI treatment, showing a clinical improvement9,10 or no effect.11
Data on treatment response on exercise capacity after initiation of ETI is still quite scarce. Therefore, the general objective of this study was to assess the evolution of aerobic capacity of children before and during treatment with ETI in real-life conditions. A second objective was to assess if those same variables would be affected by a previous CFTR modulator treatment.
Our hypothesis was that ETI would not improve aerobic capacity in patients with CF although an increase could be observed in the pulmonary function. Also, that the difference of the variables over time would be lower in patients which already received a CFTR treatment previously.
MethodsStudy DesignThe present study was a multicenter, prospective cohort study. The study protocol adhered to the “Ethics guidelines of the Declaration of Helsinki”, the last modification made in 2019, and was approved by the Ethics Committee of the Niño Jesús University Children's Hospital (CI: R-0086/19). The effects of the administration of ETI on quality of life and physical fitness were measured 6–8 months (T1) before its onset, at the time of onset (T2) and 6–8 months after its onset (T3). For the second objective of this study, the cohort was separated into two groups, a “modulator-naive” group in which ETI is their first treatment and another group, in which patients switched treatment.
ParticipantsThe study was carried out in patients diagnosed with CF under follow-up in the 3 CF units of Madrid (Spain). Inclusion criteria included: sweat chloride≥60mEq/L and/or two variants of the CFTR gene characterized as pathogenic; aged between 6 and 11 years old; eligible to receive treatment with CFTR protein modulating drugs. Some of the secondary measures were lost to follow-up due to de difficulty of ensuring that the children of that age stayed in the hospital accompanied by their parents long enough to obtain all the measures. The tables show the number of children in whom each measure was obtained.
Primary OutcomesCardiorespiratory FitnessCardiorespiratory fitness was assessed by a maximum test on a treadmill (Technogym Run Race 1400HC; Gambettola, Italy). The ramp protocol was adapted to the pediatric and CF population. Breath-by-breath gas exchange data were collected through open-circuit spirometry (Ergostik-Cardiopart GERATHERM-AMEDTEC®), utilizing specialized pediatric face masks, in conjunction with electrocardiogram recording. The test aimed to assess both VO2peak and ventilatory threshold 1 (VT1) in reaction to maximal effort. The highest recorded VO2peak was observed during any continuous 20-s interval as previously described.13 The VT1 was determined by the changes in the ventilatory equivalents for VO2 and VCO2 and changes in end-tidal oxygen, and carbon dioxide pressures.12 The test was considered as maximum if the following criteria were met: (i) 90% of predicted heart rate; and (ii) respiratory exchange ratio (RER)>1.05.13
Secondary OutcomesLung FunctionSpirometry was conducted using a Master Screen spirometer (Jaeger, Germany) in accordance with the guidelines of the American Thoracic Society and European Respiratory Society (ATS/ERS).14 The data were presented in both absolute values and z-scores, utilizing the Global Lung Initiative (GLI) reference equations.15
Quality of Life and LifestyleRevised Cystic Fibrosis Quality of Life Questionnaire (CFQ-R) was used to assess the health-related quality of life in pwCF, covering physical, emotional, and social domains. Physical activity level (PA) was measured using the PAQ-C (Physical Activity Questionnaire for Children). In order to avoid bias, all patients are moderately active. The KIDMED questionnaire was used to assess adherence to the Mediterranean diet.
Functional TestsThe Timed Up and Go (TUG) test of 10m and the Timed Up and Down Stairs (TUDS) tests were used to measure children's functional mobility. The TUG test is described as the time needed to stand up from a seated position in a chair, walk 10m, turn around, return to the chair and sit down.16 The TUDS test is described as the time to ascend and descend 12 stairs.17 Finally, the 30-Second Chair Stand test (30CST) was also performed to evaluate lower body strength.18
AnthropometryAnthropometric data and body composition height and weight were measured using a mechanical balance (ASIMED model BARYS PLUS C®) equipped with a telescopic height measuring meter to calculate body mass index (BMI). The cut-offs used to describe nutritional status were those proposed according to the World Health Organization. The participants’ body composition (body fat and lean mass) was assessed using the bifrequency mode (at 5/50kHz) bioimpedance analysis method (BodyStat 1500MDD®). Body fat mass index and fat-free mass index were calculated and expressed as percent (%) values.
Statistical AnalysisAll statistical analysis was performed using IBM SPSS Statistics 28.0 for MAC version (28.0.1.114). The normal distribution of the variables was verified with the Shapiro–Wilk and Levene tests and with P–P and Q–Q graphs. The mean and standard deviation were used to describe parametric variables, the median and interquartile range (IQR) for non-parametric variables. The repeated measures ANOVA test was used for the analysis of the effect of time (T1, T2 and T3). The level of statistical significance was set at p<0.05.
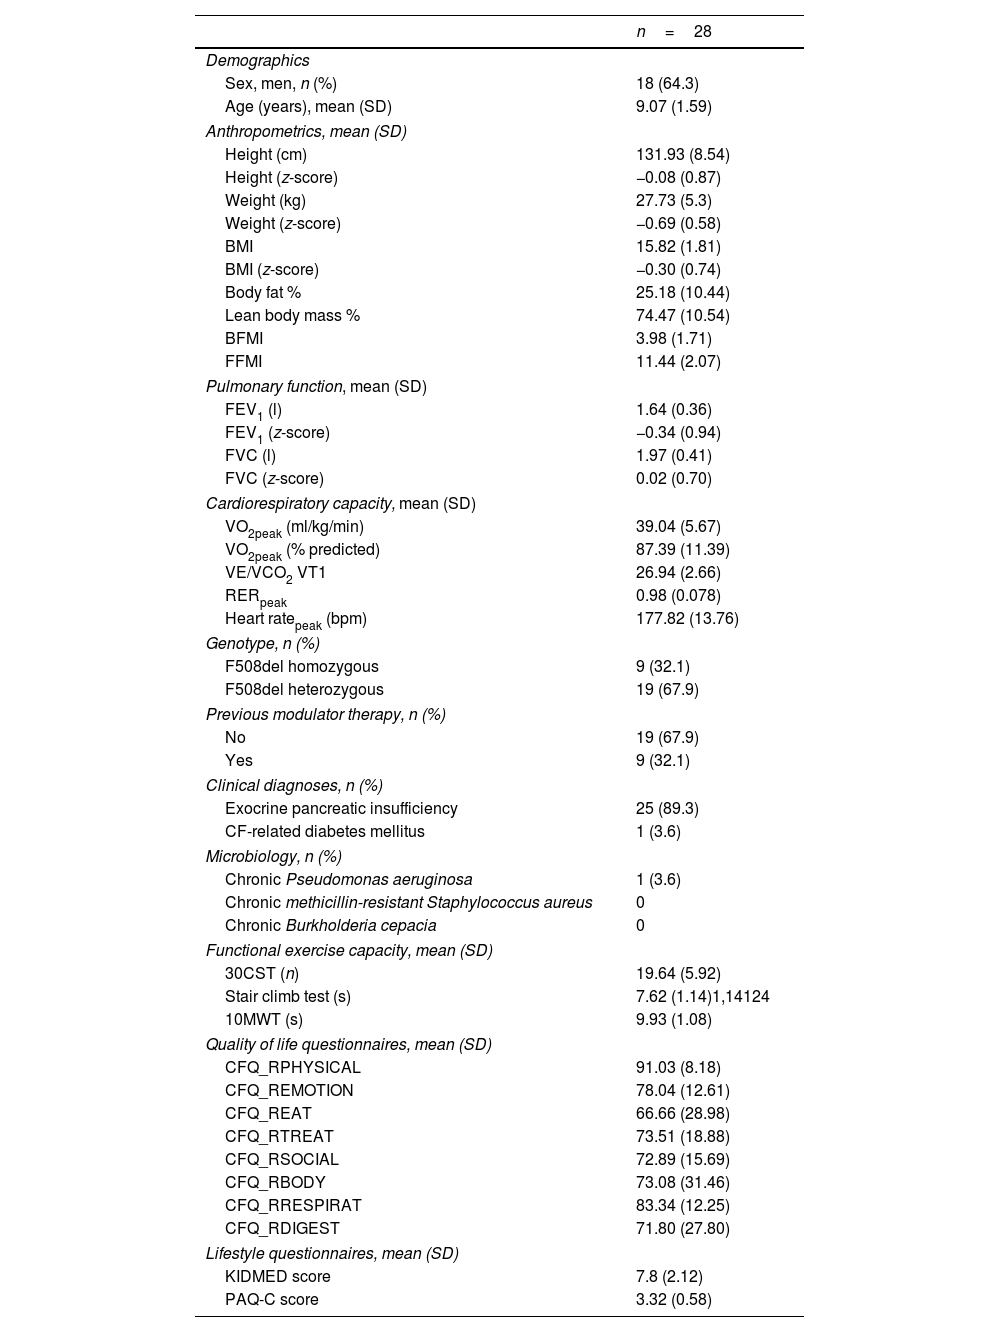
ResultsParticipants and Baseline CharacteristicsOf the 33 patients aged 6–11 years with CF on ETI treatment, 28 were included in the study (Fig. 1) and completed all tests at baseline (mean±SD age: 9.02±1.59 years). Baseline characteristics for the study population are presented in Table 1. Of the 28 children included in the study, some of the secondary measures were lost to follow-up. Tables 2–4 show the number of children in whom each measure was obtained.

Baseline Characteristics (T1) of the Study Participants.
| n=28 | |
|---|---|
| Demographics | |
| Sex, men, n (%) | 18 (64.3) |
| Age (years), mean (SD) | 9.07 (1.59) |
| Anthropometrics, mean (SD) | |
| Height (cm) | 131.93 (8.54) |
| Height (z-score) | −0.08 (0.87) |
| Weight (kg) | 27.73 (5.3) |
| Weight (z-score) | −0.69 (0.58) |
| BMI | 15.82 (1.81) |
| BMI (z-score) | −0.30 (0.74) |
| Body fat % | 25.18 (10.44) |
| Lean body mass % | 74.47 (10.54) |
| BFMI | 3.98 (1.71) |
| FFMI | 11.44 (2.07) |
| Pulmonary function, mean (SD) | |
| FEV1 (l) | 1.64 (0.36) |
| FEV1 (z-score) | −0.34 (0.94) |
| FVC (l) | 1.97 (0.41) |
| FVC (z-score) | 0.02 (0.70) |
| Cardiorespiratory capacity, mean (SD) | |
| VO2peak (ml/kg/min) | 39.04 (5.67) |
| VO2peak (% predicted) | 87.39 (11.39) |
| VE/VCO2 VT1 | 26.94 (2.66) |
| RERpeak | 0.98 (0.078) |
| Heart ratepeak (bpm) | 177.82 (13.76) |
| Genotype, n (%) | |
| F508del homozygous | 9 (32.1) |
| F508del heterozygous | 19 (67.9) |
| Previous modulator therapy, n (%) | |
| No | 19 (67.9) |
| Yes | 9 (32.1) |
| Clinical diagnoses, n (%) | |
| Exocrine pancreatic insufficiency | 25 (89.3) |
| CF-related diabetes mellitus | 1 (3.6) |
| Microbiology, n (%) | |
| Chronic Pseudomonas aeruginosa | 1 (3.6) |
| Chronic methicillin-resistant Staphylococcus aureus | 0 |
| Chronic Burkholderia cepacia | 0 |
| Functional exercise capacity, mean (SD) | |
| 30CST (n) | 19.64 (5.92) |
| Stair climb test (s) | 7.62 (1.14)1,14124 |
| 10MWT (s) | 9.93 (1.08) |
| Quality of life questionnaires, mean (SD) | |
| CFQ_RPHYSICAL | 91.03 (8.18) |
| CFQ_REMOTION | 78.04 (12.61) |
| CFQ_REAT | 66.66 (28.98) |
| CFQ_RTREAT | 73.51 (18.88) |
| CFQ_RSOCIAL | 72.89 (15.69) |
| CFQ_RBODY | 73.08 (31.46) |
| CFQ_RRESPIRAT | 83.34 (12.25) |
| CFQ_RDIGEST | 71.80 (27.80) |
| Lifestyle questionnaires, mean (SD) | |
| KIDMED score | 7.8 (2.12) |
| PAQ-C score | 3.32 (0.58) |
BMI: body mass index; BFMI: body fat mass index; FFMI: fat-free mass index; FEV1: forced expiratory volume in 1s; FVC: forced vital capacity; VO2peak: peak oxygen uptake; VE: ventilation; VCO2: carbon dioxide volume; VT1: Ventilatory threshold 1; RER: respiratory exchange ratio; 30CST: 30 Second Chair Stand Test; 10MWT: 10meter walk test; PAQ-C: Physical Activity Questionnaire for Children; kg: kilograms; m: meters; cm: centimeters; g: grams; ml: milliliters l: liters; SD: standard deviation; Data are presented as mean (SD) or n (%).
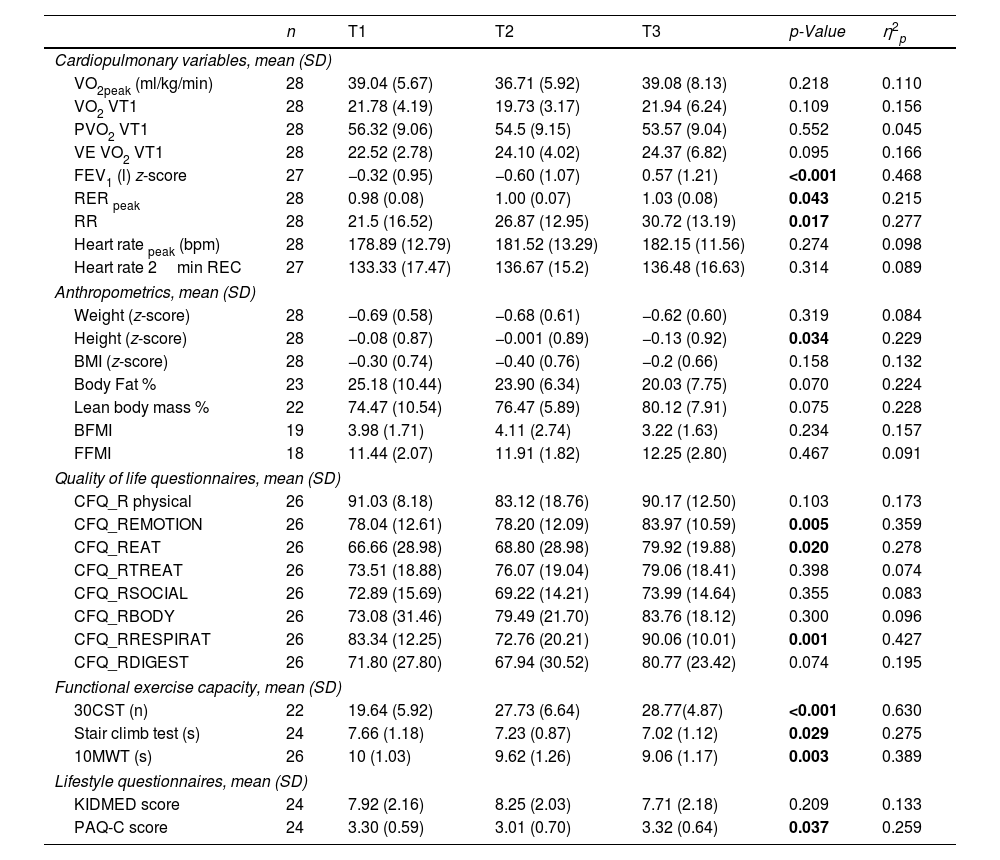
Changes From Baseline to Follow-Up Including Primary and Secondary Outcomes.
| n | T1 | T2 | T3 | p-Value | η2p | |
|---|---|---|---|---|---|---|
| Cardiopulmonary variables, mean (SD) | ||||||
| VO2peak (ml/kg/min) | 28 | 39.04 (5.67) | 36.71 (5.92) | 39.08 (8.13) | 0.218 | 0.110 |
| VO2 VT1 | 28 | 21.78 (4.19) | 19.73 (3.17) | 21.94 (6.24) | 0.109 | 0.156 |
| PVO2 VT1 | 28 | 56.32 (9.06) | 54.5 (9.15) | 53.57 (9.04) | 0.552 | 0.045 |
| VE VO2 VT1 | 28 | 22.52 (2.78) | 24.10 (4.02) | 24.37 (6.82) | 0.095 | 0.166 |
| FEV1 (l) z-score | 27 | −0.32 (0.95) | −0.60 (1.07) | 0.57 (1.21) | <0.001 | 0.468 |
| RER peak | 28 | 0.98 (0.08) | 1.00 (0.07) | 1.03 (0.08) | 0.043 | 0.215 |
| RR | 28 | 21.5 (16.52) | 26.87 (12.95) | 30.72 (13.19) | 0.017 | 0.277 |
| Heart rate peak (bpm) | 28 | 178.89 (12.79) | 181.52 (13.29) | 182.15 (11.56) | 0.274 | 0.098 |
| Heart rate 2min REC | 27 | 133.33 (17.47) | 136.67 (15.2) | 136.48 (16.63) | 0.314 | 0.089 |
| Anthropometrics, mean (SD) | ||||||
| Weight (z-score) | 28 | −0.69 (0.58) | −0.68 (0.61) | −0.62 (0.60) | 0.319 | 0.084 |
| Height (z-score) | 28 | −0.08 (0.87) | −0.001 (0.89) | −0.13 (0.92) | 0.034 | 0.229 |
| BMI (z-score) | 28 | −0.30 (0.74) | −0.40 (0.76) | −0.2 (0.66) | 0.158 | 0.132 |
| Body Fat % | 23 | 25.18 (10.44) | 23.90 (6.34) | 20.03 (7.75) | 0.070 | 0.224 |
| Lean body mass % | 22 | 74.47 (10.54) | 76.47 (5.89) | 80.12 (7.91) | 0.075 | 0.228 |
| BFMI | 19 | 3.98 (1.71) | 4.11 (2.74) | 3.22 (1.63) | 0.234 | 0.157 |
| FFMI | 18 | 11.44 (2.07) | 11.91 (1.82) | 12.25 (2.80) | 0.467 | 0.091 |
| Quality of life questionnaires, mean (SD) | ||||||
| CFQ_R physical | 26 | 91.03 (8.18) | 83.12 (18.76) | 90.17 (12.50) | 0.103 | 0.173 |
| CFQ_REMOTION | 26 | 78.04 (12.61) | 78.20 (12.09) | 83.97 (10.59) | 0.005 | 0.359 |
| CFQ_REAT | 26 | 66.66 (28.98) | 68.80 (28.98) | 79.92 (19.88) | 0.020 | 0.278 |
| CFQ_RTREAT | 26 | 73.51 (18.88) | 76.07 (19.04) | 79.06 (18.41) | 0.398 | 0.074 |
| CFQ_RSOCIAL | 26 | 72.89 (15.69) | 69.22 (14.21) | 73.99 (14.64) | 0.355 | 0.083 |
| CFQ_RBODY | 26 | 73.08 (31.46) | 79.49 (21.70) | 83.76 (18.12) | 0.300 | 0.096 |
| CFQ_RRESPIRAT | 26 | 83.34 (12.25) | 72.76 (20.21) | 90.06 (10.01) | 0.001 | 0.427 |
| CFQ_RDIGEST | 26 | 71.80 (27.80) | 67.94 (30.52) | 80.77 (23.42) | 0.074 | 0.195 |
| Functional exercise capacity, mean (SD) | ||||||
| 30CST (n) | 22 | 19.64 (5.92) | 27.73 (6.64) | 28.77(4.87) | <0.001 | 0.630 |
| Stair climb test (s) | 24 | 7.66 (1.18) | 7.23 (0.87) | 7.02 (1.12) | 0.029 | 0.275 |
| 10MWT (s) | 26 | 10 (1.03) | 9.62 (1.26) | 9.06 (1.17) | 0.003 | 0.389 |
| Lifestyle questionnaires, mean (SD) | ||||||
| KIDMED score | 24 | 7.92 (2.16) | 8.25 (2.03) | 7.71 (2.18) | 0.209 | 0.133 |
| PAQ-C score | 24 | 3.30 (0.59) | 3.01 (0.70) | 3.32 (0.64) | 0.037 | 0.259 |
VO2peak: peak oxygen uptake; VO2 UV1: ventilatory threshold 1 oxygen uptake; PVO2 UV1: % ventilatory threshold 1 oxygen uptake; VE: ventilation; FEV1: forced expiratory volume in 1second; RER peak: respiratory exchange ratio; RR: respiratory reserve; BFMI: body fat mass index; FFMI: fat-free mass index; 30CST: 30Second Chair Stand Test; 10MWT: 10meter walk test; ml: milliliters; SD: standard deviation. Differences were assessed through one-way repeated measures ANOVA. η2p: partial eta-squared effect size. Significance was set at p<0.05.
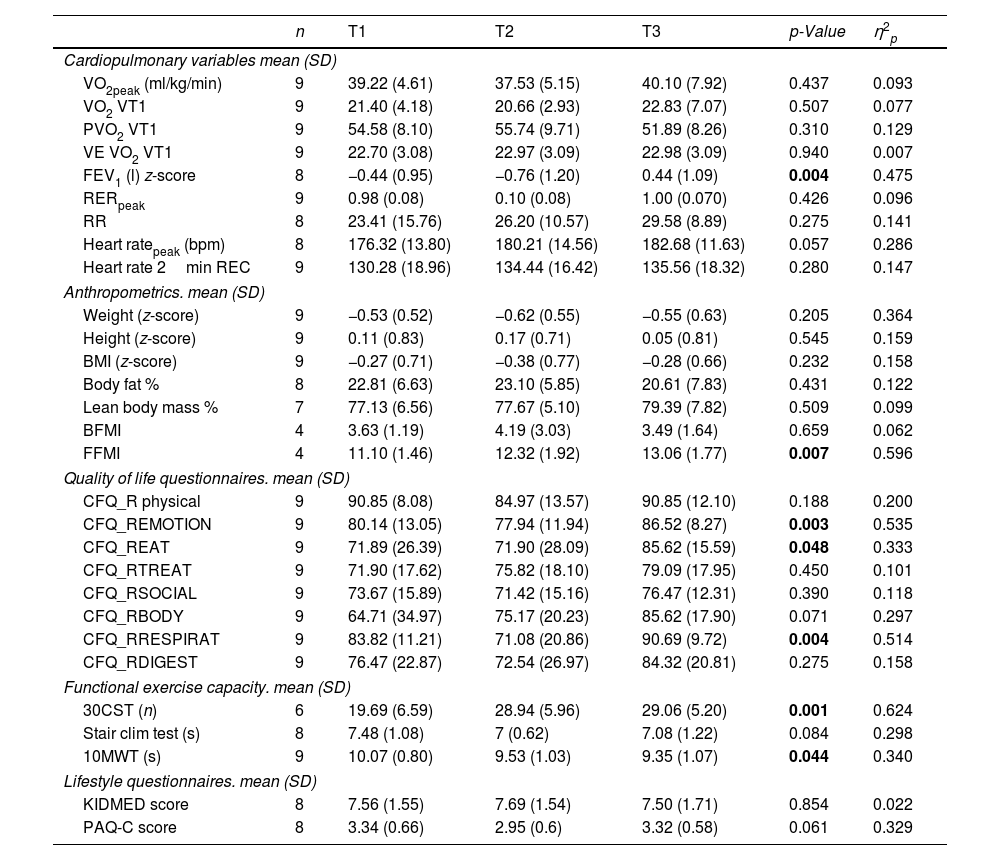
Changes From Baseline to Follow-Up Including Primary and Secondary Outcomes in Patients With Previous CFTR Treatment.
| n | T1 | T2 | T3 | p-Value | η2p | |
|---|---|---|---|---|---|---|
| Cardiopulmonary variables mean (SD) | ||||||
| VO2peak (ml/kg/min) | 9 | 39.22 (4.61) | 37.53 (5.15) | 40.10 (7.92) | 0.437 | 0.093 |
| VO2 VT1 | 9 | 21.40 (4.18) | 20.66 (2.93) | 22.83 (7.07) | 0.507 | 0.077 |
| PVO2 VT1 | 9 | 54.58 (8.10) | 55.74 (9.71) | 51.89 (8.26) | 0.310 | 0.129 |
| VE VO2 VT1 | 9 | 22.70 (3.08) | 22.97 (3.09) | 22.98 (3.09) | 0.940 | 0.007 |
| FEV1 (l) z-score | 8 | −0.44 (0.95) | −0.76 (1.20) | 0.44 (1.09) | 0.004 | 0.475 |
| RERpeak | 9 | 0.98 (0.08) | 0.10 (0.08) | 1.00 (0.070) | 0.426 | 0.096 |
| RR | 8 | 23.41 (15.76) | 26.20 (10.57) | 29.58 (8.89) | 0.275 | 0.141 |
| Heart ratepeak (bpm) | 8 | 176.32 (13.80) | 180.21 (14.56) | 182.68 (11.63) | 0.057 | 0.286 |
| Heart rate 2min REC | 9 | 130.28 (18.96) | 134.44 (16.42) | 135.56 (18.32) | 0.280 | 0.147 |
| Anthropometrics. mean (SD) | ||||||
| Weight (z-score) | 9 | −0.53 (0.52) | −0.62 (0.55) | −0.55 (0.63) | 0.205 | 0.364 |
| Height (z-score) | 9 | 0.11 (0.83) | 0.17 (0.71) | 0.05 (0.81) | 0.545 | 0.159 |
| BMI (z-score) | 9 | −0.27 (0.71) | −0.38 (0.77) | −0.28 (0.66) | 0.232 | 0.158 |
| Body fat % | 8 | 22.81 (6.63) | 23.10 (5.85) | 20.61 (7.83) | 0.431 | 0.122 |
| Lean body mass % | 7 | 77.13 (6.56) | 77.67 (5.10) | 79.39 (7.82) | 0.509 | 0.099 |
| BFMI | 4 | 3.63 (1.19) | 4.19 (3.03) | 3.49 (1.64) | 0.659 | 0.062 |
| FFMI | 4 | 11.10 (1.46) | 12.32 (1.92) | 13.06 (1.77) | 0.007 | 0.596 |
| Quality of life questionnaires. mean (SD) | ||||||
| CFQ_R physical | 9 | 90.85 (8.08) | 84.97 (13.57) | 90.85 (12.10) | 0.188 | 0.200 |
| CFQ_REMOTION | 9 | 80.14 (13.05) | 77.94 (11.94) | 86.52 (8.27) | 0.003 | 0.535 |
| CFQ_REAT | 9 | 71.89 (26.39) | 71.90 (28.09) | 85.62 (15.59) | 0.048 | 0.333 |
| CFQ_RTREAT | 9 | 71.90 (17.62) | 75.82 (18.10) | 79.09 (17.95) | 0.450 | 0.101 |
| CFQ_RSOCIAL | 9 | 73.67 (15.89) | 71.42 (15.16) | 76.47 (12.31) | 0.390 | 0.118 |
| CFQ_RBODY | 9 | 64.71 (34.97) | 75.17 (20.23) | 85.62 (17.90) | 0.071 | 0.297 |
| CFQ_RRESPIRAT | 9 | 83.82 (11.21) | 71.08 (20.86) | 90.69 (9.72) | 0.004 | 0.514 |
| CFQ_RDIGEST | 9 | 76.47 (22.87) | 72.54 (26.97) | 84.32 (20.81) | 0.275 | 0.158 |
| Functional exercise capacity. mean (SD) | ||||||
| 30CST (n) | 6 | 19.69 (6.59) | 28.94 (5.96) | 29.06 (5.20) | 0.001 | 0.624 |
| Stair clim test (s) | 8 | 7.48 (1.08) | 7 (0.62) | 7.08 (1.22) | 0.084 | 0.298 |
| 10MWT (s) | 9 | 10.07 (0.80) | 9.53 (1.03) | 9.35 (1.07) | 0.044 | 0.340 |
| Lifestyle questionnaires. mean (SD) | ||||||
| KIDMED score | 8 | 7.56 (1.55) | 7.69 (1.54) | 7.50 (1.71) | 0.854 | 0.022 |
| PAQ-C score | 8 | 3.34 (0.66) | 2.95 (0.6) | 3.32 (0.58) | 0.061 | 0.329 |
VO2peak: peak oxygen uptake; VO2 UV1: ventilatory threshold 1 oxygen uptake; PVO2 UV1: % ventilatory threshold 1 oxygen uptake; VE: ventilation FEV1: forced expiratory volume in 1 second; RER peak: respiratory exchange ratio; RR: respiratory reserve; BFMI: body fat mass index; FFMI: fat-free mass index; 30CST: 30Second Chair Stand Test; ml: milliliters; SD: standard deviation. Differences were assessed through one-way repeated measures ANOVA. η2p: partial eta-squared effect size. Significance was set at p<0.05.
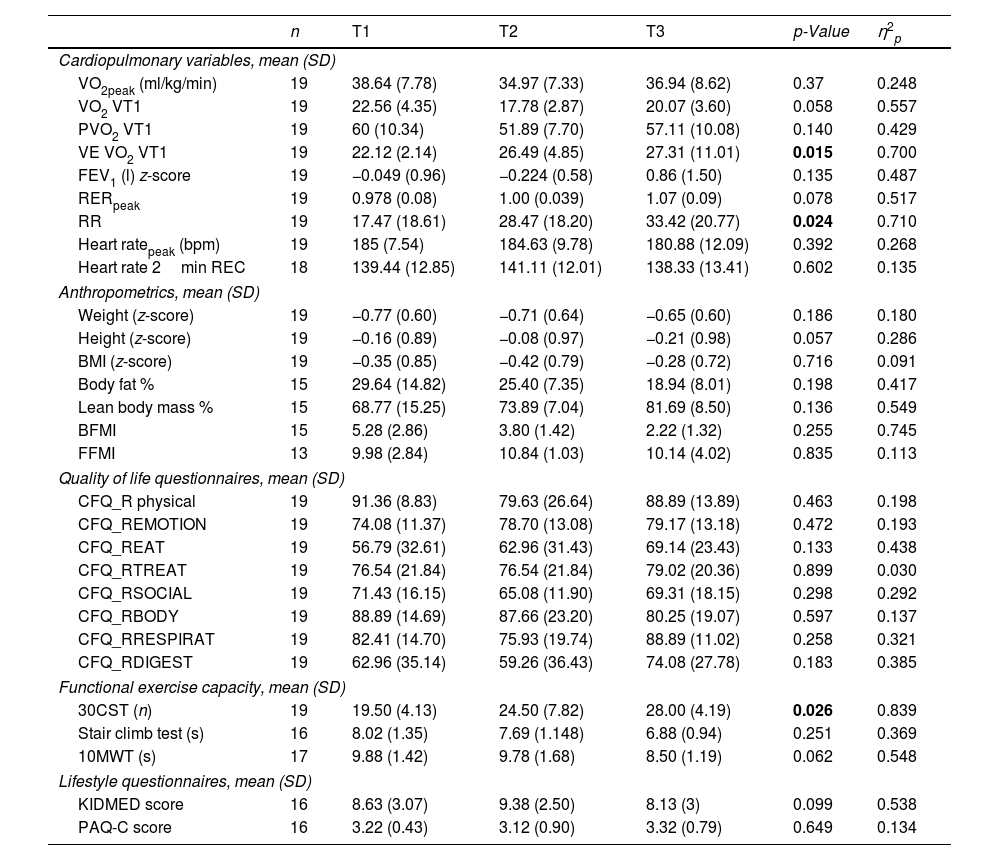
Changes From Baseline to Follow-Up Including Primary and Secondary Outcomes in Patients With No Previous CFTR Treatment.
| n | T1 | T2 | T3 | p-Value | η2p | |
|---|---|---|---|---|---|---|
| Cardiopulmonary variables, mean (SD) | ||||||
| VO2peak (ml/kg/min) | 19 | 38.64 (7.78) | 34.97 (7.33) | 36.94 (8.62) | 0.37 | 0.248 |
| VO2 VT1 | 19 | 22.56 (4.35) | 17.78 (2.87) | 20.07 (3.60) | 0.058 | 0.557 |
| PVO2 VT1 | 19 | 60 (10.34) | 51.89 (7.70) | 57.11 (10.08) | 0.140 | 0.429 |
| VE VO2 VT1 | 19 | 22.12 (2.14) | 26.49 (4.85) | 27.31 (11.01) | 0.015 | 0.700 |
| FEV1 (l) z-score | 19 | −0.049 (0.96) | −0.224 (0.58) | 0.86 (1.50) | 0.135 | 0.487 |
| RERpeak | 19 | 0.978 (0.08) | 1.00 (0.039) | 1.07 (0.09) | 0.078 | 0.517 |
| RR | 19 | 17.47 (18.61) | 28.47 (18.20) | 33.42 (20.77) | 0.024 | 0.710 |
| Heart ratepeak (bpm) | 19 | 185 (7.54) | 184.63 (9.78) | 180.88 (12.09) | 0.392 | 0.268 |
| Heart rate 2min REC | 18 | 139.44 (12.85) | 141.11 (12.01) | 138.33 (13.41) | 0.602 | 0.135 |
| Anthropometrics, mean (SD) | ||||||
| Weight (z-score) | 19 | −0.77 (0.60) | −0.71 (0.64) | −0.65 (0.60) | 0.186 | 0.180 |
| Height (z-score) | 19 | −0.16 (0.89) | −0.08 (0.97) | −0.21 (0.98) | 0.057 | 0.286 |
| BMI (z-score) | 19 | −0.35 (0.85) | −0.42 (0.79) | −0.28 (0.72) | 0.716 | 0.091 |
| Body fat % | 15 | 29.64 (14.82) | 25.40 (7.35) | 18.94 (8.01) | 0.198 | 0.417 |
| Lean body mass % | 15 | 68.77 (15.25) | 73.89 (7.04) | 81.69 (8.50) | 0.136 | 0.549 |
| BFMI | 15 | 5.28 (2.86) | 3.80 (1.42) | 2.22 (1.32) | 0.255 | 0.745 |
| FFMI | 13 | 9.98 (2.84) | 10.84 (1.03) | 10.14 (4.02) | 0.835 | 0.113 |
| Quality of life questionnaires, mean (SD) | ||||||
| CFQ_R physical | 19 | 91.36 (8.83) | 79.63 (26.64) | 88.89 (13.89) | 0.463 | 0.198 |
| CFQ_REMOTION | 19 | 74.08 (11.37) | 78.70 (13.08) | 79.17 (13.18) | 0.472 | 0.193 |
| CFQ_REAT | 19 | 56.79 (32.61) | 62.96 (31.43) | 69.14 (23.43) | 0.133 | 0.438 |
| CFQ_RTREAT | 19 | 76.54 (21.84) | 76.54 (21.84) | 79.02 (20.36) | 0.899 | 0.030 |
| CFQ_RSOCIAL | 19 | 71.43 (16.15) | 65.08 (11.90) | 69.31 (18.15) | 0.298 | 0.292 |
| CFQ_RBODY | 19 | 88.89 (14.69) | 87.66 (23.20) | 80.25 (19.07) | 0.597 | 0.137 |
| CFQ_RRESPIRAT | 19 | 82.41 (14.70) | 75.93 (19.74) | 88.89 (11.02) | 0.258 | 0.321 |
| CFQ_RDIGEST | 19 | 62.96 (35.14) | 59.26 (36.43) | 74.08 (27.78) | 0.183 | 0.385 |
| Functional exercise capacity, mean (SD) | ||||||
| 30CST (n) | 19 | 19.50 (4.13) | 24.50 (7.82) | 28.00 (4.19) | 0.026 | 0.839 |
| Stair climb test (s) | 16 | 8.02 (1.35) | 7.69 (1.148) | 6.88 (0.94) | 0.251 | 0.369 |
| 10MWT (s) | 17 | 9.88 (1.42) | 9.78 (1.68) | 8.50 (1.19) | 0.062 | 0.548 |
| Lifestyle questionnaires, mean (SD) | ||||||
| KIDMED score | 16 | 8.63 (3.07) | 9.38 (2.50) | 8.13 (3) | 0.099 | 0.538 |
| PAQ-C score | 16 | 3.22 (0.43) | 3.12 (0.90) | 3.32 (0.79) | 0.649 | 0.134 |
VO2peak: peak oxygen uptake; VO2 UV1: ventilatory threshold 1 oxygen uptake; PVO2 UV1: % ventilatory threshold 1 oxygen uptake; VE: ventilation FEV1: forced expiratory volume in 1 second; RER peak: respiratory exchange ratio; RR: respiratory reserve; BFMI: body fat mass index; FFMI: fat-free mass index; 30CST: 30Second Chair Stand Test; 10MWT: 10meter walk test; ml: milliliters; SD: standard deviation. Differences were assessed through one-way repeated measures ANOVA. η2p: partial eta-squared effect size. Significance was set at p<0.05.
The cardiorespiratory fitness of 28 patients was evaluated over several months and the data is presented in Table 2. No significant changes were found between T1 and T3 for VO2peak, VO2, PVO2, VE/VO2. A significant change was found in the FEV1 (p<0.001), RERpeak (p=0.043) and BR (p=0.017) with an increase of 42%. Finally, the heart rate variables showed no significant changes.
Quality of Life and Lifestyle After Treatment ImplementationThe CFQ-R was used to measure the health-related quality of life (HRQOL) of children with CF. The score of most of the domains improved but only the emotion (p=0.005), eat (p=0.02) and respiratory (p=0.001) domains showed a significant difference between T1 and T3. Regarding the lifestyle questionnaires, KIDMED showed no significant differences, on the other hand, PAQ-C questionnaire improved slightly (p=0.037).
Functional Tests After Treatment ImplementationA significant increase in the number of repetitions during 30CST was observed from T1 to T3 going from 19.64 to 28.77 (p<0.001). The score for the Stair Climb Test also improved significantly, going from 7.66s to 7.02s (p=0.029). Lastly, the 10MWT improved by a second from T1 to T3 (p=0.003).
Anthropometrics After Treatment ImplementationBetween T1 and T3, a decrease in body fat percentage of 5% and an increase of around 6% of lean body mass were observed but this was not significant. The body fat and fat free mass indexes also showed no significant differences over treatment period.
Participants With Previous CFTR TreatmentNine patients switched treatment going from ivacaftor/lumacaftor to ETI. Table 3 shows the changes from baseline to follow-up including primary and secondary outcomes in patients with previous CFTR treatment. For the cardiopulmonary variables, significant changes were found for the VE/VO2 (p=0.015) and BR (p=0.024). No significant changes were observed in the different CFQ-R domains. Regarding functional exercise capacity, a significant improvement was observed for the 30CST score which went from 19.5 to 28 (p=0.026).
Patients With ETI as Their First CFTR ModulatorNineteen children were started on ETI as their CFTR modulator. Table 4 shows the changes in primary and secondary outcomes from baseline to follow-up for modulator-naive patients. Regarding cardiopulmonary variables, FEV1 (p=0.004) showed a significant increase from T1 to T3. For the HRQOL, significant improvements were found in emotional (p=0.003), eating (p=0.048) and respiratory (p=0.004) domains. Those are similar to what was observed for the whole cohort. No significant differences were observed for the lifestyle questionnaires. This group also shows a significant improvement in 30CST score going from 19.96 to 29.06 (p=0.001). The 10-m walk test improved by half a second (p=0.044). Lastly, with regard to anthropometrics, a significant increase was found for the FFMI (p=0.007).
DiscussionThe present study evaluated the effects of an ETI treatment on exercise capacity in children with CF in real life conditions. Few published data exist on the impact of new modulators on cardiorespiratory fitness in pwCF, particularly with ETI and in children of our age range. This study also examined the possible difference in response between patients who had received previous CFTR modulator therapy and those who didn’t. The hypotheses were that ETI would not improve cardiorespiratory fitness although an increase could be observed in the pulmonary function. Also, the difference over time would be lower in patients who had already received a CFTR treatment previously.
No improvements were observed in VO2 peak, the main parameter for evaluating cardiorespiratory fitness. There were also no significant improvements when separated into modulator-naive patients and patients with previous CFTR treatment. Previous research has also investigated the impact of CFTR modulators on VO2 peak (ml/kg/min) in pwCF and conclusions are quite different. Ahmed et al. observed no significant difference in VO2 peak in a cohort of 19 adolescents, 4–8 months after treatment.19 They also found no significant differences when splitting the group into naive and previously treated patients. Similarly, Gur et al. found no significant improvements in VO2 peak three months after the initiation of ETI.20 Wilson et al. studied the impact of lumacaftor/ivacaftor on exercise tolerance in pwCF compared to patients on placebo and found no significant improvement in VO2 peak.11 However, some studies observed improvements in VO2 peak.9,10,21,22 Philipsen et al., in a study involving 229 CF patients aged 12 and older, found significant improvements in VO2 peak (+0.6ml/kg/min, 95% CI (0.1–1.1)) and other cardiopulmonary variables after one year of ETI treatment.21 Causer et al. also showed an improvement in peak VO2 with 6 weeks of ETI treatment in three adolescents with CF.9 They explained that those with more severe lung disease and lowest fitness levels had the greatest improvements. Studies using second generation CFTR-modulator treatment such as ETI also found improvements in VO2 peak after 1 year and 2 years of treatment.10,22 In our study, exercise capacity did not improve despite an improvement in lung function. Our patients have mild lung function impairment, which may influence the results; however, it is possible that patients with severe lung disease experience ventilatory limitations during exercise, reaching a respiratory reserve close to 0, and may see improvements following the use of the modulator.23
To determine if CPET was done maximally, a VO2 plateau is mostly looked for, which is difficult to obtain in healthy populations and even harder in pwCF. Therefore, secondary variables such as the respiratory exchange ratio (RER) help to determine a maximal effort. An RER of 1.1 or higher during CPET is a commonly accepted criterion indicating maximal effort. For children with CF it is set at 1.05. In this case, a significant increase in RER was observed from T1 (0.98 (0.08)) to T3 (1.03 (0.08)) in the whole cohort. RER is getting closer to 1.05, meaning that the patients are closer to performing maximally during exercise testing. All test were done at 85% of maximum heart rate at all three timepoints during this study.
A decrease in VE/VO2 is generally a positive indicator of respiratory efficiency and overall fitness, meaning that the body is becoming more efficient at extracting and utilizing oxygen.24 Unexpectedly, in this case, an increase in the VE/VO2 was observed in the group that had previous treatment, which is the opposite of what was found by Philipsen et al. and Gur et al. for example.20,21 This unexpected result could simply be explained by the small sample number, but an explanation could also be found at peripheral muscle level and more precisely at the endothelial cells where CFTR also plays a role.9 Adequate physical activity may play a more significant role in overall improvements than enhancements in lung function and the better functioning of the CFTR, highlighting the importance of a correct dose of physical exercise rather than focusing solely on pulmonary function improvements.
Improvements were also observed in BR in the whole cohort and in the patient group that received previous treatment. Ahmed et al. also found improvements in BR after 4 to 8 months on ETI treatment, particularly un modulator-naive patients.19 A low BR and low VO2 peak are suggested to be related to respiratory pathologies.13 As CF progresses, it limits ventilation and therefore, also limits exercise capacity.23 BR could be used as marker to follow the progression of CF.
As expected, lung function improved with ETI. Significant improvement in FEV1 was found in the whole cohort and in the group with no previous treatment. There are few studies that have investigated this parameter in real life conditions and in this age group, but under different settings, similar results were found in previous research.19–21,25,26
In summary, cardiorespiratory fitness depends on central factors (heart and lungs) and peripheral factors (muscular bioenergetics). Although our patients show improved pulmonary function following the initiation of ETI, their baseline impairment is mild. Therefore, their exercise intolerance is primarily due to muscular bioenergetic deficiencies.27 Addressing muscular alterations requires more time and potentially the integration of a stimulus, such as appropriately tailored high-intensity physical exercise.28
To assess the impact of ETI treatment on quality-of-life, the CFQ-R questionnaire was used. In this study a significant improvement was found in three domains for the whole cohort; emotion, eat and respiratory. Same improvements were also found in the modulator-naive group. McNally et al. for example, assessed quality of life over 1-year ETI treatment in 117 pwCF (12 years and older) in real-world conditions, showed a 14.2 points (95% CI, 11.3, 17.2) improvement for the respiratory domain.29 The responses can vary depending on the severity of the disease, where pwCF that are more severely affected have a bigger room for improvement. It needs to be mentioned this study was done in children and that age can play a major role in the perception of certain aspects, which could explain why the emotional domain improved in this case. Generally, it seems that the respiratory domain benefits the most of the ETI therapy.
Functional capacity was assessed using the 30CST, stair climb test and 10MWT. The whole cohort improved in all of them. Gur et al. found a significant improvement in the 6MWT but mentions that firm conclusions cannot be drawn to small sample size.20 Aubriot et al. found improvements in the 1STST but no improvements in the 6MWT.30
Several studies have shown improvements in BMI which could be explained by an improved nutritional status.9,20 A better functioning of the CFTR protein would lead to better pancreatic function and improved digestion and absorption of nutrients.9,20 In this study, despite good adherence to the Mediterranean diet, no significant improvements were observed regarding BMI – for –age – z-score, body fat and lean mass percentages. These results may be related to the measurement and comparison of these parameters in absolute value, instead of using BMI – for –age – z-score.
There are some limitations to be considered in this study. The main limitation is the small sample size. Especially when separated into two subgroup “modulator-naive” and “previous CFTR treatment”, where the “previous CFTR treatment” group consisted of only nine patients. Additionally, the lack of randomization may have introduced selection bias, potentially affecting the comparability of groups and the generalizability of the findings.
The strength of this study is that is the first study to measure exercise capacity in children 6–11 years old under ETI treatment in real life conditions.
ConclusionThis study confirms that there is a beneficial effect of ETI on lung function in children 6–11 years old with pwCF. However, those improvements were not translated to cardiorespiratory fitness parameters even though patients increased physical activity. More research is needed to understand the other factors that can play a role in exercise capacity such as muscle oxidative capacity.
Authors’ ContributionsM.P.R.: Methodology, Writing-Original Draft, Formal analysis.
M.B.: Formal Analysis, Investigation, Data Curation, Writing-Original Draft.
P.F.G.: Clinical trial sample recruitment, Resources, Writing-Review & Editing, Funding acquisition.
C.M.G.: Methodology, Writing-Review & Editing.
A.M.T.: Clinical trial sample recruitment.
A.L.N.: Methodology, Writing-Review & Editing.
M.R.V.: Clinical trial sample recruitment.
M.R.: Investigation, Formal analysis, Data Curation, Writing-Review & Editing.
V.S.S.: Conceptualization, Methodology, Supervision, Funding acquisition, Writing-Review & Editing, Project administration.
Conflicts of InterestsMargarita Pérez-Ruiz, Alejandro López-Neyra and Verónica Sanz-Santiago have received speaking fees from Vertex Pharmaceuticals®.
Thanks to it XXIII Premios Neumomadrid and Beca jóvenes investigadores SENP (Sociedad Española de Neumología pediátrica) as been possible to complete this research project.


