


Although higher incidence of cancer represents a major burden for obstructive sleep apnea (OSA) patients, the molecular pathways driving this association are not completely understood. Interestingly, adenosinergic signaling has emerged as a powerful immune checkpoint driving tumor development and progression.
MethodsHere, we explored the expression of the adenosinergic ecto-enzymes CD39 and CD73 in T-lymphocytes of OSA patients without any evidence of cancer, as well as their soluble forms in plasma (sCD39 and sCD73), along with adenosine. In addition, we explored the role of intermittent hypoxia (IH) in this context by in vitro models.
ResultsOur results showed that CD39 is upregulated while CD73 is downregulated in OSA T-cells’ membrane. Moreover, our findings suggest that IH, through HIF-1, mediates the upregulation of both CD39 and CD73; and that CD73 downregulation could be mediated by a higher release of sCD73 by OSA T-lymphocytes. Importantly, we found that both sCD39 and sCD73 are upregulated in OSA plasma, suggesting T-lymphocytes as a potential source for plasmatic sCD73. Finally, our data propose the alterations in CD39/CD73 axis could underlie the upsurge of adenosine levels in the plasma of OSA patients.
ConclusionOur study reveals a hypoxia-mediated alteration of the CD39/CD73 axis in OSA patients, which could trigger ADO upregulation, thus potentially contributing to the immune suppressive environment and ultimately facilitating tumor development and progression. Therefore, our data highlights the need for new longitudinal studies evaluating CD39 and/or CD73 as potential cancer-risk prognostic biomarkers in OSA patients.
Obstructive sleep apnea (OSA) is a growing societal health concern linked to an elevated risk of serious conditions like cardiovascular disease and cancer.1–4 These comorbidities are directly related to OSA associated mortality, and its early detection and characterization represent a major challenge in clinical practice.5–7 So far, substantial efforts have focused on unraveling the pathogenic molecular mechanisms driving OSA complications, highlighting the immune system as an important mediatory player. In this line, intermittent hypoxia (IH), the main hallmark feature of OSA, has been shown to induce alterations in several immune subsets, inducing inflammation while compromising the immune surveillance system. Regarding the latter, both in OSA patients and in animal models, a switch to tumor-associated macrophages and a defect in NK cell maturation have been reported as well as suppression of T cells function mediated by overexpression of some immune checkpoints such as PD-1/PD-L1 (Programmed Cell Death Protein 1/Programmed Cell Death Ligand 1) and membrane-bound PSGL-1 (P-selectin glycoprotein ligand-1).8–11 These modifications appear even before tumor onset and could contribute to the establishment of an immunosuppressive phenotype, thus providing biological plausibility to the increased risk of cancer in OSA patients. Unraveling early alterations appearing even before tumor onset could offer fresh resources for categorizing subjects with OSA who are at a heightened risk of developing cancer.12 This enhancement in classification would refine the understanding of OSA patients, facilitating early intervention.
In this context, extracellular adenosine (ADO) is well described as a potent immunosuppressive agent present in the tumor microenvironment, and interestingly it has been shown to be upregulated in the plasma of sleep apnea patients.13,14 Extracellular adenosine could be produced by passive diffusion or active transport of intracellular adenosine.15 However, it can also be generated by the enzymatic hydrolysis of extracellular ATP, which is released under conditions of hypoxia or inflammation, such as those occurring in the OSA pathophysiological context.16,17 Briefly, extracellular ATP is converted to AMP by CD39, and then AMP is further hydrolyzed to ADO by CD73.18 Importantly, ADO is known to suppress the activity of numerous immune cells including phagocytes, dendritic cells, NK cells and lymphocytes T and B.19 In this line, CD39/CD73 T-cell expression has been linked to gene expression signatures of immune dysfunction and exhaustion.20 In fact, both CD39 and CD73 have been shown to be upregulated in several tumors, and associated to poor clinical outcomes.21 Notably, both CD39 and CD73 are also upregulated under hypoxia and inflammatory conditions,22 however, it expression in OSA patients has not been assessed yet. Here, we explored CD39 and CD73 expression in T-lymphocytes of OSA patients without any evidence of cancer, addressing the intermittent hypoxia effect in this context. Also, we explored the expression in plasma of CD39/CD73 soluble forms, along with ADO, in order to provide a complete picture of OSA adenosinergic system.
MethodsA detailed description of the methods is provided in the Supplementary material.
Study SubjectsThis study involved 166 individuals diagnosed with severe obstructive sleep apnea (OSA) and 83 control subjects (CS). A comprehensive outline of the selection criteria can be found in the supplementary online materials. In summary, OSA diagnosis was established through respiratory polygraphy, utilizing the Embletta GOLD device (ResMed). This procedure involved continuous monitoring of oronasal airflow, pressure, heart rate, chest and abdominal breathing patterns, as well as oxygen saturation (SaO2). Apnea was defined as an interruption of oronasal flow of >10s. Hypopnea was defined as a 30–90% reduction in the oronasal airflow for >10s associated with an oxygen desaturation≥3%. Patients were classified as severe OSA if their apnea–hypopnea index (AHI) exceeded 30.2 None of the patients included in the study were being treated with CPAP or any type of medication for OSA management, such as MAD device, etc. Control subjects (CS), matched for gender and age with OSA patients, were selected from the census register of the Madrid, Spain metropolitan area. Respiratory polygraphy confirmed the absence of OSA in the healthy subjects. All participants provided written informed consent, and the study was approved by the local ethics committees.
Peripheral Blood Mononuclear Cells Isolation and CulturePeripheral blood mononuclear cells (PBMCs) were isolated using centrifugation with a Ficoll-Paque Plus (Amersham Bioscience, Uppsala, Sweden) density gradient. Subsequently, 5×10⁶PBMCs were plated in each well of 6-well plates. These cells were then cultured in RPMI 1640 medium supplemented with 100U/mL penicillin, 100μg/mL streptomycin, and 10% fetal bovine serum (FBS). Finally, the cells were incubated for 16h at 37°C in a 5% CO2 atmosphere.
Plasma Protein and Adenosine QuantificationPlasma was isolated by centrifugation using a Ficoll-Paque Plus (Amersham Bioscience, Uppsala, Sweden) density gradient. Immediately, all samples were divided into aliquots, frozen, and preserved at −80°C until subsequent analysis. The measurement of all analytes was conducted through specific commercial human enzyme-linked immunosorbent assay (ELISA) for CD39 (CSB-EL007690HU, CUSABIO, https://www.cusabio.com, Houston, TX, USA), CD73 (EH0468, FineTest, Boulder, CO, USA) and ADO (MBS2605344, MyBioSouce, San Diego, CA, USA), adhering to the manufacturer's instructions. Duplicate measurements were taken for each plasma sample. The intra-assay and inter-assay variabilities are specified in Supplementary Table S2.
Statistical AnalysisComparisons between study groups were executed using the T-test, with Welch's correction applied when necessary, and the Chi-squared test for categorical variables. In the case of in vitro assays, we employed either a two-way ANOVA with post hoc Tukey's tests or a paired T-test, depending on the nature and distribution of the variables. Correlations were assessed using Spearman's rank correlation. An a priori power analysis was conducted using G*Power version 3.1.9.723 to determine the minimum sample size required to test the study hypothesis. Results indicated the required sample size to achieve 95% power at a significance criterion of α=0.05, for detecting a medium effect between two independent means of groups represented in a ratio 1:2 was n=236 (n=157 for OSA group, n=79 for the CS group). Thus, the obtained sample size of n=249 (n=166 for OSA group, n=83 for the CS group) is adequate to test the study hypothesis. For all analyses, a p-value<0.05 was considered significant. Statistical analyses were performed using Prism 8.0 software (GraphPad, USA).
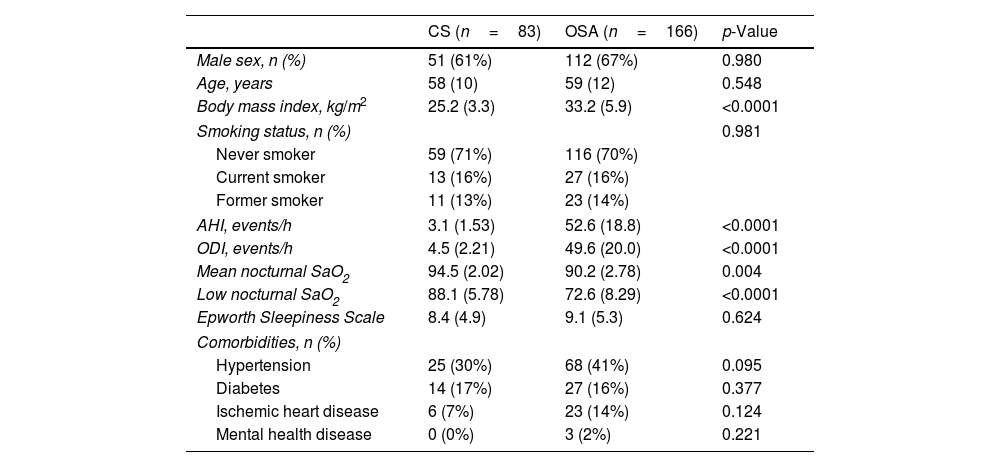
ResultsParticipants’ baseline characteristics are reported in Table 1.
Main Characteristics of Study Subjects.
| CS (n=83) | OSA (n=166) | p-Value | |
|---|---|---|---|
| Male sex, n (%) | 51 (61%) | 112 (67%) | 0.980 |
| Age, years | 58 (10) | 59 (12) | 0.548 |
| Body mass index, kg/m2 | 25.2 (3.3) | 33.2 (5.9) | <0.0001 |
| Smoking status, n (%) | 0.981 | ||
| Never smoker | 59 (71%) | 116 (70%) | |
| Current smoker | 13 (16%) | 27 (16%) | |
| Former smoker | 11 (13%) | 23 (14%) | |
| AHI, events/h | 3.1 (1.53) | 52.6 (18.8) | <0.0001 |
| ODI, events/h | 4.5 (2.21) | 49.6 (20.0) | <0.0001 |
| Mean nocturnal SaO2 | 94.5 (2.02) | 90.2 (2.78) | 0.004 |
| Low nocturnal SaO2 | 88.1 (5.78) | 72.6 (8.29) | <0.0001 |
| Epworth Sleepiness Scale | 8.4 (4.9) | 9.1 (5.3) | 0.624 |
| Comorbidities, n (%) | |||
| Hypertension | 25 (30%) | 68 (41%) | 0.095 |
| Diabetes | 14 (17%) | 27 (16%) | 0.377 |
| Ischemic heart disease | 6 (7%) | 23 (14%) | 0.124 |
| Mental health disease | 0 (0%) | 3 (2%) | 0.221 |
Data are expressed as number (percentage) or mean (standard deviation). Comparisons between groups were performed by Student's T-test or Chi-squared test. Abbreviations: AHI=apnea–hypopnea index; ODI=oxygen desaturation index, SaO2=oxyhemoglobin saturation.
As a first approach, we analyzed the expression of CD73 and CD39 in the surface of severe OSA and CS T-lymphocytes. Unexpectedly, our data reveal that CD73 expression is decreased while CD39 levels are increased in the surface of CD8+ T cells (Fig. 1A, B). In order to understand the effect of OSA in the expression of both biomarkers, we assess its correlation with the clinical indicators as apnea hypopnea index (AHI), oxygen desaturation index (ODI) and Epworth sleepiness scale (ESS). Strikingly, our results show that both CD73 and CD39 positively correlated with AHI the key indicator of OSA severity (Fig. 1C, D and Supp. Table 4). Similar results were obtained for the CD4+ T-cell subset: CD73 expression is downregulated, while CD39 is upregulated in CD4+ T cells from OSA patients (Fig. 1E, F). In addition, the expression of both enzymes also correlated with AHI, indicating a positive association with OSA severity (Fig. 1G, H and Supp. Table 4). This finding prompt us to speculate that OSA T-cell populations may be characterized by a CD39+ CD73− phenotype, which has been described in other diseases such as type-II diabetes,24 however we found no differences in this subpopulation between OSA subjects and CS (data not shown). In contrast, we found that CD39+CD73+ population was increased in CD4+ and CD8+ T-cells from OSA patients (Supp. Fig. S1A, B). Furthermore, the percentage of this population correlated with AHI (Supp. Fig. S1C, D). Finally, we assessed the mRNA expression of CD39-(ENTPD1) and CD73-(NT5E) encoding genes, showing that CD73 mRNA levels do not vary between OSA patients and CS, while CD39 mRNA expression was increased (Supp. Fig. S1E, F). Moreover, the expression of both genes strongly correlated with the levels of hypoxia inducible factor (HIF)-1α (Supp. Fig. S1G, H). Altogether, these data suggest that CD73 and CD39 are increased along OSA severity, which seems to be opposed to the observed CD73 downregulation in OSA T-cells.
![CD39 and CD73 expression in T-lymphocytes from patients with severe obstructive sleep apnea. (A, B) Percentage of CD8+ T-lymphocytes that expressed CD73 (A) or CD39 (B) determined by flow cytometry in control subjects (CS, n=83) and OSA patients (OSA, n=166). (C-D) Spearman rank correlation between apnea-hypopnea index [AHI] and the percentage of CD8+ T-lymphocytes that expressed CD73 (C) or CD39 (D). (E, F) Percentage of CD4+ T-lymphocytes that expressed CD73 (E) or CD39 (F) determined by flow cytometry in control subjects (CS, n=83) and OSA patients (OSA, n=166). (G, H) Spearman rank correlation between apnea-hypopnea index [AHI] and the percentage of CD4+ T-lymphocytes that expressed CD73 (G) or CD39 (H). The line represents the regression line and the shading represents the 95% CI. Comparisons between groups were performed by Student](https://static.elsevier.es/multimedia/03002896/0000006000000004/v1_202404020528/S030028962400053X/v1_202404020528/en/main.assets/gr1.jpeg?xkr=ue/ImdikoIMrsJoerZ+w9zfHQrK7O1GixshFj/RYvvhfIeFLIshOrwnoGDwJytw3P/oiFcT3h6qa0s2Be593HiC/voL71XRfnumUSVqb607Ak8teeqEd0Fqkc8Xp1qaetmCYFuA2Id3axevNGeO4f5rR4D0fnlc3BJQS+xiDiStsMZHbKvc4GRapdYzBQE00QHMKow9t59u37xpC8hXZaFEpbTdA9Av+B9+GchEqTGz6wnoDzg7tKO2/TCSvFXQQNJX5UuiaupQrSX1vR2B0NeHq8Tar7+rPBOumy7y0+80= "CD39 and CD73 expression in T-lymphocytes from patients with severe obstructive sleep apnea. (A, B) Percentage of CD8+ T-lymphocytes that expressed CD73 (A) or CD39 (B) determined by flow cytometry in control subjects (CS, n=83) and OSA patients (OSA, n=166). (C-D) Spearman rank correlation between apnea-hypopnea index [AHI] and the percentage of CD8+ T-lymphocytes that expressed CD73 (C) or CD39 (D). (E, F) Percentage of CD4+ T-lymphocytes that expressed CD73 (E) or CD39 (F) determined by flow cytometry in control subjects (CS, n=83) and OSA patients (OSA, n=166). (G, H) Spearman rank correlation between apnea-hypopnea index [AHI] and the percentage of CD4+ T-lymphocytes that expressed CD73 (G) or CD39 (H). The line represents the regression line and the shading represents the 95% CI. Comparisons between groups were performed by Student")
CD39 and CD73 expression in T-lymphocytes from patients with severe obstructive sleep apnea. (A, B) Percentage of CD8+ T-lymphocytes that expressed CD73 (A) or CD39 (B) determined by flow cytometry in control subjects (CS, n=83) and OSA patients (OSA, n=166). (C-D) Spearman rank correlation between apnea-hypopnea index [AHI] and the percentage of CD8+ T-lymphocytes that expressed CD73 (C) or CD39 (D). (E, F) Percentage of CD4+ T-lymphocytes that expressed CD73 (E) or CD39 (F) determined by flow cytometry in control subjects (CS, n=83) and OSA patients (OSA, n=166). (G, H) Spearman rank correlation between apnea-hypopnea index [AHI] and the percentage of CD4+ T-lymphocytes that expressed CD73 (G) or CD39 (H). The line represents the regression line and the shading represents the 95% CI. Comparisons between groups were performed by Student's T-test with Welch's correction, differences remain significant after adjustment for BMI: %CD8+ CD73+, adjusted p-value<0.0001; %CD8+ CD39+, adjusted p-value=0.0015; %CD4+ CD73+, adjusted p-value=0.0013; %CD4+ CD39+, adjusted p-value=0.0364. Spearman's correlation coefficients (ρ) and p-values are shown.
To further assess the effect of hypoxemia in the expression of CD73 and CD39, we performed an intermittent hypoxia in vitro model using healthy volunteers PBMCs, along with loss/gain-of function approaches. First, we cultured healthy PBMCs in an intermittent hypoxia chamber, with oxygen cycling from 1% to 21% for 16h. Our results showed that IH increased surface CD73 and CD39 expression in T cell populations (Fig. 2A–D, Supp. Fig. S2A, B). Moreover, this effect is blocked when cells are concomitantly treated with the HIF-1α inhibitor PX-478 (Fig. 2A–D, Supp. Fig. S2A, B). As a complementary approach, we used the agent DMOG, which inhibits HIF-1α degradation, triggering its signaling under normoxia conditions. Accordingly, data show an upregulation of CD73 and CD39 upon DMOG treatment, confirming the HIF-1α role in upregulating both enzymes (Fig. 2E–H, Supp. Fig. S2C, D). Besides, we analyzed the mRNA expression of CD73 and CD39 in these in vitro models, showing similar results (Supp. Fig. S2E–H). Collectively, these results propose that intermittent hypoxia, through HIF-1α, promotes CD73 and CD39 expression in circulating T-cells.
 Fold change of the percentage of CD8+ (A) or CD4+ (B) T-lymphocytes that expressed CD73 determined by flow cytometry in healthy volunteer")
Intermittent hypoxia effect on CD73 and CD39 expression. (A, B) Fold change of the percentage of CD8+ (A) or CD4+ (B) T-lymphocytes that expressed CD73 determined by flow cytometry in healthy volunteer's cells (n=8) treated or not with a specific inhibitor for HIF-1α (PX-478, 30μM) cultured under normoxia (N) or intermittent hypoxia (IH) conditions for 16h, data were normalized to the normoxia-control condition. (C, D) Fold change of the percentage of CD8+ (C) or CD4+ (D) T-lymphocytes that expressed CD39 determined by flow cytometry in healthy volunteer's cells (n=8) treated or not with a specific inhibitor for HIF-1α (PX-478, 30μM) cultured under normoxia (N) or intermittent hypoxia (IH) conditions for 16hours, data were normalized to the normoxia-control condition. Comparisons between groups were performed by Two-way ANOVA with Tukey's correction for multiple comparison tests, corrected p-values are shown. (E, F) Fold change of the percentage of CD8+ (E) or CD4+ (F) T-lymphocytes that expressed CD73 determined by flow cytometry in healthy volunteers’ cells (n=10) treated or not with 100μM of dimethyloxallyl glycine (DMOG) for 16h in routine culture conditions, data were normalized to the normoxia-control condition. (G, H) Fold change of the percentage of CD8+ (G) or CD4+ (H) T-lymphocytes that expressed CD39 determined by flow cytometry in healthy volunteers’ cells (n=10) treated or not with 100μM of dimethyloxallyl glycine (DMOG) for 16h in routine culture conditions, data were normalized to the control condition. Comparisons between groups were performed by paired T-test, p values are shown.
Interestingly, both CD73 and CD39 have been shown to be released to the extracellular space, and a catalytically-active soluble form of both enzymes is present in the human plasma.25 Therefore, we analyzed soluble CD73 (sCD73) and soluble CD39 (sCD39) plasma concentrations, showing that both forms are upregulated in the plasma of OSA patients (Fig. 3A, B). Moreover, we explored its association with OSA severity, underscoring an association of sCD73 with AHI (Fig. 3C and Supp. Table 4). Conversely, the soluble form of CD39 was not associated to OSA severity (Fig. 3D and Supp. Table 4). In addition, we assessed the correlation between the soluble form concentration in the plasma and the lymphocyte membrane expression of each marker. Results showed that sCD73 plasma levels correlated with the corresponding CD73 membrane expression (Fig. 3E). However, sCD39 was not related to its expression in the lymphocyte membrane, suggesting that other populations are contributing to its high plasma levels (Fig. 3F). Additionally, we performed an ex vivo assay, analysing the supernatant of OSA and CS PBMCs culture. In this line, we find higher levels of sCD73 in the supernatant of OSA leukocyte culture, while no difference was shown in regard to sCD39 (Fig. 3G, H). Furthermore, sCD73 supernatant levels positively correlated with AHI and membrane-bound CD8+ CD73 expression (Fig. 3I). In summary, these findings suggest that CD73 is being released from OSA T-lymphocytes, while CD39 may be released from other cell types in a process that may not be influenced by OSA severity.
![Plasma levels of soluble CD73 and CD39 in patients with obstructive sleep apnea. (A, B) Plasma levels of the soluble forms of CD73 (sCD73) (A) and CD39 (sCD39) (B) determined by enzyme-linked immunosorbent assay (ELISA) (CS, n=33) and OSA patients (OSA, n=82). (C, D) Spearman rank correlation between apnea–hypopnea index [AHI] and sCD73 (C) or sCD39 (D). (E) Spearman rank correlation between sCD73 levels and the percentage of CD8+ (left panel) or CD4+ (right panel) T-lymphocytes that expressed CD73 determined by flow cytometry in OSA patients. (F) Spearman rank correlation between sCD39 levels and the percentage of CD8+ (left panel) or CD4+ (right panel) T-lymphocytes that expressed CD39 determined by flow cytometry in OSA patients. The line represents the regression line and the shading represents the 95% CI. (G, H) Supernatant levels of the soluble forms of CD73 (sCD73) (G) and CD39 (sCD39) (H) determined by enzyme-linked immunosorbent assay (ELISA). Supernatants were obtained from PBMCs cultures of controls subjects (n=7) and OSA (n=7) patients which were maintained for 16h in routine culture conditions. (I) Table depicting spearman rank correlation between supernatant sCD73 levels and apnea-hypopnea index [AHI], percentage of CD8+ or CD4+ T-lymphocytes that expressed CD73 determined by flow cytometry in each OSA patient. (ρ) and p-values are shown. Comparisons between groups were performed by Student](https://static.elsevier.es/multimedia/03002896/0000006000000004/v1_202404020528/S030028962400053X/v1_202404020528/en/main.assets/gr3.jpeg?xkr=ue/ImdikoIMrsJoerZ+w9zfHQrK7O1GixshFj/RYvvhfIeFLIshOrwnoGDwJytw3P/oiFcT3h6qa0s2Be593HiC/voL71XRfnumUSVqb607Ak8teeqEd0Fqkc8Xp1qaetmCYFuA2Id3axevNGeO4f5rR4D0fnlc3BJQS+xiDiStsMZHbKvc4GRapdYzBQE00QHMKow9t59u37xpC8hXZaFEpbTdA9Av+B9+GchEqTGz6wnoDzg7tKO2/TCSvFXQQNJX5UuiaupQrSX1vR2B0NeHq8Tar7+rPBOumy7y0+80= "Plasma levels of soluble CD73 and CD39 in patients with obstructive sleep apnea. (A, B) Plasma levels of the soluble forms of CD73 (sCD73) (A) and CD39 (sCD39) (B) determined by enzyme-linked immunosorbent assay (ELISA) (CS, n=33) and OSA patients (OSA, n=82). (C, D) Spearman rank correlation between apnea–hypopnea index [AHI] and sCD73 (C) or sCD39 (D). (E) Spearman rank correlation between sCD73 levels and the percentage of CD8+ (left panel) or CD4+ (right panel) T-lymphocytes that expressed CD73 determined by flow cytometry in OSA patients. (F) Spearman rank correlation between sCD39 levels and the percentage of CD8+ (left panel) or CD4+ (right panel) T-lymphocytes that expressed CD39 determined by flow cytometry in OSA patients. The line represents the regression line and the shading represents the 95% CI. (G, H) Supernatant levels of the soluble forms of CD73 (sCD73) (G) and CD39 (sCD39) (H) determined by enzyme-linked immunosorbent assay (ELISA). Supernatants were obtained from PBMCs cultures of controls subjects (n=7) and OSA (n=7) patients which were maintained for 16h in routine culture conditions. (I) Table depicting spearman rank correlation between supernatant sCD73 levels and apnea-hypopnea index [AHI], percentage of CD8+ or CD4+ T-lymphocytes that expressed CD73 determined by flow cytometry in each OSA patient. (ρ) and p-values are shown. Comparisons between groups were performed by Student")
Plasma levels of soluble CD73 and CD39 in patients with obstructive sleep apnea. (A, B) Plasma levels of the soluble forms of CD73 (sCD73) (A) and CD39 (sCD39) (B) determined by enzyme-linked immunosorbent assay (ELISA) (CS, n=33) and OSA patients (OSA, n=82). (C, D) Spearman rank correlation between apnea–hypopnea index [AHI] and sCD73 (C) or sCD39 (D). (E) Spearman rank correlation between sCD73 levels and the percentage of CD8+ (left panel) or CD4+ (right panel) T-lymphocytes that expressed CD73 determined by flow cytometry in OSA patients. (F) Spearman rank correlation between sCD39 levels and the percentage of CD8+ (left panel) or CD4+ (right panel) T-lymphocytes that expressed CD39 determined by flow cytometry in OSA patients. The line represents the regression line and the shading represents the 95% CI. (G, H) Supernatant levels of the soluble forms of CD73 (sCD73) (G) and CD39 (sCD39) (H) determined by enzyme-linked immunosorbent assay (ELISA). Supernatants were obtained from PBMCs cultures of controls subjects (n=7) and OSA (n=7) patients which were maintained for 16h in routine culture conditions. (I) Table depicting spearman rank correlation between supernatant sCD73 levels and apnea-hypopnea index [AHI], percentage of CD8+ or CD4+ T-lymphocytes that expressed CD73 determined by flow cytometry in each OSA patient. (ρ) and p-values are shown. Comparisons between groups were performed by Student's T-test with Welch's correction, differences remain significant after adjustment for BMI: sCD73, adjusted p-value 0.0484; sCD39, adjusted p-value=0.0055. Spearman's correlation coefficients (ρ) and p-values are shown.
Finally, we addressed the plasma concentrations of ADO. As previously reported,13 our results showed that ADO levels are increased in the plasma of OSA patients (Fig. 4A). In addition, ADO levels were positively associated with OSA severity, through AHI (Fig. 4B and Supp. Table 4). We found a positive correlation between ADO levels and the percentage of T cells that expressed both CD39 and CD73 (Supp. Fig. S3A, B). In line, ADO levels correlated and with sCD73, while no association was found with sCD39, probably because ADO is a direct product of sCD73 but not of sCD39 (Fig. 4C, D). Overall, these data support an alteration of the purinergic/adenosinergic signaling that result in an upregulation of ADO levels, which could ultimately contribute to the establishment of an immunosuppressive microenvironment in OSA patients.
![Plasma levels of ADO in patients with obstructive sleep apnea. (A) Plasma levels of ADO determined by enzyme-linked immunosorbent assay (ELISA) control subjects (CS, n=33) and OSA patients (OSA, n=84). (B) Spearman rank correlation between apnea-hypopnea index [AHI] and ADO levels. (C, D) Spearman rank correlation between ADO and sCD73 (C) or sCD39 (D) levels. The line represents the regression line and the shading represents the 95% CI. Comparisons between groups were performed by Student](https://static.elsevier.es/multimedia/03002896/0000006000000004/v1_202404020528/S030028962400053X/v1_202404020528/en/main.assets/gr4.jpeg?xkr=ue/ImdikoIMrsJoerZ+w9zfHQrK7O1GixshFj/RYvvhfIeFLIshOrwnoGDwJytw3P/oiFcT3h6qa0s2Be593HiC/voL71XRfnumUSVqb607Ak8teeqEd0Fqkc8Xp1qaetmCYFuA2Id3axevNGeO4f5rR4D0fnlc3BJQS+xiDiStsMZHbKvc4GRapdYzBQE00QHMKow9t59u37xpC8hXZaFEpbTdA9Av+B9+GchEqTGz6wnoDzg7tKO2/TCSvFXQQNJX5UuiaupQrSX1vR2B0NeHq8Tar7+rPBOumy7y0+80= "Plasma levels of ADO in patients with obstructive sleep apnea. (A) Plasma levels of ADO determined by enzyme-linked immunosorbent assay (ELISA) control subjects (CS, n=33) and OSA patients (OSA, n=84). (B) Spearman rank correlation between apnea-hypopnea index [AHI] and ADO levels. (C, D) Spearman rank correlation between ADO and sCD73 (C) or sCD39 (D) levels. The line represents the regression line and the shading represents the 95% CI. Comparisons between groups were performed by Student")
Plasma levels of ADO in patients with obstructive sleep apnea. (A) Plasma levels of ADO determined by enzyme-linked immunosorbent assay (ELISA) control subjects (CS, n=33) and OSA patients (OSA, n=84). (B) Spearman rank correlation between apnea-hypopnea index [AHI] and ADO levels. (C, D) Spearman rank correlation between ADO and sCD73 (C) or sCD39 (D) levels. The line represents the regression line and the shading represents the 95% CI. Comparisons between groups were performed by Student's T-test with Welch's correction, differences remain significant after adjustment for BMI: sADO, adjusted p-value 0.0427. Spearman's correlation coefficients (ρ) and p-values are shown.
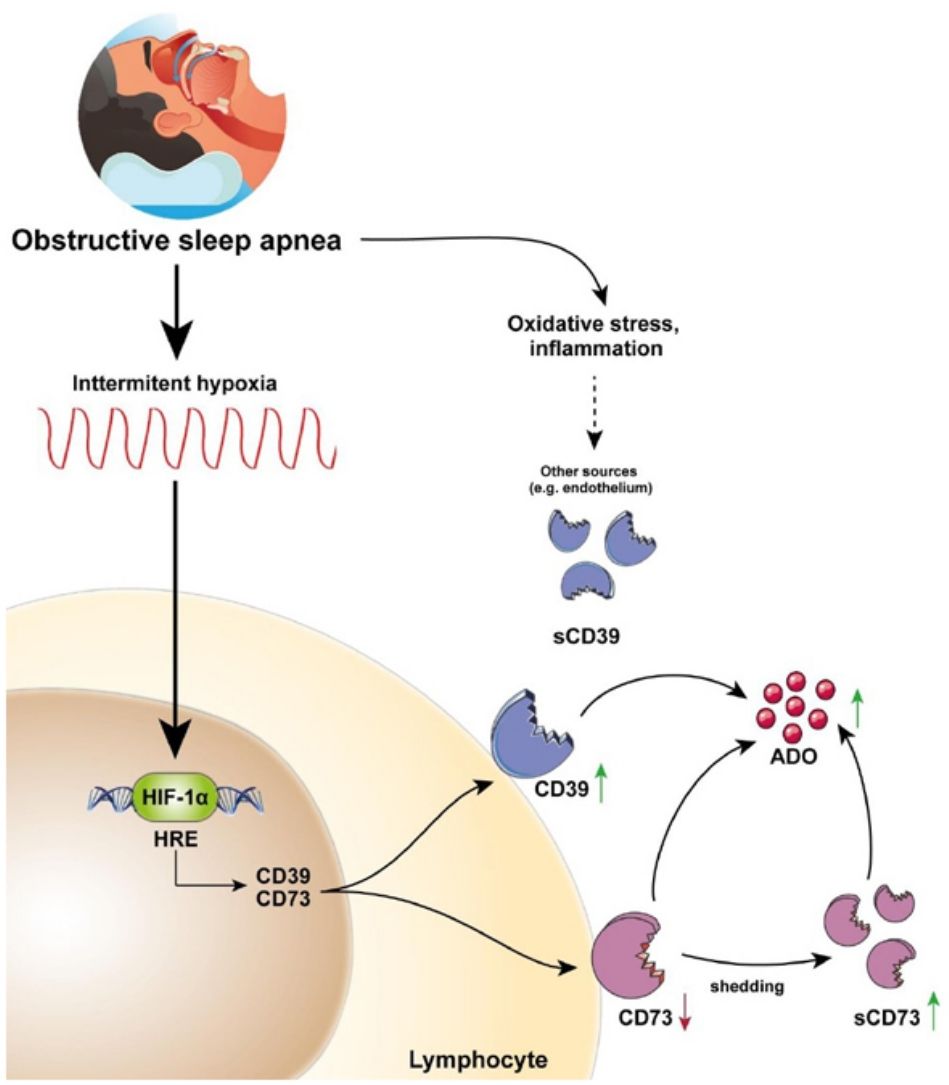
This study describes for the first time the overexpression of the CD39/CD73 pathway in severe OSA patients and propose hypoxemia as a mediatory mechanism triggering this upregulation. Moreover, our results suggest the alterations in CD39/CD73 axis could underlie the upsurge of adenosine (ADO) levels in the plasma from OSA patients (Fig. 5). Interestingly, extracellular ADO is well-described as a potent immunosuppressive agent by regulating both innate and adaptive immune responses.26 In this line, the bulk of extracellular adenosine generation is known to rely on CD39 and CD73-mediated catabolism of extracellular ATP, which is a potent chemotactic and stimulatory factor for immune cells.26 Hence, CD39/CD73 axis, not only promotes immunosuppression by generating ADO, but also by reducing ATP levels, thus counterbalancing its pro-inflammatory effects. Consequently, several studies have pointed to the critical task carried out by CD39 and CD73 in generating an immunosuppressed environment. In line, a substantial amount of studies has reported that CD39/CD73 expression and activity is elevated in in several solid tumors (colorectal cancer, head and neck cancer, pancreatic cancer) as well as in chronic lymphocytic leukemia, suggesting the involvement of these enzymes in the onset and progression of neoplasia.19,27
. Interestingly, plasma sCD39 levels were also upregulated, but, sCD39 is not shed from the lymphocyte membrane. Moreover, ADO levels were upregulated in the plasma of OSA patients. Therefore, we speculated that the upregulation of plasmatic and/or membrane-bound CD73 and CD39 results in an upsurge of ADO levels. Ultimately, increased ADO levels could dampen immune response, potentially contributing to the establishment of a tumor-promoting microenvironment in OSA patients.")
CD39/CD73 axis is dysregulated in sleep apnea patients, resulting in adenosine accumulation. Intermittent hypoxia, through HIF-1α, mediates the upregulation of CD73 and CD39 in the lymphocytes of sleep apnea patients. CD73 may be released from these lymphocytes, potentially resulting in decreased expression of membrane-bound CD73, and increased plasma levels of its soluble form (sCD73). Interestingly, plasma sCD39 levels were also upregulated, but, sCD39 is not shed from the lymphocyte membrane. Moreover, ADO levels were upregulated in the plasma of OSA patients. Therefore, we speculated that the upregulation of plasmatic and/or membrane-bound CD73 and CD39 results in an upsurge of ADO levels. Ultimately, increased ADO levels could dampen immune response, potentially contributing to the establishment of a tumor-promoting microenvironment in OSA patients.
In particular, CD39 and CD73 are upregulated under hypoxic conditions, mainly via HIF-1α,28,29 as well as, the enzyme activity of CD39/CD73 increase during hypoxia.28 Indeed, OSA severity is related to CD39/CD73 expression and our in vitro model revealed that intermittent hypoxia exposure, through HIF-1α, induced the upregulation of both CD39 and CD73 in the T-lymphocyte membrane. Despite the hypoxemia gene upregulation effect of CD39/CD73, helper and cytotoxic T-lymphocytes from OSA patients exhibited a decreased CD73 expression. Interestingly, Schneider et al., demonstrated that CD73 diminished drastically from the surface of T-cells upon activation, due to the release of CD73-containing extracellular vesicles (EVs).30 In fact, CD73 has been detected on human exosomes isolated from plasma and serum, where it maintains its enzymatic activity.31 Moreover, CD73 is a GPI-anchored protein, and, therefore it clusters at the plasma membrane in lipid-rafts that are poised for EVs formation.31 In this line, a soluble catalytically active form of CD73 has also been reported to be shed from the plasma membrane through proteolytic cleavage or hydrolysis of the GPI anchor by phosphatidylinositol specific phospholipases.19 Herein, our results suggest that OSA T-cells released higher levels CD73 in comparison with control subjects; and sCD73 levels are upregulated in the plasma of OSA patients. Therefore, our data propose the OSA hypoxemia is capable to increase CD39/CD73 T cell membrane expression and CD73 down-regulation in T-cells could be mediated by a higher release of this protein to the plasma, either as a soluble form or contained in EVs.
Furthermore, our data exhibited a dysregulation of CD39 and CD73 axis on T cells. The CD39/CD73 expression has been linked to an autocrine mechanism of immune suppression, involving the pericellular generation of adenosine, which forms an “adenosine halo”.19 Moreover, the overexpression CD39/CD73 in T-cells is recognized for its role in the evasion of immune response in tumors. This occurs by inhibiting the activation, clonal expansion, and homing of T helper and cytotoxic T cells, while enhancing the suppressive capabilities of Tregs. Strikingly, our data showed that CD39 is elevated, while CD73 is decreased in the membrane of helper and cytotoxic T-lymphocytes from OSA patients. These results suggest a potential accumulation of AMP in the “purinergic halo” of T-cells. Interestingly, AMP has been reported to inhibit T-cell activation and proliferation by binding to the adenosine receptor A1R.32,33
An important outstanding finding is the relevance of sCD73, indeed, a great number of publications state that sCD73 expression and activity are increased in several human cancers.34,35 Moreover, sCD73 activity was related to advanced stages of cancer and poor outcomes.34,36 Similar to our analysis, these studies focused on circulating CD73, which also includes EVs, so it is still unclear whether the soluble CD73 expression and/or activity is influenced by the exosomal form. To date, no studies considering both the shed and the exosomal forms have been published, further work will be required to dissect the specific roles. All these evidence constitute the rationale for new research aimed to clarify whether CD73 could be used as a soluble biomarker for cancer risk in OSA patients.
The data derived from our study suggests an increase in soluble CD39 form in the plasma of patients. Notably, our findings reveal that plasma levels of sCD39 do not exhibit a correlation with the severity of OSA. Additionally, despite CD39 being influenced by hypoxia, its expression is intricately regulated by various mechanisms, including oxidative stress and inflammatory cytokines.19 Specifically, CD39 gene is governed by transcription factors like Sp1 and signal transducer and activator of transcription (STAT)-3. Moreover, the presence of various proinflammatory mediators, such as transforming growth factor (TGF)-β, interferons (IFNs), tumor necrosis factor (TNF)-α and interleukin (IL)-6, also contributes to CD39 regulation.19 In contrast, IL-4 signaling leads to a reduction in CD39 levels.37 This evidence suggests that the expression of CD39 may be subjected to a complex molecular regulatory mechanisms. Consequently, factors such as the inflammatory state may be influencing the levels of plasma sCD39 in OSA patients. Furthermore, our data indicates that T-lymphocytes in OSA do not release elevated levels of sCD39, implying that other cell types may play a role in sCD39 upregulation in OSA patients. Specifically, CD39 has been identified in plasma extracellular vesicles (EVs) of platelet and endothelial origin, maintaining catalytic activity.38 Hence, it is plausible that various cell types contribute to the heightened sCD39 levels observed in OSA patients.
Importantly, by unraveling an elevation of membrane-bound and/or soluble CD39 and CD73, our study provides novel insights about the underlying mechanisms eliciting ADO upregulation in sleep apnea patients. In this context, Findley, et al., demonstrated an upregulation of plasma ADO in OSA patients, which correlated with arterial oxygen desaturation during sleep.13,14 In agreement, other study revealed that ADO levels decreased after CPAP treatment,39 and an experiment carried out in healthy subjects demonstrated that the production of tissue adenosine increases even during 20min of moderate arterial hypoxemia.40 Accordingly, our results confirm the upregulation of ADO in a larger OSA cohort. Nevertheless, although the canonical CD39/CD73 pathway has a major role in the production of ADO, other pathways involving alternative ecto-enzymes, nucleoside transporters and intracellular adenosine metabolism can also contribute to the elevated plasma ADO concentrations.41 In this line, hypoxia plays a central role in the regulation of the purinergic system, by eliciting the release of extracellular ATP involving both active and passive mechanisms. Particularly, sphingosine-1-phosphate, a biologically active lipid upregulated in OSA patient plasma, is known to induce ATP release via volume-regulated anion channels, constituting a potentially mediatory mechanism.42–44 Moreover, hypoxia participates in the regulation of the expression of adenosine receptors, signaling factors, nucleoside transporters and alternative purinergic ecto-enzymes.26
Thus, in OSA patients the hypoxic environment may alter the adenosinergic system at several levels, enhancing the development of an immunosuppressive phenotype.
Our study has several limitations, which we acknowledge. First, the diagnosis of OSA in patients was based on validated respiratory polygraphy. Second, on our in vitro model the intermittent hypoxia cycles are longer than those suffered by OSA patients. Third, with our data, we could not conclude the origin of plasma sCD39 upregulation. Fourth, our study includes patients without any evidence of cancer, so we cannot conclude the effect of CD39/CD73/ADO alterations on tumor development or progression. Fifth, in this study we have only include severe OSA patients, thus the assessment of the observed alterations in mild-moderate stages of the disease would be of great interest. Sixth, this study does not provide any information on the effect of OSA treatment on CD39/CD73 expression or its effect on the development or progression of cancer.
In conclusion, our study reveals a hypoxia-mediated alteration of the CD39/CD73 axis in OSA patients, which could trigger ADO upregulation, thus potentially contributing to the immune suppressive environment and ultimately facilitating tumor development and progression. Interestingly, we reveal an upregulation of sCD39 and sCD73 in OSA plasma, suggesting T-cells as a potential source contributing to elevated sCD73 levels. In this line, circulating proteins represent the best sources for discovering easy-to-test and minimally invasive biomarkers. Therefore, our data highlights the need for new longitudinal studies evaluating CD39 and/or CD73 as potential cancer-risk prognostic biomarkers in OSA patients.
Authors’ ContributionsAldara García-Sánchez: Conceptualization, Data curation, Formal Analysis, Investigation, Methodology, Software, Writing – original draft, Writing – review & editing. Cristina López-Fernández: Methodology, Writing – review & editing. Carolina Cubillos: Conceptualization, Data curation, Formal Analysis, Funding acquisition, Investigation, Methodology, Project administration, Resources, Supervision, Validation, Writing – original draft, Writing – review & editing. Sara Vega: Conceptualization, Resources, Validation, Writing – review & editing. Elena Díaz-García: Data curation, Formal Analysis, Investigation, Methodology, Supervision, Writing – original draft, Writing – review & editing. Raquel Casitas: Formal Analysis, Methodology, Writing – review & editing. Francisco García-Río: Conceptualization, Formal Analysis, Funding acquisition, Investigation, Project administration, Resources, Supervision, Validation, Writing – original draft, Writing – review & editing. Eva Mañas: Formal Analysis, Methodology, Writing – review & editing. Francisco García-Río: Conceptualization, Formal Analysis, Funding acquisition, Investigation, Project administration, Resources, Supervision, Validation, Writing – original draft, Writing – review & editing. Irene Cano-Pumarega: Conceptualization, Formal Analysis, Methodology, Writing – review & editing. Enrique Alfaro: Data curation, Formal Analysis, Methodology, Writing – review & editing.
Funding SourcesThis study was supported by Instituto de Salud Carlos III (ISCIII) through the projects PI13/01512, PI16/00201 and PI19/01612, PI22/01262, P2022/BMD-7224 to F. García-Río and CP18/00028, PI19/01363 and PI22/01257 to C. Cubillos-Zapata; and co-funded by the European Union, Ayudas Luis Alvarez 2021 FIBHULP. C López-Fernández was supported by Investigo technician fellowship CAM.
Conflict of InterestAuthors declare no conflicts of interest.
We thank the blood donor's service of Hospital Universitario La Paz (Madrid, Spain) for their help in control subject recruitment.
The following are the supplementary data to this article:


